Marketing Analytics
Marketing Efficiency Ratio (MER): Formula, 2026 Benchmarks, and How to Track It Across Every Channel
Marketing efficiency ratio (MER) is total revenue divided by total marketing spend for the same period. An MER of 4 means every $1 of marketing produced $4 of revenue. Because MER uses your backend revenue instead of what each ad platform claims, it is the one efficiency number that can't be inflated by double-counted conversions.
If you have ever added up the conversions in Google Ads, Meta, and Microsoft Advertising and ended up with more sales than your store actually processed, you already know why MER has become the metric finance teams ask for first. Below I'll cover the formula, how MER differs from ROAS, the most useful benchmarks published this year, and the exact dashboard setup we recommend for tracking it without a spreadsheet.
What is marketing efficiency ratio (MER)?
Marketing efficiency ratio is a blended, attribution-free measure of how much revenue your business generates for each dollar of marketing spend. It is sometimes called blended ROAS. Instead of asking which channel earned credit for a sale, MER asks a simpler question: did the total marketing investment produce enough total revenue?
A business that books $200,000 in revenue on $50,000 of marketing spend has an MER of 4.0. When MER rises, revenue is growing faster than spend. When it falls, spend is outpacing revenue (Shopify).
MER works best as the top line of a marketing ROI framework, with channel-level metrics underneath it explaining where the movement came from.
What is the difference between MER, ROAS, and aMER?
MER measures all revenue against all marketing spend. ROAS measures the revenue a single ad platform attributes to itself against that platform's spend. aMER (acquisition MER) narrows MER to new-customer revenue only, which makes it the better read on whether paid media is actually growing the customer base.
| Metric | Formula | Revenue source | Best used for |
|---|---|---|---|
| MER | Total revenue ÷ total marketing spend | Your store, CRM, or finance system | Overall budget health and CFO reporting |
| ROAS | Platform-attributed revenue ÷ platform spend | Each ad platform's own tracking | Optimizing campaigns inside one platform |
| aMER | New-customer revenue ÷ total marketing spend | Store or CRM, filtered to first orders | Judging whether acquisition spend pays back |
None of these replaces the others. ROAS tells a media buyer which ad set to scale this afternoon. MER tells leadership whether the whole program is working. Teams get into trouble when they use platform ROAS to answer the leadership question.
Why does MER matter more for marketers in 2026?
MER matters more now because platform-reported numbers keep drifting further from reality while budgets stay flat. Every ad platform measures conversions inside its own walls, so a customer who clicks a Google ad, sees a Meta retargeting ad, and then buys can be claimed by both.
The gap is large. Ruler Analytics reviewed conversion data across e-commerce accounts and found platforms collectively claiming 30 to 50 percent more conversions than actually occurred. In one example they describe, Google Ads, Meta, and Microsoft reported 175 combined conversions against 95 real sales, an 84 percent overcount (Ruler Analytics). Every ROAS figure built on those conversions inherits the inflation.
Meanwhile, the money isn't growing. Gartner's 2026 CMO Spend Survey puts marketing budgets at 7.8 percent of company revenue, essentially flat from 7.7 percent in 2025, and 56 percent of CMOs say they lack the budget to execute their 2026 strategy (Marketing Dive). When every dollar is contested, the CFO wants a number that reconciles with the bank account. MER is that number.
Platform ROAS answers "which ad worked?" MER answers "did marketing work?" Finance only cares about the second question.
What is a good marketing efficiency ratio?
A good MER depends on your category and your margins, so there is no universal target. The most rigorous public benchmark this year comes from EightX, which calculated FY25 MER from the 10-K filings of nine public DTC and DTC-adjacent brands. The median was 8.47, with a range from 2.55 (Hims & Hers) to 19.07 (Simply Good Foods). Apparel brands clustered between 6.8 and 10.8, and the only public number EightX found from vendor benchmarks was Northbeam's "MER 5 or higher is good" (EightX).
Those benchmarks are useful context, but they come from large public companies with strong organic demand. A more practical starting point is your own breakeven MER, which comes straight from your contribution margin before marketing:
| Contribution margin before marketing | Breakeven MER | Comfortable target (1.5× breakeven) |
|---|---|---|
| 30% | 3.33 | 5.0 |
| 40% | 2.50 | 3.75 |
| 50% | 2.00 | 3.0 |
| 60% | 1.67 | 2.5 |
| 70% | 1.43 | 2.14 |
The 1.5× buffer is our rule of thumb, not an industry standard. It leaves room for overhead and returns. A brand with strong repeat purchase can run closer to breakeven on aMER because later orders cover the first one; a one-time-purchase business can't.
How do you calculate MER? A 5-step process
Calculating MER takes five decisions, and consistency matters more than any single choice. Lock these definitions once and keep them every month, or your trend line will move for reasons that have nothing to do with performance.
- Pick the time window. Use a trailing 90 days or 12 weeks for strategic reads. EightX notes that four-week MER is noisy and better suited to tactical checks.
- Define revenue. Use net revenue after refunds and chargebacks. Switching between gross and net can flatter MER by 4 to 8 percent depending on your return rate (EightX).
- Define spend. Include media plus agency fees, creative production, influencer payments, and marketing tools. Media-only spend makes MER look better than it is.
- Pull revenue from the source of truth. That means your Shopify store, CRM, or finance system, never the sum of ad platform conversions.
- Trend it and segment it. Track MER over time next to aMER and channel spend mix so you can see why it moved, not just that it moved.
What does MER look like in a real report? A worked example
Here is an illustrative quarter for a mid-size e-commerce brand, the kind of math we walk through with teams setting up their first blended dashboard. The numbers are hypothetical, but the pattern is one we see constantly.
| Line item | Value |
|---|---|
| Google Ads spend | $60,000 |
| Meta (Facebook and Instagram) spend | $45,000 |
| Amazon Ads spend | $15,000 |
| Total marketing spend | $120,000 |
| Revenue claimed by the three platforms combined | $610,000 |
| Net revenue in the store backend | $480,000 |
| Net revenue from new customers | $260,000 |
| Contribution margin before marketing | 45% |
Adding up platform ROAS suggests a 5.08 return ($610,000 ÷ $120,000). The real MER is 4.0 ($480,000 ÷ $120,000), so the platforms overstate efficiency by about 27 percent. MER of 4.0 sits comfortably above the 2.22 breakeven for a 45 percent margin, so the overall program is healthy.
The aMER tells a different story. New-customer revenue divided by spend is 2.17, just under breakeven. This brand is paying slightly more to acquire a customer than that first order returns, which is fine only if repeat purchases are strong. That is the conversation worth having with leadership, and you would never reach it from platform dashboards alone.
How do you build an MER dashboard in TapClicks?
An MER dashboard needs three things: every ad platform's spend in one place, a trusted revenue source next to it, and a formula that recalculates automatically. Here is how teams set it up in TapClicks, step by step.
1. Blend ad spend into one channel with a single prompt
Connect your ad accounts through TapClicks' 250+ native integrations, including Google Ads, Facebook Ads, and Amazon Ads. Then ask the Channels Operator Agent to combine them. It confirms each source is connected, matches the dimensions and metrics they share, such as campaign name and spend, and builds one blended channel you can report on immediately.
2. Add revenue from your source of truth
Bring in revenue from the system finance trusts: the Shopify connector for e-commerce, GA4 for site-level transactions, or a flat file from your CRM or ERP. This is the step that makes MER honest, because the numerator no longer depends on any ad platform's attribution model.
3. Create MER, aMER, and breakeven MER as calculated metrics
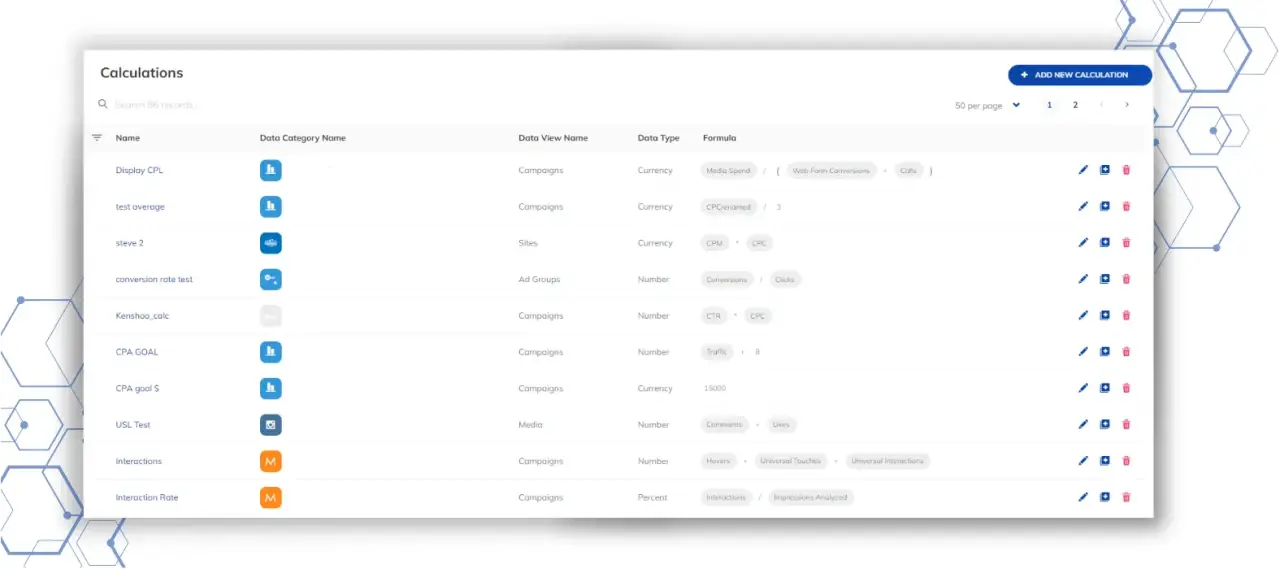
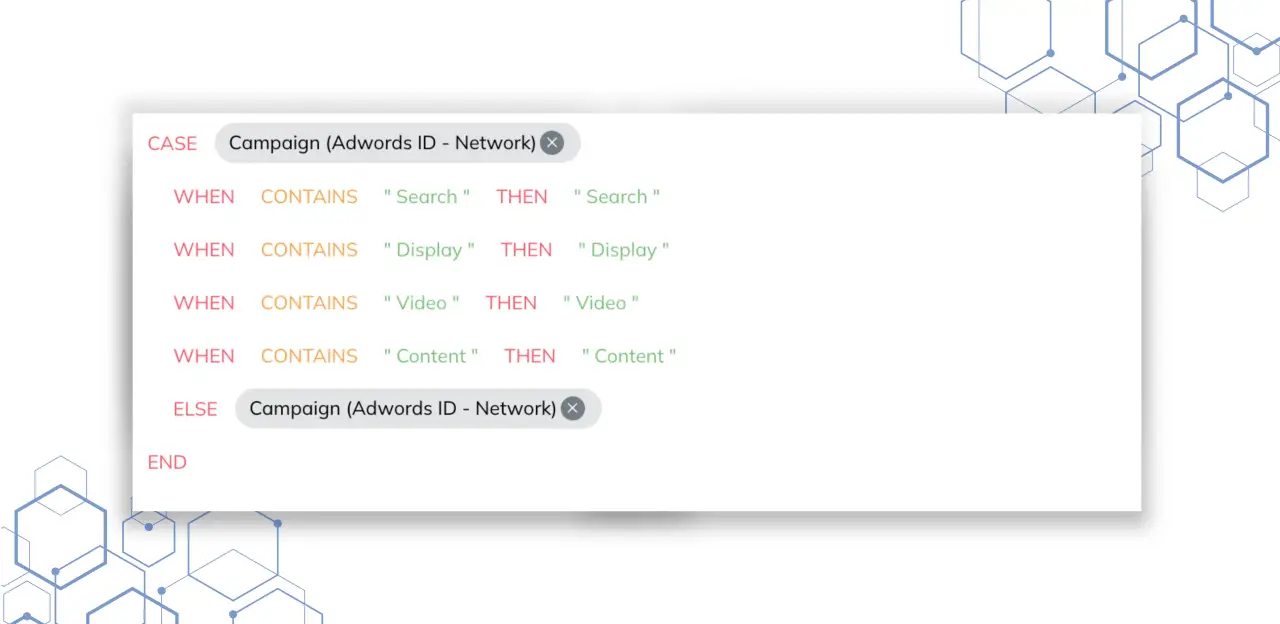
With Advanced Calculations, you define MER once as net revenue divided by blended spend and it updates everywhere the metric appears. Conditional calculations let you apply business logic, for example adding agency fees and creative costs to the denominator, or labeling each week as above or below breakeven.
4. Pace spend against an MER target and get alerted when it slips
TapGoals tracks budgets and KPIs daily and recalculates the spend pace needed to stay on target. Pair it with Configurable Alerts so the team gets an email when MER falls below breakeven, instead of discovering it in the month-end report. For more on catching these shifts early, see our guide to AI anomaly detection in marketing dashboards.
5. Ask why MER moved instead of digging for it
When MER drops from 4.2 to 3.6, the next question is always why. Ask Your Dashboard lets you type that question in plain language and get a data-backed answer from the dashboard itself, and AI Executive Summaries turn the widget into a written explanation you can drop into a client report or QBR.
Watch TapClicks AI agents answer performance questions directly inside a dashboard.
For agencies: report MER at client cost
Agencies that bill media with a markup need MER calculated on what the client actually paid. Margin and Markup Rules apply client-specific adjustments to cost fields automatically, so the MER a client sees matches their invoice rather than your platform cost.
What are the most common MER mistakes?
Most MER errors come from inconsistent definitions rather than bad math. These five show up most often.
- Mixing gross and net revenue. Pick net and stay with it.
- Leaving non-media costs out of spend. Agency fees, creative, and tools are marketing spend. Excluding them flatters MER and breaks comparisons to public benchmarks.
- Reading weekly MER as a verdict. Short windows swing with promotions and shipping cutoffs. Use trailing 90 days for decisions.
- Benchmarking against the wrong category. A telehealth subscription brand and a grocery CPG brand will never share a target. Start from your own breakeven MER.
- Cutting channels on MER alone. MER often dips when you invest in prospecting, because new-customer revenue lags the spend. Check aMER and channel-level trends, and use marketing mix modeling or incrementality tests before cutting a channel.
MER is the anchor, not the whole story. It works best alongside multi-touch attribution and MMM, each answering a different question.
Frequently asked questions about marketing efficiency ratio
Is MER the same as blended ROAS?
Yes, in most usage. Both divide total revenue by total marketing spend. Some teams reserve "blended ROAS" for media spend only and use "MER" when fees, creative, and tools are included. Whatever you call it, define the inputs once and keep them consistent.
What is the difference between MER and ROAS?
ROAS uses revenue that a single ad platform attributes to its own ads. MER uses total business revenue from your store or CRM against all marketing spend. ROAS guides in-platform optimization; MER shows whether the overall marketing program is profitable.
What is a good MER for e-commerce?
It depends on margin and category. FY25 public DTC brands ranged from 2.55 to 19.07 with a median of 8.47, according to EightX. For your own business, calculate breakeven MER as 1 divided by contribution margin, then aim comfortably above it.
Should MER include organic revenue?
Yes. Blended MER includes all revenue, including organic, email, and direct. If you only want to measure how efficiently spend acquires new customers, calculate aMER separately using new-customer revenue as the numerator.
How often should I report MER?
Monitor it weekly and make decisions on a trailing 90-day view. Weekly MER catches sudden problems such as broken tracking or a runaway campaign, while the longer window smooths out promotions and seasonality.
See your real MER, not the platforms' version
TapClicks blends spend from every ad platform with the revenue your finance team trusts, then keeps MER, aMER, and pacing current automatically.