Cross-Channel Performance
Compare search, social, display, email, CRM, and other marketing data in one view.
See Custom Channels →
Gain Actionable Insights into your Business
SmartAnalytics gives marketing teams a unified way to analyze performance across campaigns, channels, and data sources. Bring marketing data together in interactive dashboards, explore trends and anomalies, blend datasets, and build custom views that help your team understand what is driving performance.

Proactively discover hidden trends, anomalies, and opportunities. Drive growth and optimize ROI across all marketing campaigns. Outperform competitors and see further than just point-in-time performance.
Digital Marketing Analytics
SmartAnalytics helps teams move beyond individual platform reports to understand marketing performance across the full customer and campaign ecosystem.
Use it to:
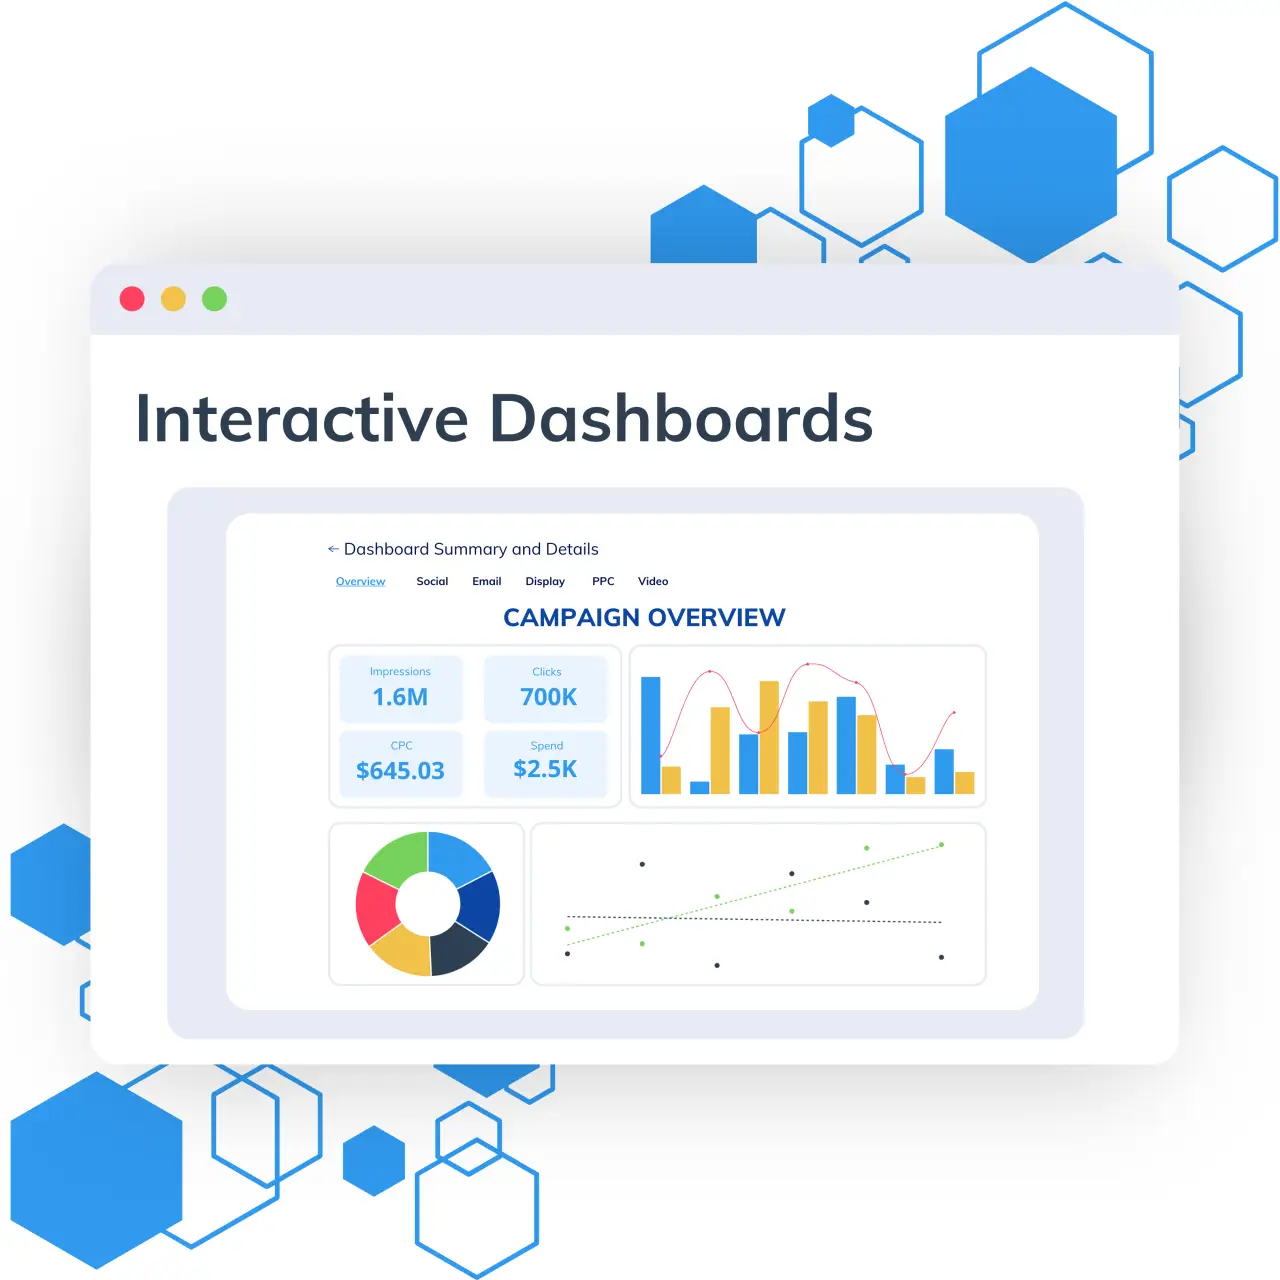
Transform your data into dynamic visual stories with TapClicks Interactive Dashboards. Unify your data from multiple platforms into an adaptable, customizable view. These dashboards automatically adjust to changes in your connected data sources, ensuring your insights are always up-to-date.
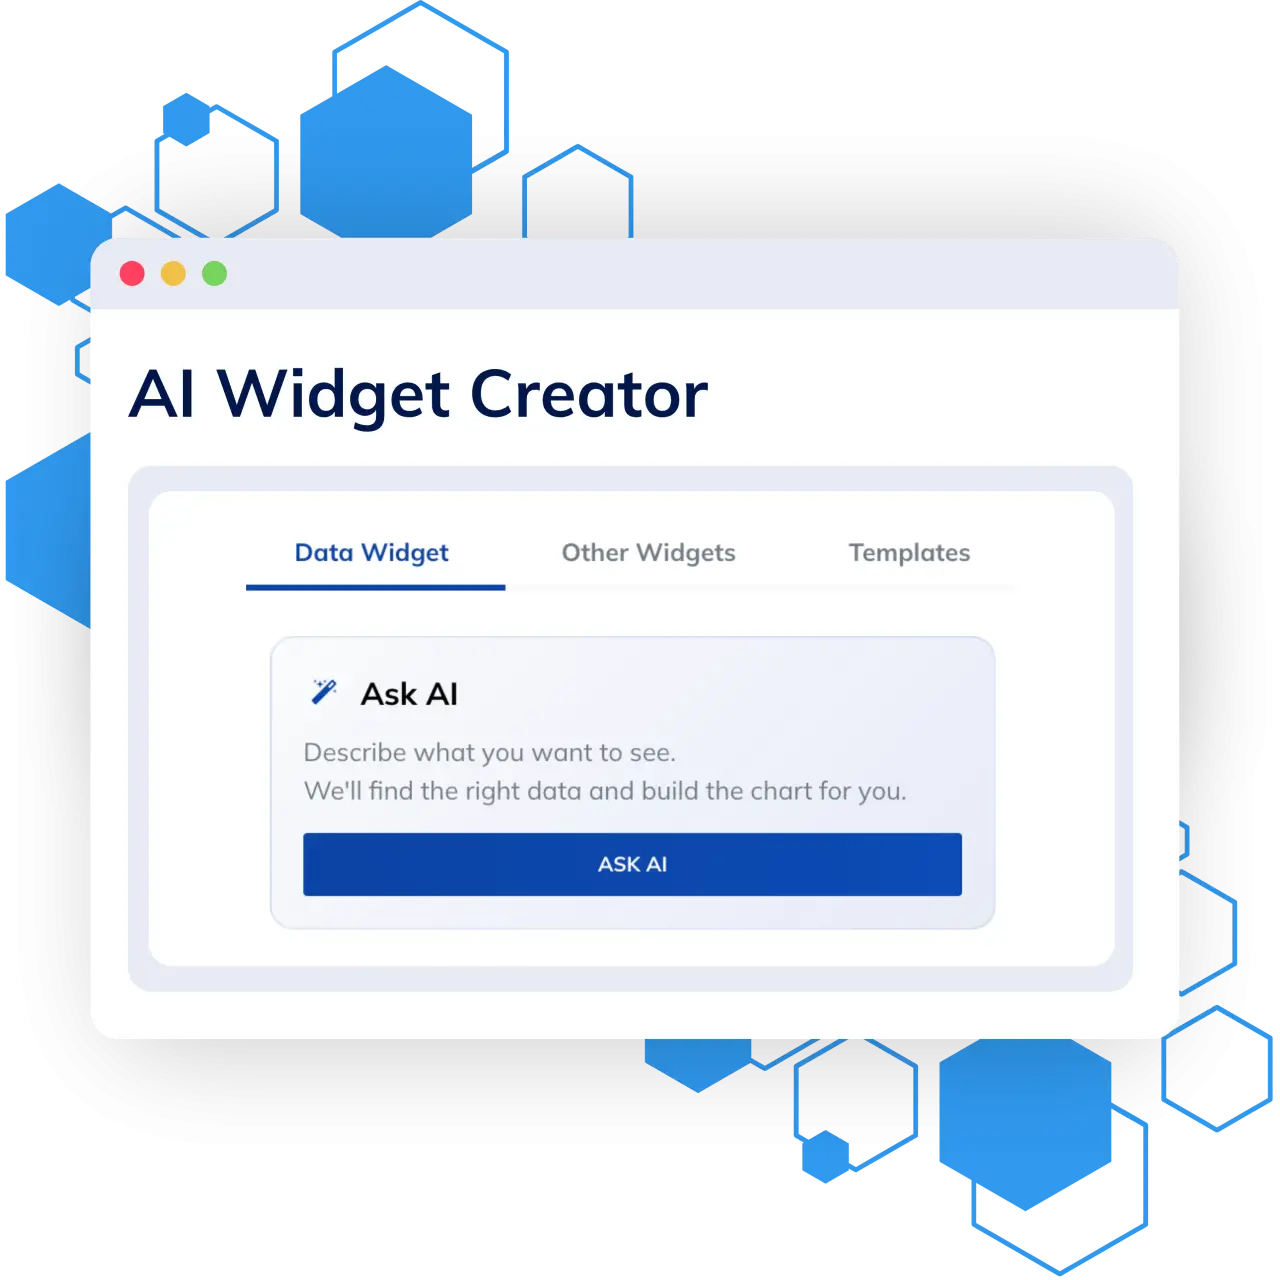
Skip the manual build. With AI-powered widget creation, you can generate the exact view you need in seconds, so you spend less time configuring and more time acting on your data.
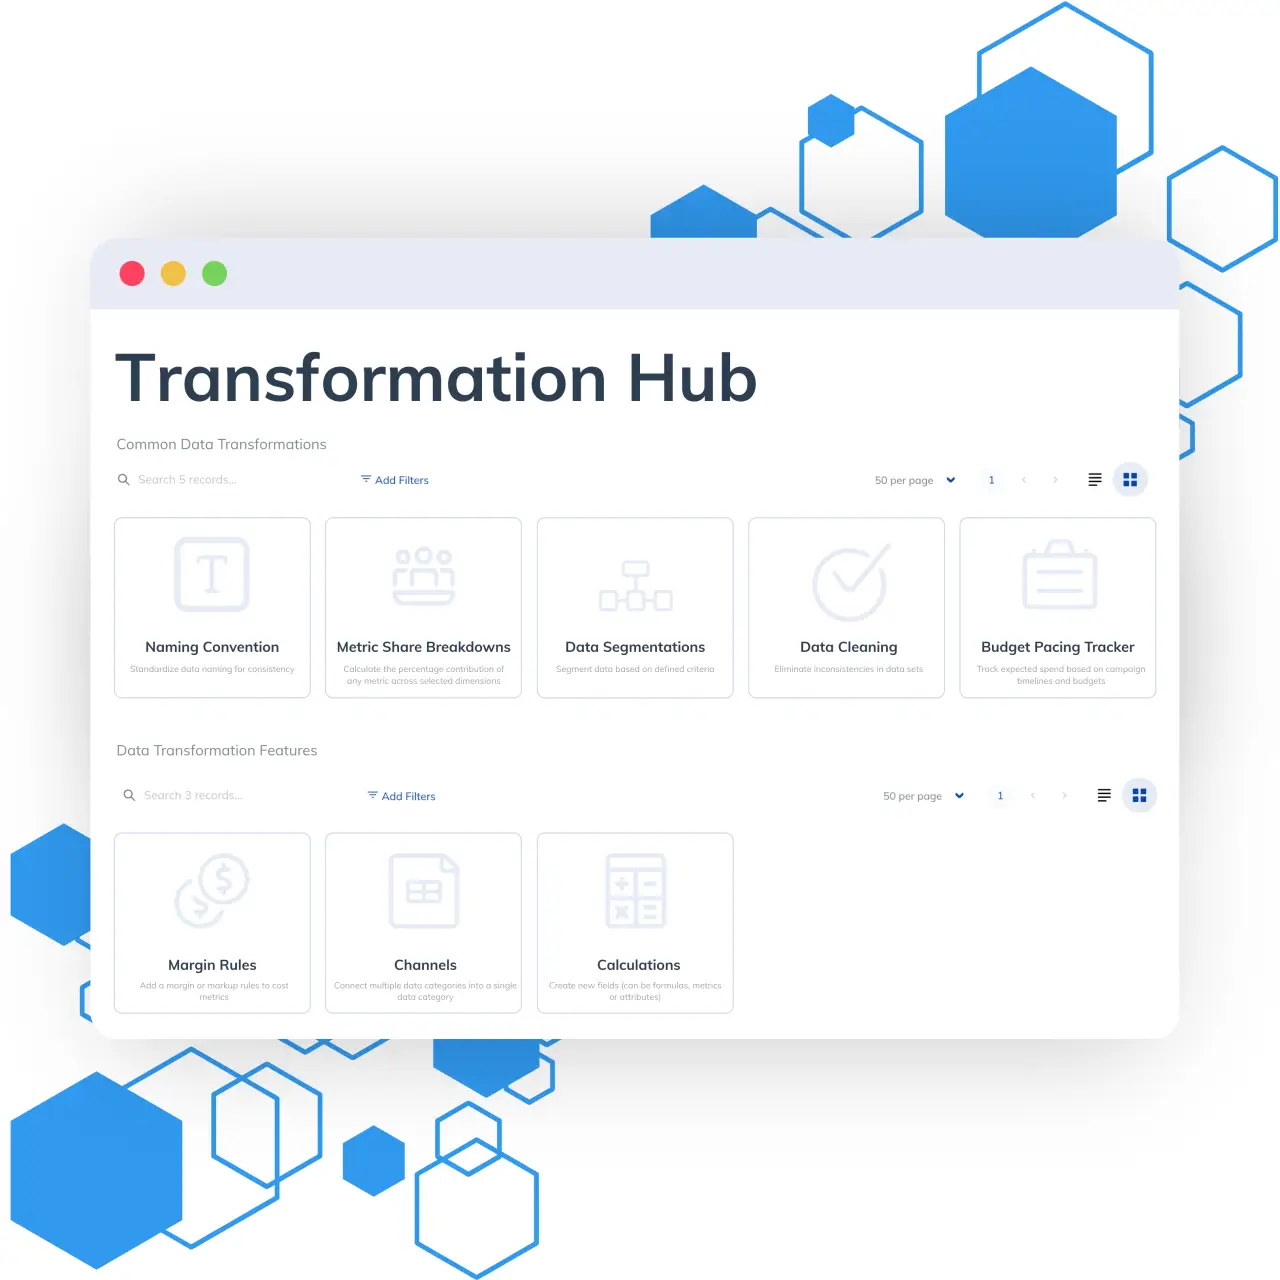
The Transformation Hub is your built-in data prep engine, purpose-built for marketers who need clean, consistent, analysis-ready data, fast. With powerful transformation tools and flexible rule sets, it helps unify naming, clean up fields, segment metrics, and pace budgets without added complexity.
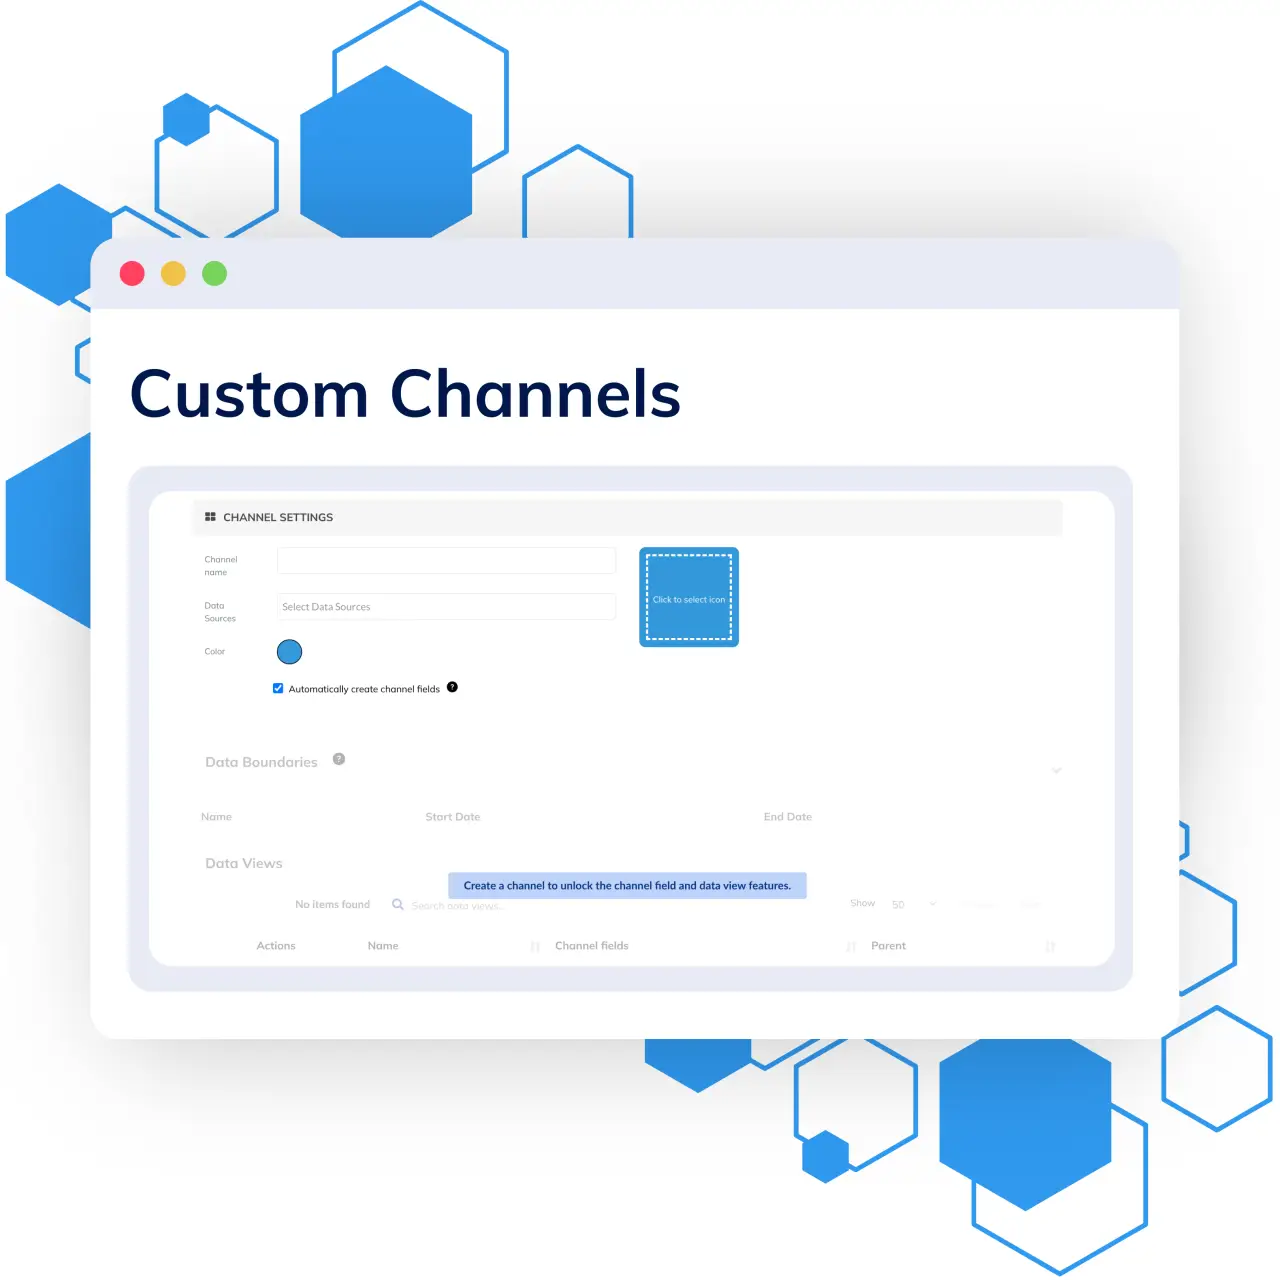
Create your own custom channels in TapClicks to combine data from various sources, creating tailored dashboards that perfectly align with your unique analytical needs and narrative.
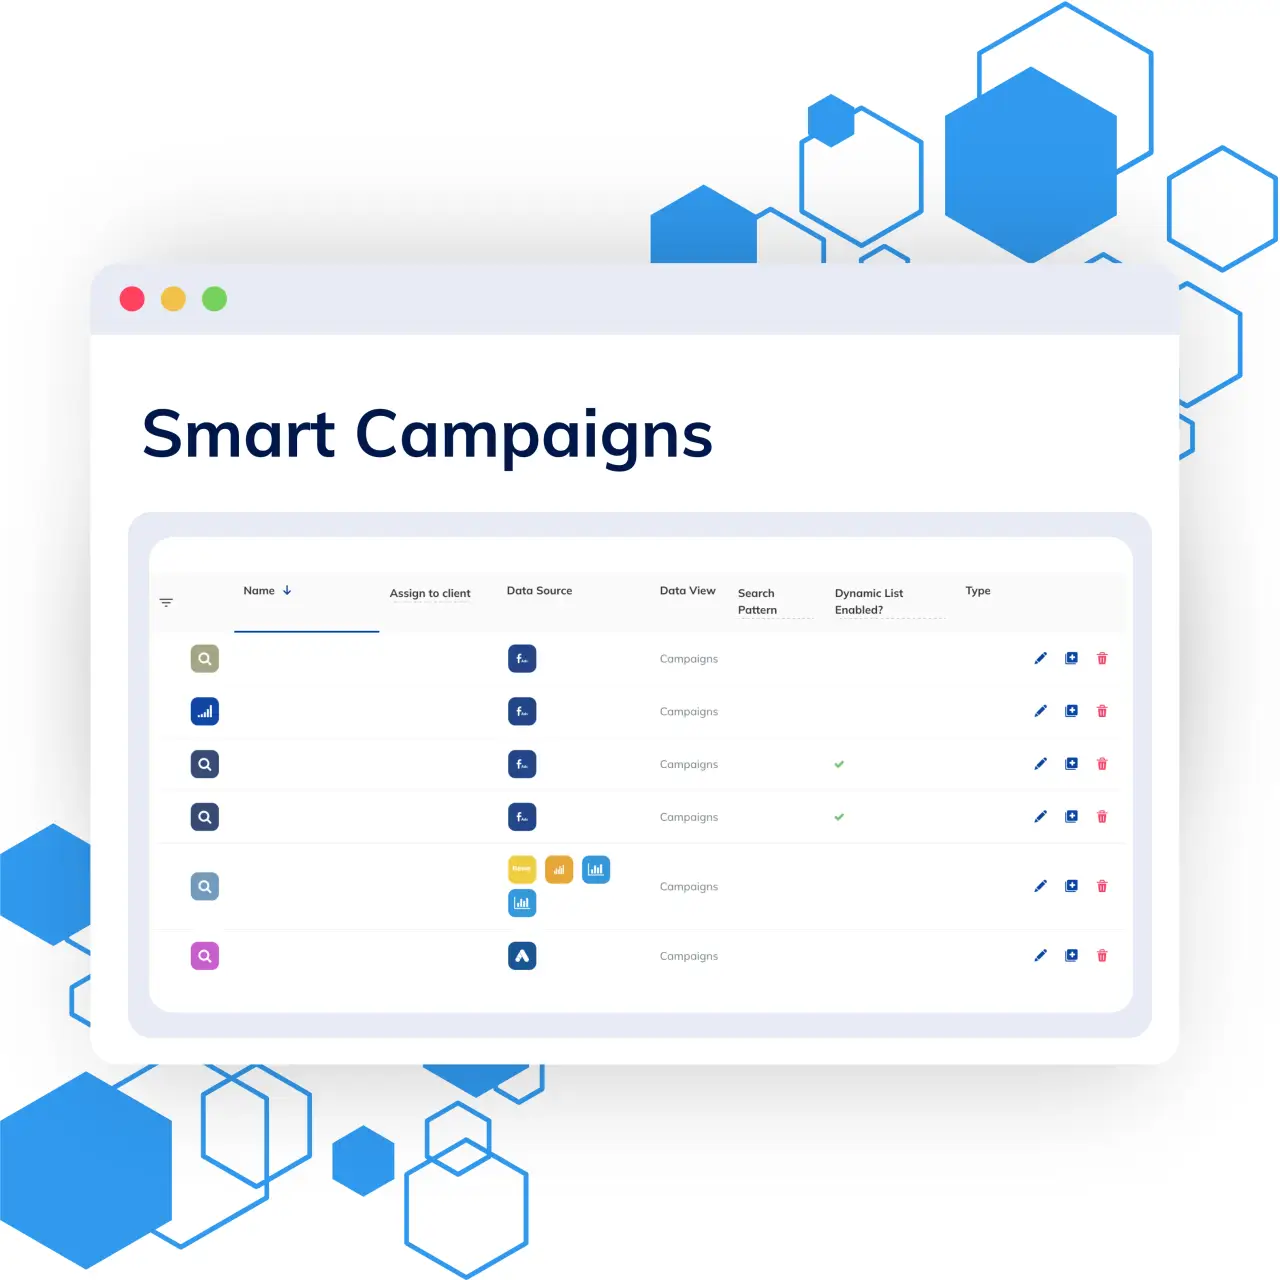
Smart Campaigns streamline the management of multiple marketing campaigns by consolidating them into a single unit for easy tracking and reporting. By joining campaigns based on fields like campaign or account ID, Ad Operations teams can monitor collective engagement and budget performance.
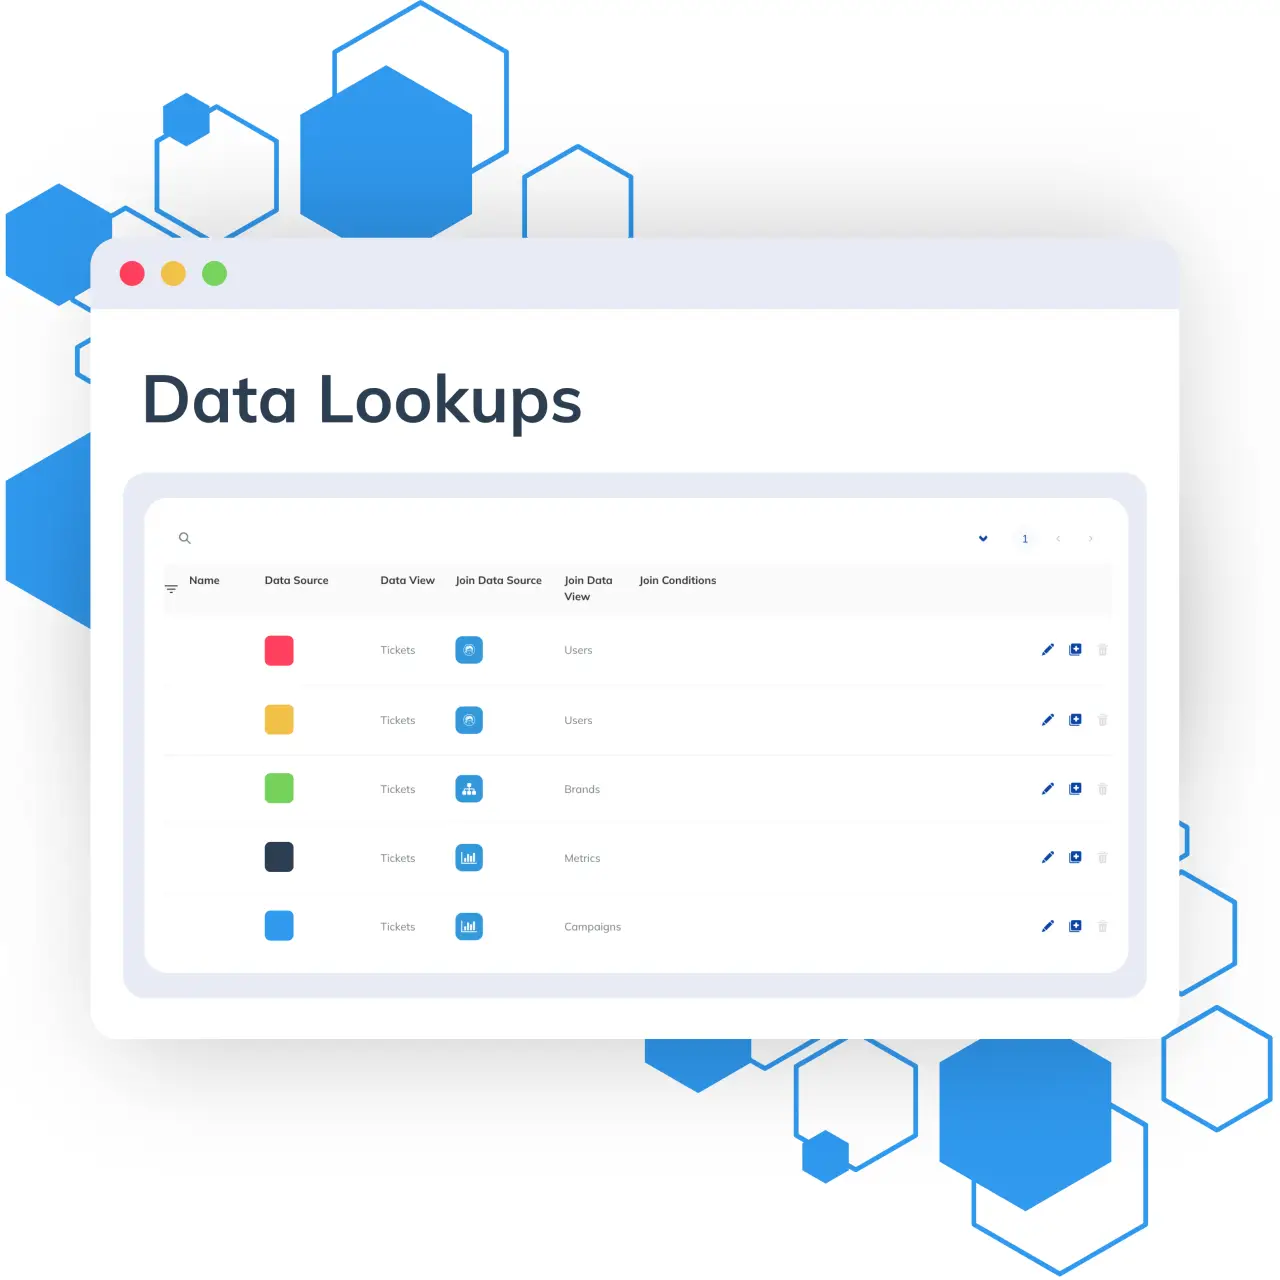
Connect and enrich your datasets effortlessly for more comprehensive analytics and insights. TapClicks Data Lookups join data sources on different fields, integrating additional metrics and dimensions for enhanced analysis and blended visualizations.
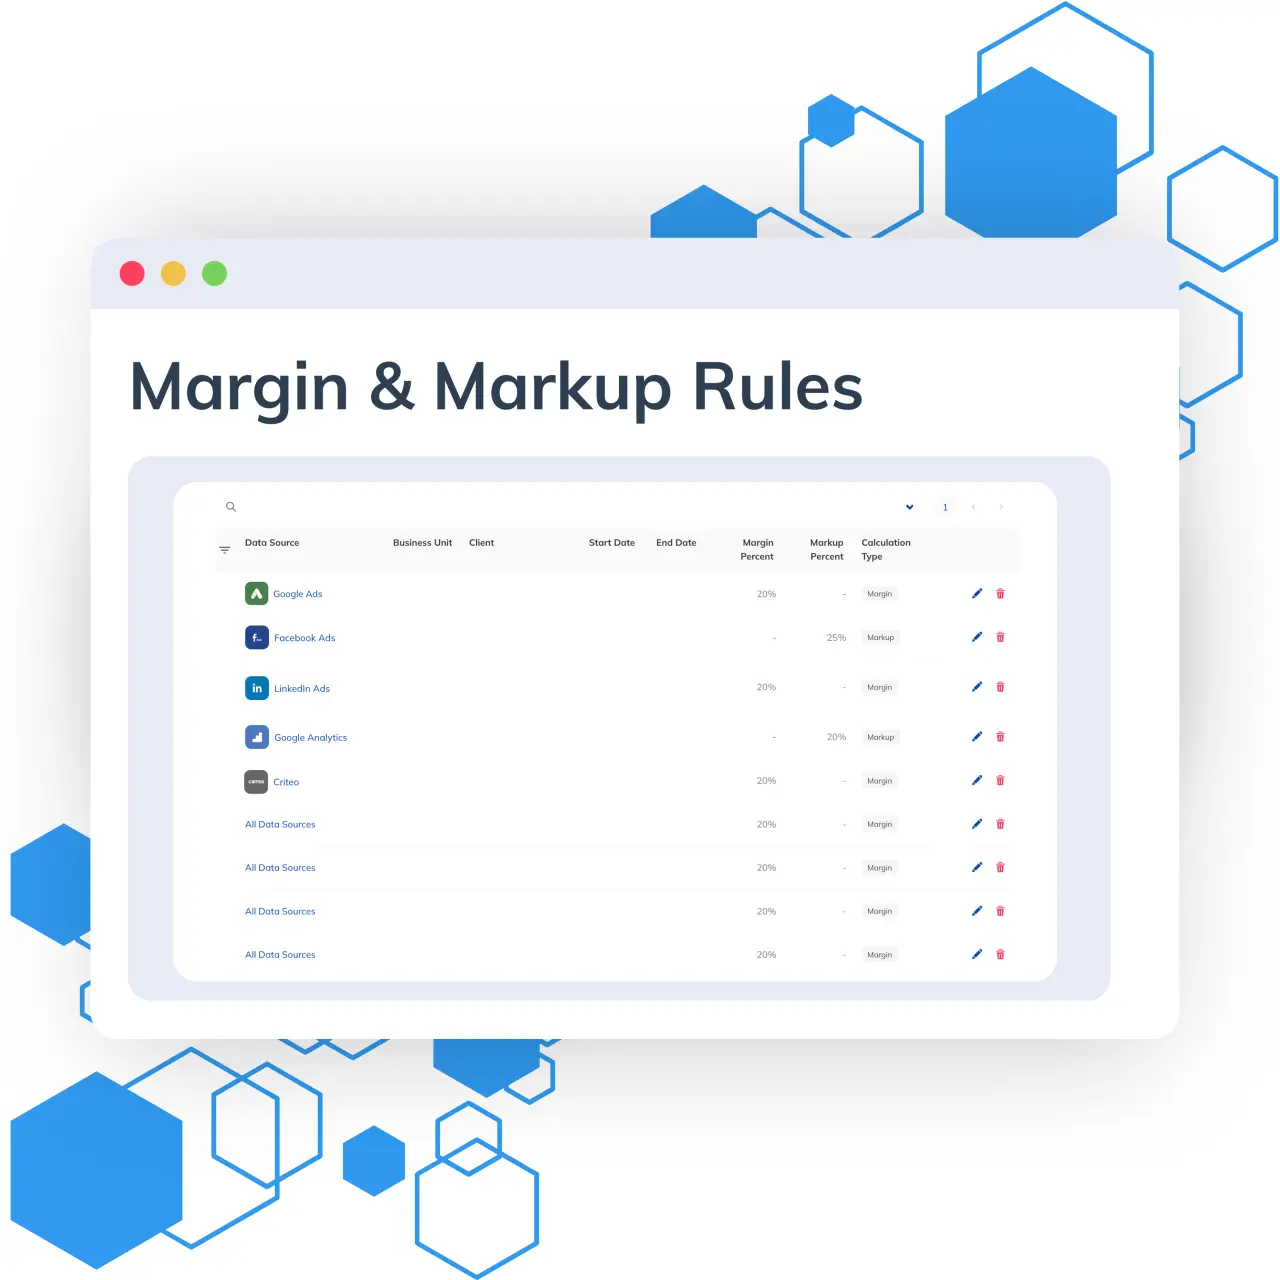
Optimize financial reporting with dynamic margins and markups for precise cost adjustments. These rules offer flexibility across services, business units, and customers, ensuring financial adjustments align with specific goals.

Specialized instances of TapAnalytics for you and your healthcare clients. Follows HIPAA rules and PII standards.
Use Cases
SmartAnalytics puts the marketing analytics tools your team needs in one place, so you can look at performance from every angle.
Compare search, social, display, email, CRM, and other marketing data in one view.
See Custom Channels →Track spend, conversions, engagement, ROAS, and other KPIs across campaigns.
See Smart Campaigns →Monitor spending and campaign pacing to identify potential issues earlier.
See Transformation Hub →Create different analytical views based on client, campaign, business unit, channel, or stakeholder needs.
See Interactive Dashboards →"They helped streamline and automate the process, saving us enough in man-hours alone to achieve our ROI goals. Most importantly, we now have a tool that helps us attract new clients as well as up-sell and better retain our existing clients."
 – Greg Dowd, President
"TapAnalytics helps our clients toll up all campaign information in a single customizable dashboard, with on-demand reporting, saving a huge amount of time and effort."
 – Kevin Layton, Sr. Director Customer Success
FAQ
Tap any question to expand the answer.
Digital marketing analytics is the practice of collecting and analyzing performance data from your marketing channels, such as search, social, display, and email, to understand what is driving results. It goes beyond individual platform reports to show how campaigns and channels perform together.
Marketing analytics software brings data from multiple marketing platforms into one place so teams can monitor KPIs, spot trends and anomalies, and compare performance across campaigns and channels. SmartAnalytics adds interactive dashboards, data blending, and custom performance views so teams can explore data without rebuilding reports manually.
Yes. SmartAnalytics unifies data from multiple platforms, and Custom Channels and Data Lookups let you blend sources into combined views for cross-channel analysis.
Yes. Interactive Dashboards combine data from multiple platforms into a customizable view that updates automatically as your connected data changes, and the AI Widget Creator can generate the exact view you need in seconds.
Marketing reporting packages results into reports and presentations that are delivered to clients and stakeholders on a schedule. Marketing analytics is the exploration behind those reports: digging into data to find trends, anomalies, and what is driving performance. TapClicks covers both, with SmartAnalytics for analysis and SmartReports and AI Reporting for automated reporting.

The AI-Powered Marketing Intelligence Platform. Where data intelligence becomes competitive advantage.









TapClicks © 2026. All Rights Reserved.