
Marketing Analytics
Marketing Attribution in 2026: Why Multi-Touch and Marketing Mix Modeling Have to Work Together
In 2026, no single attribution model is enough on its own. Multi-touch attribution (MTA) tells you which channels and campaigns to adjust this week; marketing mix modeling (MMM) tells you where to shift budget this quarter.
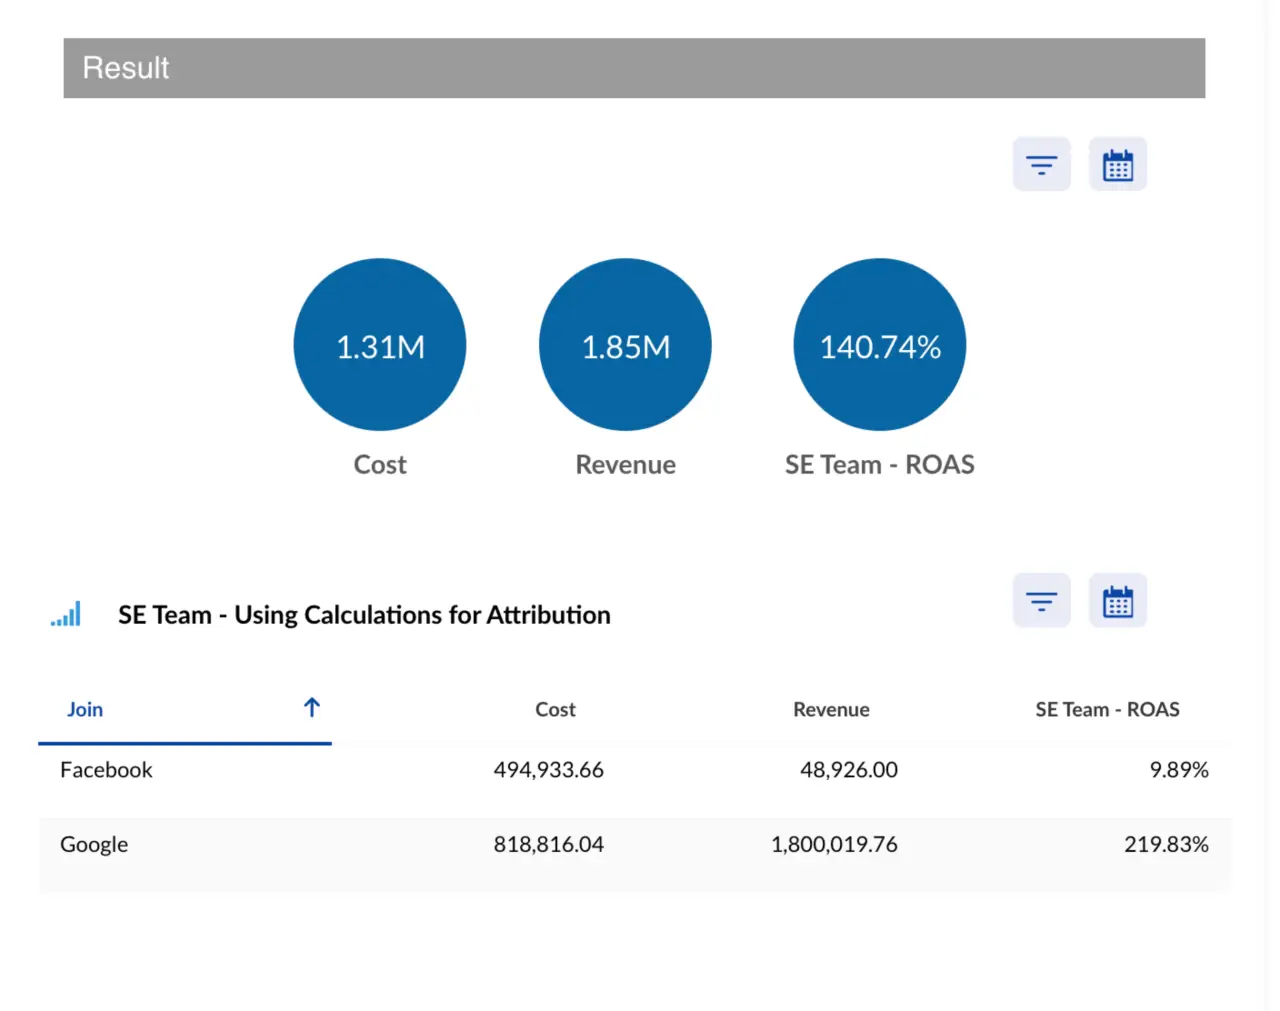
The simplest way to think about MTA vs. MMM is that they answer different questions. MTA uses identifiable customer touchpoints to help marketers make tactical campaign decisions, while MMM uses aggregate data to estimate how channels contribute to broader business outcomes and inform strategic budget allocation.
Teams that pick only one are optimizing off an incomplete picture — and the data backs this up: MTA adoption has grown to 47% of marketing teams (up from 31% in 2023), while MMM adoption has nearly tripled to 26% (up from 9% in 2023), according to attribution research compiled by Digital Applied. The two aren’t replacing each other. They’re running in parallel, on purpose.
That shift matters because the old argument — “which attribution model is correct?” — was always the wrong question. The right question is which decisions each model is built to answer, and how you reconcile them so finance, media buyers, and leadership are looking at the same business outcomes.
What Broke Last-Click Attribution?
Last-click attribution gives 100% of the credit to whatever channel touched the customer right before conversion, ignoring everything that came before it. It was never a complete picture, but it was more workable when cookies and device IDs gave marketers greater visibility into user-level journeys.
That’s no longer true. Third-party cookie restrictions and platform-level privacy controls have reduced usable identity coverage for user-level tracking, according to measurement frameworks reviewed by House of Martech.
Despite that, last-click habits die hard. B2B buyer journeys frequently span multiple touchpoints, which means giving the final interaction all the credit can underrepresent the channels that created awareness, consideration, and demand earlier in the journey.
That gap — a shrinking view of the journey next to a lengthening one — is exactly why attribution has become a broader business problem instead of an analytics footnote.
Multi-Touch Attribution vs. Marketing Mix Modeling: What’s the Actual Difference?
Multi-touch attribution (MTA) assigns fractional credit to identifiable touchpoints in a customer’s journey — an ad click, an email interaction, a demo request — using rules-based or algorithmic models. It relies heavily on user-level or session-level data, which has become harder to collect consistently.
Marketing mix modeling (MMM) is an econometric technique that does not depend on individual-level tracking. It uses aggregate spend and outcome data — often by channel, time period, and geography — to estimate each channel’s contribution to business outcomes while accounting for factors such as seasonality, pricing, and promotions.
The practical difference comes down to what each model is designed to do:
| Comparison | Multi-Touch Attribution (MTA) | Marketing Mix Modeling (MMM) |
|---|---|---|
| Primary purpose | Understand identifiable customer touchpoints | Estimate broader channel contribution |
| Data needed | User/session-level tracking | Aggregate spend + outcome data |
| Best for | Tactical, channel-level decisions | Strategic budget allocation |
| Time horizon | Near real-time | Longer-term, typically monthly+ |
| Offline/brand spend | Limited visibility | Can incorporate TV, out-of-home, sponsorships, and other offline activity |
| Primary strength | Granular campaign optimization | Broader measurement across channels and business factors |
| Primary limitation | Depends on observable customer journeys | Less granular for individual campaigns and users |
| Typical decision | “Which campaigns should we optimize this week?” | “Where should we allocate budget next quarter?” |
Sources: Digital Applied 2026 Attribution Statistics, House of Martech MMM vs. MTA Framework
Is Multi-Touch Attribution Losing Credibility?
MTA isn’t dead, but expectations around what it can prove have changed.
Multi-touch attribution remains useful when marketers have reliable user- or session-level data and need granular information for campaign optimization. It can help teams understand observable customer journeys, compare campaigns, evaluate creative, and make frequent media adjustments.
The problem comes when MTA is treated as a complete measurement of marketing impact.
Privacy restrictions, disconnected devices, offline interactions, untracked touchpoints, and longer buying cycles all create gaps in user-level journeys. That means MTA can provide a useful tactical view without capturing every factor that influenced revenue.
MMM helps fill a different part of that measurement gap by using aggregate data to evaluate broader channel contribution without requiring every individual customer interaction to be observed.
The question for enterprise marketers is therefore less “Can we still use MTA?” and more “Which decisions can we reasonably make from MTA, and which require another measurement method?”
Why the 2026 Default Is Running Both, Not Choosing One
The dual-model approach isn’t a compromise — the two models answer different questions and help check each other’s blind spots.
MTA tells a paid social manager whether Tuesday’s carousel ad is pulling its weight. MMM tells a CMO whether the $2M shifted from TV to connected TV last quarter actually moved revenue.
Neither model can answer the other’s question particularly well, and treating either as a single source of truth can create attribution conclusions that are difficult to defend.
Part of what made this dual approach more practical is accessibility. MMM historically required specialized expertise and significant investment. Google’s open-source Meridian framework has helped make MMM more accessible to marketers and data teams.
Why Do MTA, MMM, and Last-Click Attribution Give Me Different Results?
Because they are measuring marketing performance from different perspectives.
Consider a simplified example. A company spends on paid search, paid social, and connected TV:
- Last-click attribution shows paid search driving most conversions because customers frequently search for the brand shortly before buying.
- MTA gives some additional credit to paid social because identifiable customers interacted with social ads earlier in their journeys.
- MMM indicates that connected TV contributed more incremental revenue than either digital attribution model suggests because sales increased in markets and periods where CTV investment increased.
Those results are not necessarily contradictory.
Paid search may be capturing demand near the bottom of the funnel. Paid social may be participating earlier in observable customer journeys. CTV may be creating demand that later appears as branded search or direct traffic.
The mistake would be choosing whichever model produces the preferred answer.
How to Reconcile Conflicting Attribution Results
When your attribution models disagree:
- Confirm the time periods match. A weekly MTA report and quarterly MMM analysis are not measuring the same window.
- Check the revenue definition. Make sure each model is working from the same definition of conversions, sales, pipeline, or revenue.
- Review what each model can observe. MTA may miss offline and unidentifiable interactions that MMM can capture at an aggregate level.
- Look for lag effects. Brand and upper-funnel channels may influence purchases weeks after exposure.
- Check data quality and integration. Missing CRM records, inconsistent channel names, duplicate spend, or incomplete offline data can create artificial differences.
- Use the result for the decision it supports. MTA can guide tactical optimization while MMM can inform broader budget allocation.
The goal isn’t to force the models to produce the same number. It’s to understand why they differ and what each result can reasonably tell you.
What Does Real Revenue Attribution Look Like in 2026?
Real revenue attribution is less about assigning one perfect percentage of credit to every channel and more about connecting marketing measurement to actual business decisions.
For example, imagine MTA shows that paid search consistently closes identifiable conversions at an efficient CPA, while MMM indicates that reducing upper-funnel video investment would lower total incremental revenue.
The decision isn’t necessarily to move budget entirely toward the channel with the strongest attributed conversion rate.
Instead, the marketing team might use MTA to optimize campaigns, keywords, creative, and bids within paid search while using MMM to determine how much total budget should remain allocated to paid search, video, social, and other major channels.
That is what useful revenue attribution should enable: better decisions at the level each measurement method can actually support.
The Real Bottleneck Isn’t Which Model You Pick — It’s Your Data
Here’s the finding that should reframe how most teams approach attribution: when marketers were asked what actually blocks better measurement, the top answer wasn’t model sophistication or AI capability. It was data integration.
In the MarTech.org 2025 State of Your Stack Survey, 65.7% of respondents named data integration as their top martech management challenge — more than cited budget, skills, or tooling gaps, according to MarTech.org’s 2025 survey findings.
This is the piece attribution debates usually skip. You can pick the theoretically perfect blend of MTA and MMM, but if your ad platforms, CRM, CMS, and offline spend data all live in disconnected systems, neither model gets clean inputs — and the outputs won’t survive a CFO’s second question.
Fixing the plumbing — a unified data layer that both models can pull from — can do more for attribution reliability than simply switching models.
How to Reconcile MTA and MMM Without Hiring a Data Science Team
- Centralize the raw inputs first. Pull spend, impressions, clicks, CRM opportunity data, and offline/brand spend into one connected reporting layer before you touch modeling. A data-integration platform like TapData can help connect and normalize these sources.
- Run MTA for channel-level, weekly optimization. Use it to reallocate ad spend within a campaign, test creative, and manage bid strategy — decisions where timely, granular data matters.
- Run MMM for budget-level decisions. Use a framework like Meridian or another MMM solution to evaluate whether shifts between major channels are contributing to broader business outcomes.
- Reconcile, don’t average. When MTA and MMM disagree on a channel’s value — which they can — treat it as a signal to investigate factors such as brand lift, lag effects, view-through exposure, offline activity, or conversion delays, not a number to split down the middle.
- Report both numbers to leadership, labeled. Presenting a single blended “attribution number” without showing which model produced it can create confusion. Show the MTA and MMM views side by side with consistent date ranges, metric definitions, and revenue definitions.
What Most Marketing Teams Still Get Wrong
The most common mistake isn’t choosing the wrong model — it’s presenting an attribution number without disclosing which model produced it, then getting caught when finance asks a follow-up question the model can’t answer.
This is a credibility problem as much as a measurement one.
The fix isn’t necessarily a better model. It’s showing your work: which model, which data, which time period, what business outcome you’re measuring, and what the model doesn’t cover.
Where TapClicks Fits in a Two-Model Attribution Stack
Reconciling MTA and MMM is a data integration and reporting challenge before it’s a modeling challenge.
TapData provides the data layer, connecting marketing sources and helping teams normalize, blend, transform, and prepare data for analysis.
TapClicks’ Data Transformation Agent can help build consistent marketing calculations and clean or standardize data fields, reducing discrepancies before metrics reach reports and dashboards.
From there, TapClicks Dashboards can bring data from multiple marketing platforms into a consolidated reporting view.
The goal isn’t to turn two different measurement methodologies into one attribution number. It’s to create a reporting environment where teams can evaluate their measurement outputs alongside consistent underlying marketing data and make the appropriate decision from each.
Frequently Asked Questions About Marketing Attribution
Tap any question to expand the answer.
Is multi-touch attribution dead in 2026?
No. Multi-touch attribution still provides useful tactical information about identifiable customer journeys and campaign performance. Its limitation is that it cannot capture every marketing influence, particularly as privacy restrictions and fragmented customer journeys reduce user-level visibility. That’s why MTA is increasingly used alongside broader measurement methods such as MMM rather than as a complete attribution system on its own.
What’s the difference between MTA and MMM?
MTA uses user- or session-level touchpoint data to help marketers understand identifiable customer journeys and optimize campaigns. MMM uses aggregate marketing and business data to estimate broader channel contribution and inform strategic budget allocation.
Why does my last-click attribution disagree with MMM?
Last-click gives conversion credit to the final identifiable interaction, while MMM evaluates broader relationships between marketing investment and business outcomes over time. A channel can therefore influence revenue without frequently appearing as the final click before conversion.
What’s the biggest barrier to accurate marketing attribution?
Data integration is a major challenge. If spend, campaign, CRM, offline, and revenue data use inconsistent definitions or live in disconnected systems, both tactical attribution and broader modeling become harder to compare and interpret.
Do I need a data science team to run marketing mix modeling?
Not necessarily. Google’s Meridian MMM framework is open source and available to marketers and data scientists. However, MMM still requires appropriate data, model configuration, validation, and interpretation. Making the software accessible does not eliminate the analytical work involved.
Should MTA and MMM ever show the same number for a channel?
Not necessarily. They use different data and methodologies and answer different questions. Large or persistent gaps are worth investigating, but disagreement alone does not mean one model is wrong.
Can multi-touch attribution and MMM be unified in one platform?
Their data and outputs can be brought into a common reporting environment, but MTA and MMM remain distinct measurement methodologies. To compare them effectively, teams need consistent source data, channel definitions, time periods, and revenue definitions. A unified data and reporting layer can make that reconciliation easier without pretending the two models are the same.
Put MTA and MMM on the Same Clean Data
Connect spend, CRM, and offline data in one place, standardize it once, and report both attribution views side by side, with the same date ranges and revenue definitions.