
Most executive marketing dashboards get ignored. Here's how to build one your CMO actually opens — with the KPI limits, layout rules, and a step-by-step process backed by 2025-2026 research. Agencies with strong reporting keep clients nearly 3x longer. Here's why dashboards alone aren't enough in 2026, and how to fix client reporting with narrative and automation. A step-by-step guide to automating client marketing reports: what to automate, what to keep human, and the 6-step process agencies use to cut reporting time without losing client trust. 70% of AI referral traffic is misattributed as 'Direct' in GA4. Here's how to track ChatGPT, Claude, and Perplexity traffic correctly in 2026." TapClicks launches Pivot Table Widgets and in-widget Data Source switching, giving marketers faster analysis and dashboard updates without rebuilding. Learn how to structure marketing reports so ChatGPT, Perplexity, and Google AI Overviews can cite them — with 2026 citation data and a TapClicks-ready workflow. TapClicks launches AI Dashboard Creation and SmartSlides Slide-by-Slide Generation, helping marketing teams build dashboards and presentations faster. Wondering why Google Ads shows "CONTENT" instead of "Display" in your Network field? Here's what it means, why it's confusing, and the simple calculation that cleans it up in any dashboard. Top 8 SEO Reporting System Tools: 1. TapClicks 2. Looker Studio 3. AgencyAnalytics 4. SE Ranking 5. Semrush 6. Ahrefs 7. Whatagraph 8. DashThis.
How to Build a Marketing Dashboard Executives Will Actually Read
Why Your Marketing Dashboard Is Losing You Clients in 2026 (And How to Fix It)
How to Automate Client Marketing Reports in 2026 (Without Losing the Personal Touch)
How to Track AI Referral Traffic and Fix Your Marketing Attribution in 2026
TapClicks Introduces Powerful New Analytics Capabilities That Deliver Greater Flexibility and Control
How to Optimize Marketing Reports for AI Search in 2026
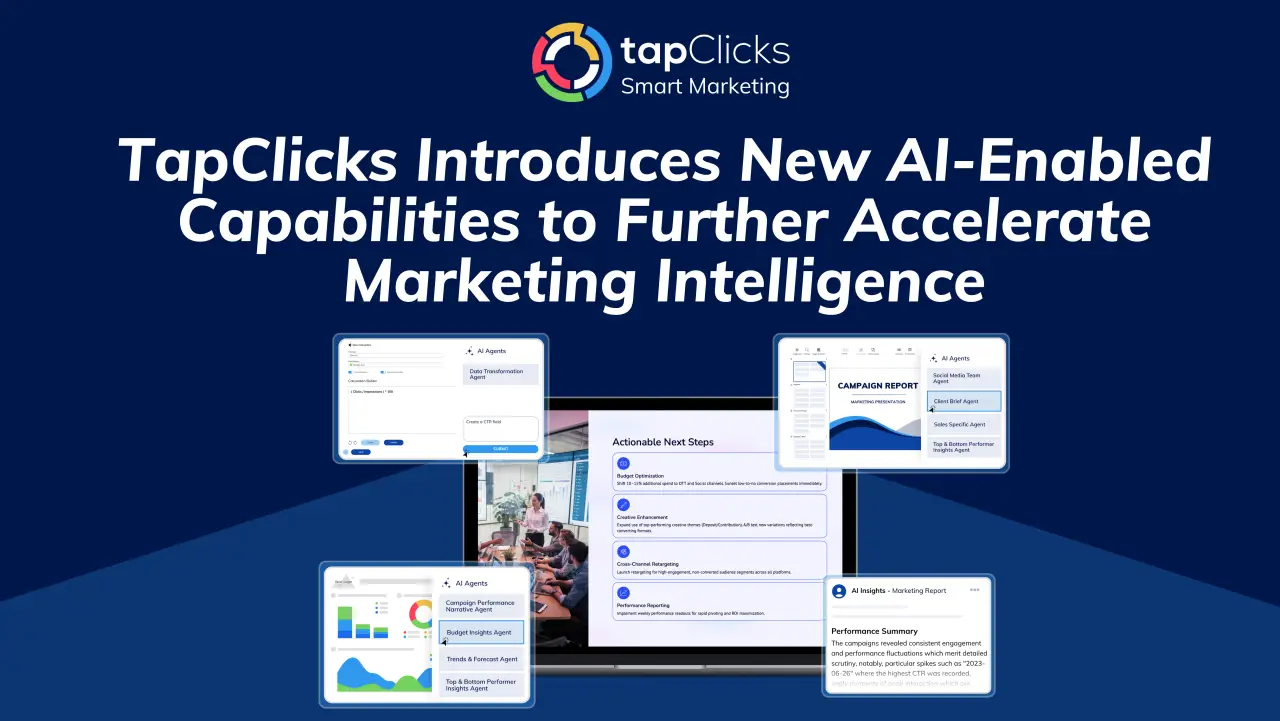
TapClicks Introduces New AI-Enabled Capabilities to Further Accelerate Marketing Intelligence
How to Simplify Google Ads Network Reporting with One Calculation
Top 8 Tools for Building an SEO Reporting System
Blog
The AI-Powered Marketing Intelligence Platform. Where data intelligence becomes competitive advantage.
TapClicks © 2026. All Rights Reserved.