
Top 9 NinjaCat Alternatives for Better Marketing Data Dashboards
Marketers depend on clear, reliable dashboards to track performance across platforms. NinjaCat helps with that need by centralizing reports, but the tool doesn’t suit everyone. Some users hit limits in customization, speed, or pricing. Others want more flexible setups or different integrations.
Several platforms now offer better solutions for those searching beyond NinjaCat. These options provide stronger control over marketing data, simpler ways to manage all your data sources, and an easier setup that works in just a few clicks.
This guide outlines nine of the best NinjaCat alternatives for 2025. Each one offers a unique way to track campaigns and simplify reporting tasks.
TapClicks gives your team the visibility and automation that NinjaCat can’t. Book a demo today!
What Is NinjaCat?
Image Source: ninjacat.io
NinjaCat works as a dashboard and marketing reporting platform for agencies, brands, and media companies. The platform connects data from advertising channels like Google Ads, social media, and analytics platforms to build client-facing reports.
For teams that manage multiple accounts or clients, NinjaCat saves time by pulling everything into one place.
The tool supports custom branding, scheduled automated reports, and unified views across all your data sources. Marketers often use it to present key metrics in a clean format without switching between platforms.
Even with these benefits, NinjaCat has limits. Some users struggle with the interface or want stronger support for advanced calculations.
Others run into issues when working with large datasets or need tools that support flexible integrations, automated data, or real-time processing. Due to these needs, many teams now look for ninjaCat alternatives that offer more control and better long-term value.
Why Marketers Look for NinjaCat Alternatives
Agencies and in-house teams often start with NinjaCat to save time on manual reporting and unify marketing data from multiple channels. Over time, though, the platform shows some limits.
Not every team works the same way, and reporting needs can change fast. When the software doesn’t keep up, switching becomes the only option.
Missing Flexibility for Complex Use Cases
Some users want more freedom to shape dashboards, control layouts, or build custom metrics that combine numbers from different platforms.
NinjaCat keeps things simple, but that simplicity creates friction for teams that need more power. Advanced calculations, customizable dashboards, and the ability to blend data from several sources aren’t easy to handle within NinjaCat’s system.
Marketing teams with unique goals also need the option to create automated reports based on custom data, specific date ranges, or rules for campaign pacing. Productivity drops when those reports require third-party tools or workarounds.
Cost and Scale Problems
Pricing becomes a problem for small agencies or small business users with tight budgets. NinjaCat’s pricing structure often targets large company use cases.
Features like unlimited users or high-volume data transfers can raise costs beyond what lean teams want to spend. On the other end, enterprise teams with high-volume data may run into issues around performance or limits in scale, especially with real-time updates or huge datasets.
Data Accuracy and Integration Issues
Another common issue involves data freshness. Some NinjaCat users report delays when trying to pull data from newer sources or sync campaign results in real time.
When a platform handles automated data poorly or lacks proper data integrations, the risk of errors increases. That leads to double-checking numbers across platforms, which defeats the purpose of using a reporting platform in the first place.
Workflow Gaps and Usability Concerns
Not every user needs fancy visuals, but many want cleaner navigation and better logic for how reports get built. Some teams find NinjaCat’s report builder hard to use. Menus feel outdated, settings get buried, and reports take longer than expected to finish.
New team members, especially those outside of technical roles, need fast onboarding and familiar workflows. Without that, adoption stalls. NinjaCat’s interface can present a steep learning curve for new users, which makes it harder to roll out across large or mixed-skill teams.
9 NinjaCat Alternatives for 2025
Some platforms make reporting easier, others give full control over how reports look and what data flows in. Not every team requires the same setup, so selecting the right tool depends on your team's size, goals, and approach to handling complex data.
The nine options below offer practical upgrades for NinjaCat users who want faster reports, more freedom, or smoother ways to track actionable insights.
1. TapClicks
TapClicks delivers the control, clarity, and scalability that modern marketing teams need. NinjaCat offers basic reporting tools, but it falls short when complexity grows or performance matters.
TapClicks steps in with a platform that handles huge datasets, integrates with hundreds of sources, and supports fast, informed decision-making.
Connect to Multiple Sources
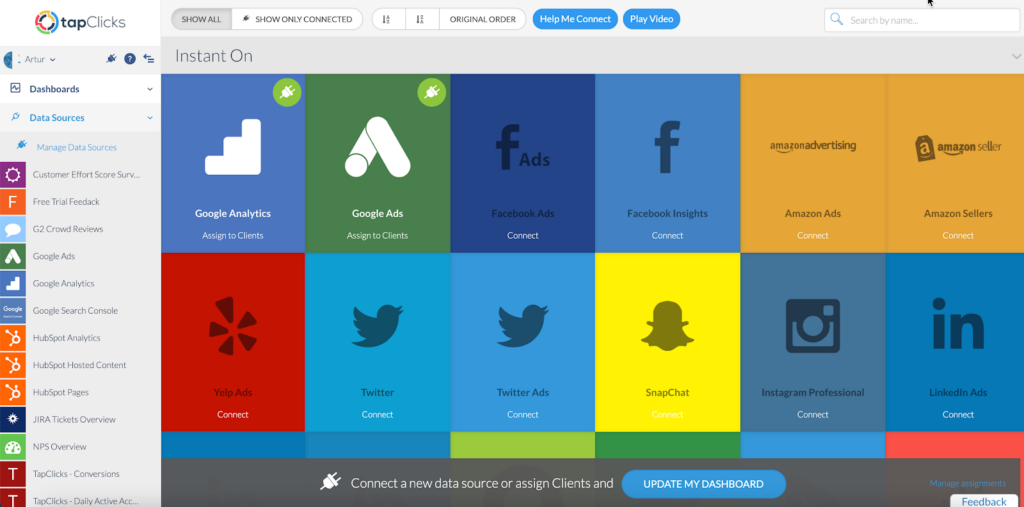
TapClicks connects to over 250 native sources right out of the box. The SmartConnector™ brings even more flexibility, pulling in campaign data from any platform.
Marketers can unify every touchpoint without the need for workarounds or outside help. NinjaCat only supports just over 100 native connectors, often requiring extra setup or customization to reach the same level of coverage.
Deployment That Doesn’t Slow You Down
Getting started with TapClicks takes less time and fewer resources. The platform is ready to go and easy to learn, even for teams handling dozens of clients.
The interface makes it simple to create dashboards, share updates, and scale as needs change. NinjaCat depends on customization, which adds time and delays reporting.
Scalability That Supports Real Growth
Teams managing multiple clients or business units need tools that keep up. TapClicks supports high-volume reporting, fast data processing, and custom metrics across accounts.
Larger teams depend on TapClicks to stay agile and maintain performance at every stage. NinjaCat runs into limits when data grows or when reporting structures become more complex.
Superior Workflow Automation
TapClicks brings everything into one platform. From campaign management to workflow automation and data exports, teams get the tools to move faster.
The platform supports calculated metrics, performance pacing, and budget alignment in one view. NinjaCat covers the basics, but TapClicks gives marketers a full set of tools to manage strategy, not just track it.
Unify your marketing data and take control of performance. Start your 14-day free trial!
2. AgencyAnalytics
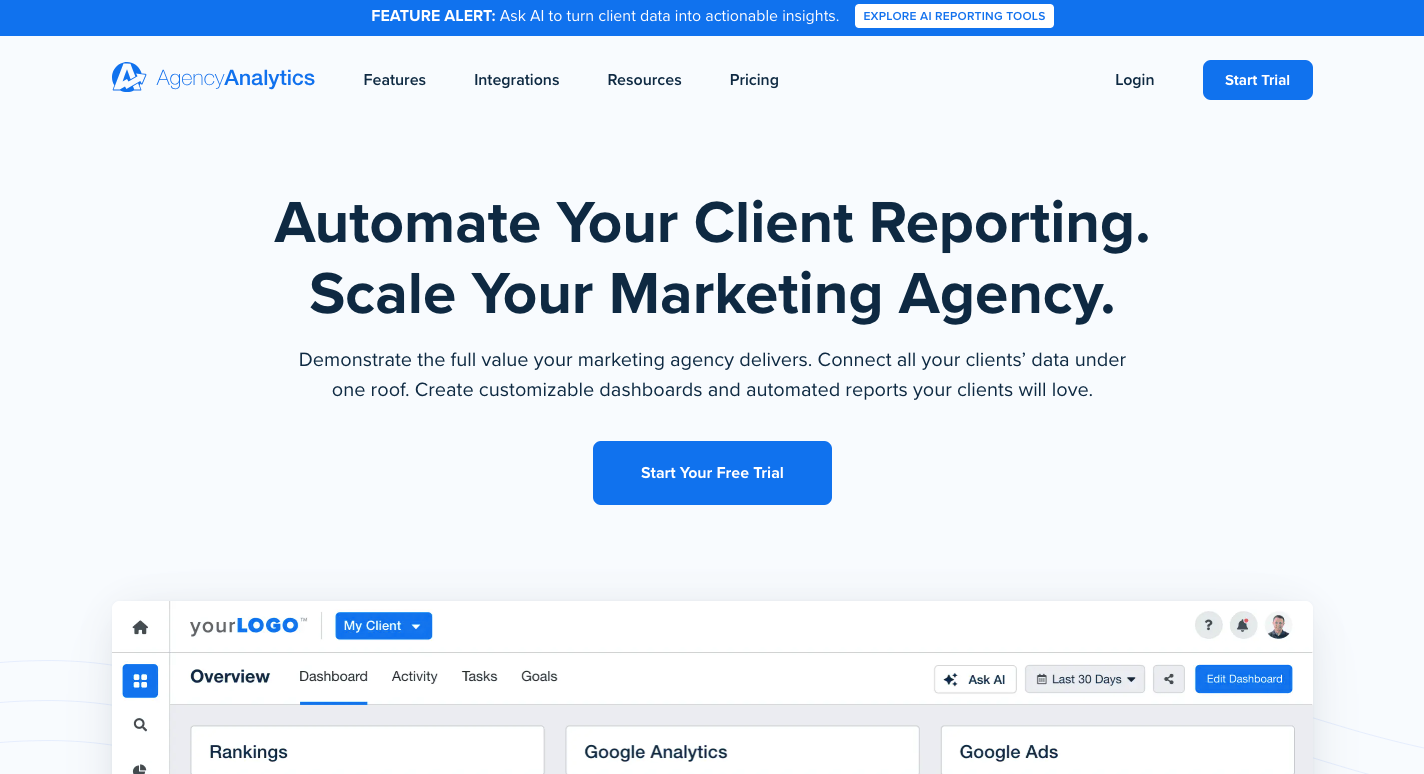
Image Source: agencyanalytics.com
AgencyAnalytics gives marketing teams a full set of features for client reporting. SEO support includes a built-in site auditor, rank tracker, backlink monitoring, and keyword tracking.
You can also build reports with drag-and-drop widgets, which makes it easy to adjust layouts or highlight specific SEO performance results without code.
Over 80 data integrations cover Google Analytics, Google Ads, Facebook, Bing, and eCommerce platforms. Each connection allows you to pull from different channels and build automated schedules for campaign performance updates. White-label settings let you match reports with your own brand.
The platform works best for agencies focused on clarity and speed. Every widget pulls from a single source, so it’s not possible to combine metrics from multiple places into a single view.
That setup works for many standard reports, but teams needing more control or support for complex data may run into limits.
Pros
-
Includes SEO tools like a site auditor, keyword tracker, and backlink monitor
-
Uses drag-and-drop widgets for building flexible, branded reports
Cons
-
Lacks support for cross-source reporting or deep metric blending
-
Limited flexibility for data analysts using BI tools or advanced filters
Pricing
AgencyAnalytics starts with the Freelancer plan at $79 per month for five clients. The Agency plan costs $239 per month and includes ten clients. For larger teams, the Agency Pro plan offers 15 client slots for $479 per month. All plans include white labeling, client dashboards, and automated report delivery.
3. DashThis
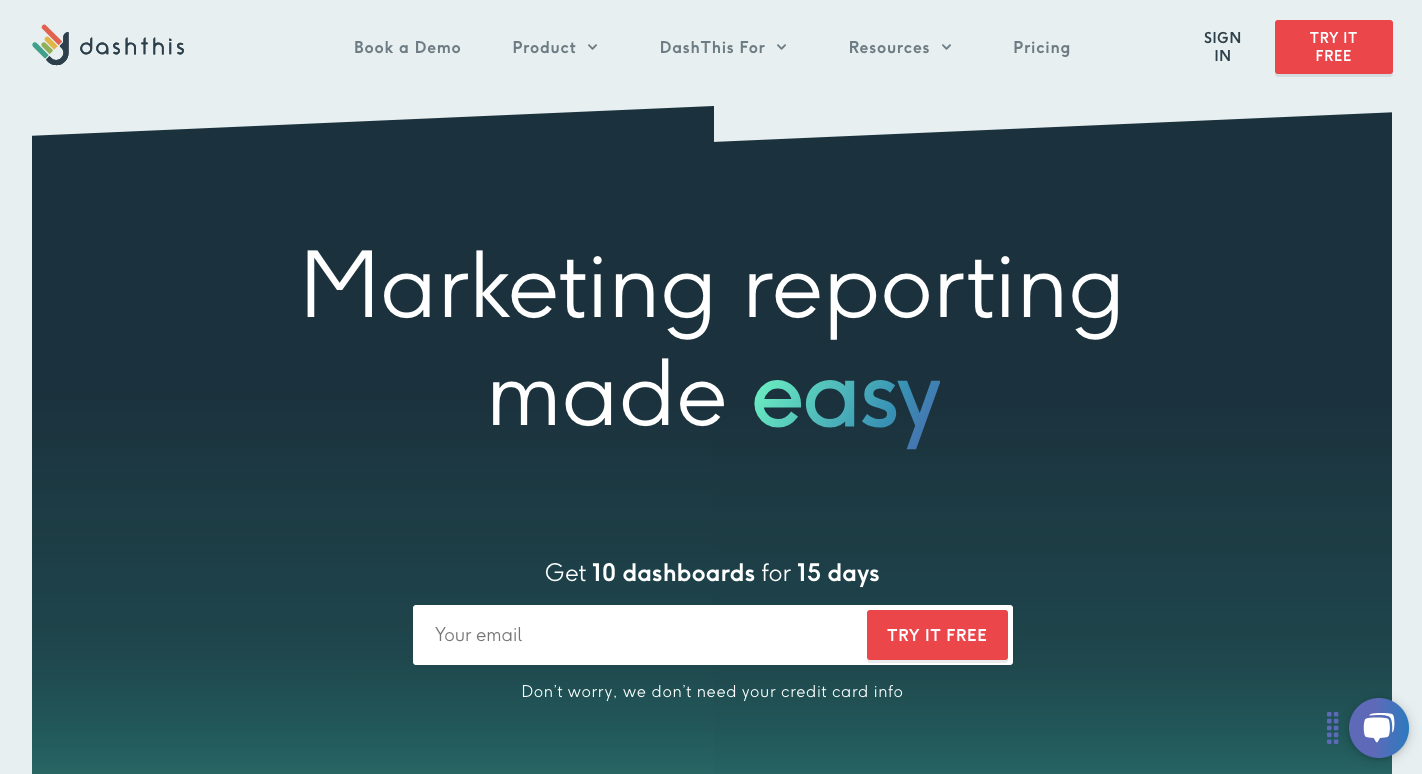
Image Source: dashthis.com
DashThis offers a simple reporting setup that works well for smaller teams focused on speed and ease.
The platform includes built-in templates and dashboard presets that help users create reports quickly without needing technical skills. Most users get started within minutes using the drag-and-drop interface, which feels intuitive for marketers who want clean visuals without building from scratch.
Some integrations include Google Analytics, Facebook Ads, LinkedIn Ads, and YouTube. Dashboards further support client reporting by allowing shareable URLs, scheduled emails, and PDF exports.
For users working in spreadsheets, DashThis supports Google Sheets and manual uploads through CSV file import.
Customization options, however, are limited. Dashboards follow a fixed structure, and visual controls remain basic. Marketing teams that want deep control over layout, advanced filtering, or branded visual themes may feel boxed in.
DashThis also doesn’t yet offer custom calculations, so all metrics rely on what’s pulled directly from the connected platforms.
Pros
-
Includes many ready-made dashboard layouts and reporting templates
-
Costs less than most ninjaCat alternatives with similar features
Cons
-
Supports only about 30 data integrations, which may not meet growth needs
-
Offers basic visuals and fixed layout controls with few styling options
Pricing
DashThis offers four monthly plans. The Individual plan costs $49 and supports three dashboards. The Professional plan is $159 and includes ten dashboards. The Business plan provides 25 dashboards for $309. The Standard plan supports up to 50 dashboards for $479.
4. Narrative BI
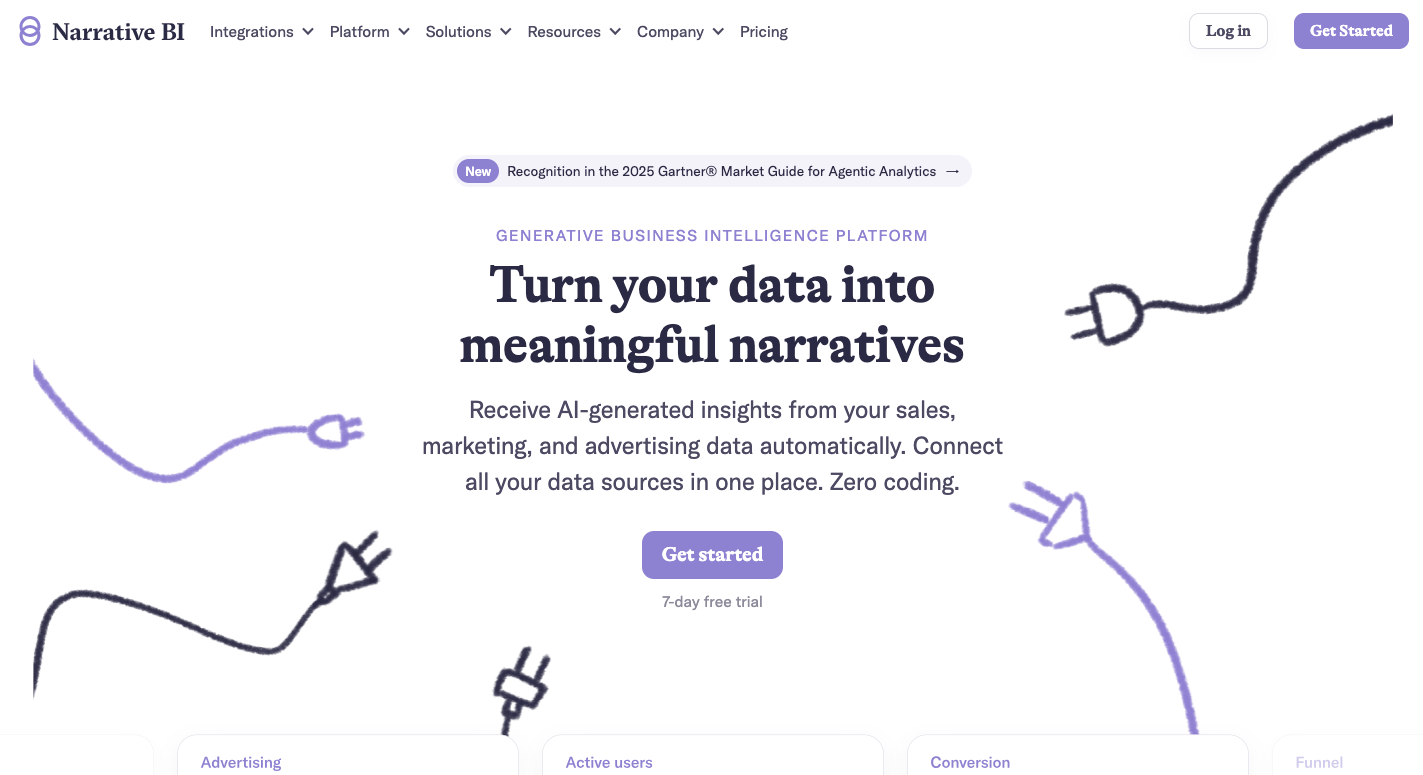
Image Source: narrative.bi
Narrative BI focuses on turning raw marketing results into plain-language summaries. The platform reads metrics from your sources and delivers explanations in real time, using logic-based automation.
Instead of classic dashboards, Narrative BI creates simple graphs and short-form insights to help non-technical users make quick decisions. That format works best for surface-level patterns, campaign shifts, or unexpected trends.
The tool processes data automatically, which removes the need to build charts manually. That feature benefits marketers who want fast updates without digging through spreadsheets or adjusting widgets.
Data analysts might find the platform less useful since it doesn’t support detailed visualizations or interactive layers. Only a few data sources are supported at the moment. Narrative BI works with common platforms like Google Ads, HubSpot, and Facebook Ads.
Broader needs, such as eCommerce data or platform-specific KPIs, may require another reporting tool or third-party connector. It’s not a full replacement for dashboard platforms, but it works as a lightweight add-on for marketing teams that need alerts and summaries.
Pros
-
Delivers text-based performance summaries with graphs and trends
-
Reduces manual effort by analyzing and summarizing data automatically
Cons
-
Connects with fewer platforms than most alternatives on this list
-
Lacks full dashboards, which limits value for data analysts
Pricing
Narrative BI follows a per-source pricing model. The Pro plan starts at $30 per source. The Growth plan raises that to $40 per source.
5. Supermetrics
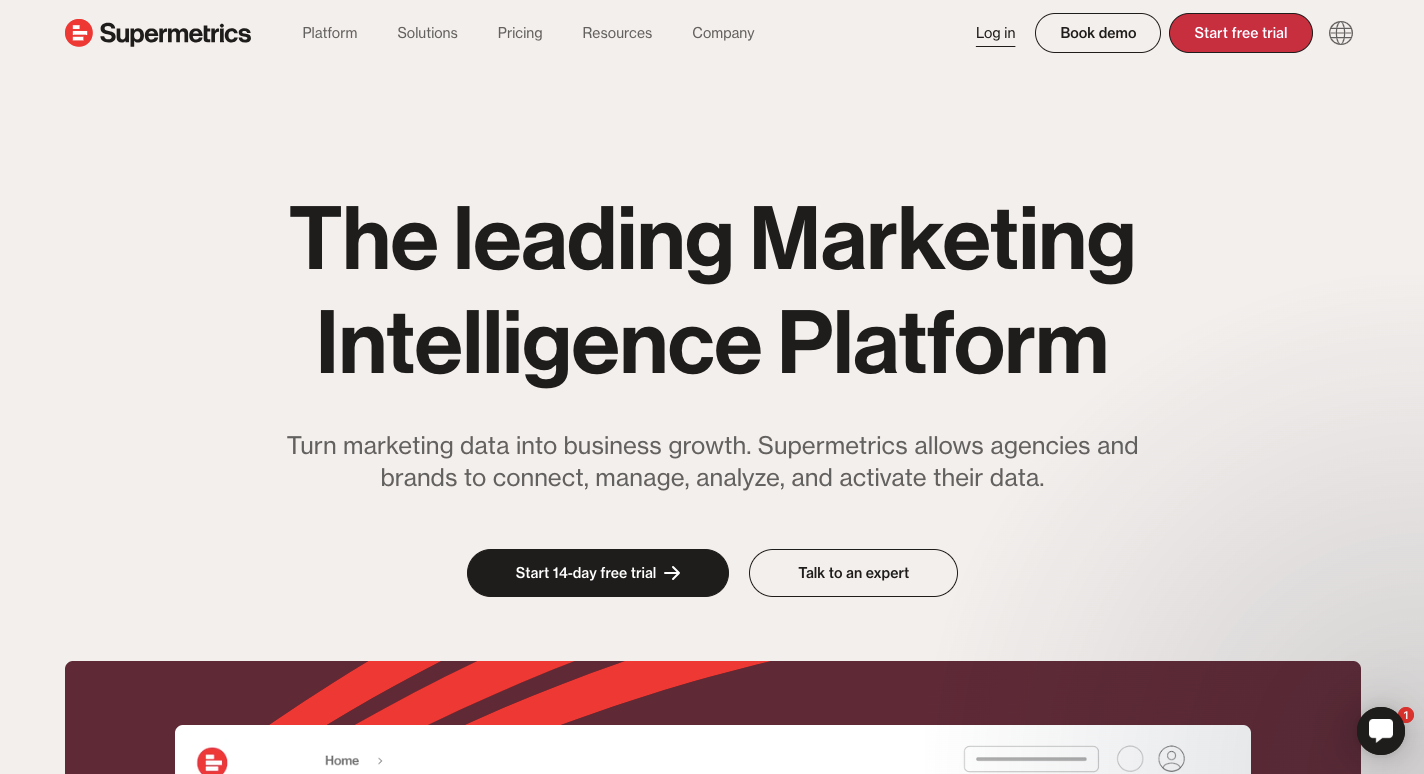
Image Source: supermetrics.com
Supermetrics moves marketing data from platforms into tools like Google Sheets, Excel, BigQuery, and BI tools.
The platform doesn’t include a dashboard builder, so you should pair it with a separate analytics platform or spreadsheet to display metrics. It works best for users who already manage reporting in external tools and want help gathering everything in one place.
Marketing teams rely on Supermetrics for fast data transfers and strong compatibility with complex stacks. Built-in connectors support hundreds of sources.
Once connected, Supermetrics handles data mapping, data cleaning, and automated normalization, which helps maintain consistent naming conventions and formats. These features reduce manual work for teams managing reports across platforms.
Supermetrics does not include dashboards or visuals, which makes it less practical for client-facing needs or live views. Users looking for customizable dashboards or ready-to-send reports need to build them using a separate reporting tool.
Pros
-
Sends marketing data directly into BI tools, spreadsheets, and warehouses
-
Includes no-code options for high-volume data transfers and maintenance
Cons
-
No reporting interface, which limits use for teams that need direct dashboards
-
Known issues with duplicated values and accuracy when managing blended fields
Pricing
Supermetrics uses a custom pricing model based on the number of sources and the type of destination.
6. Funnel.io
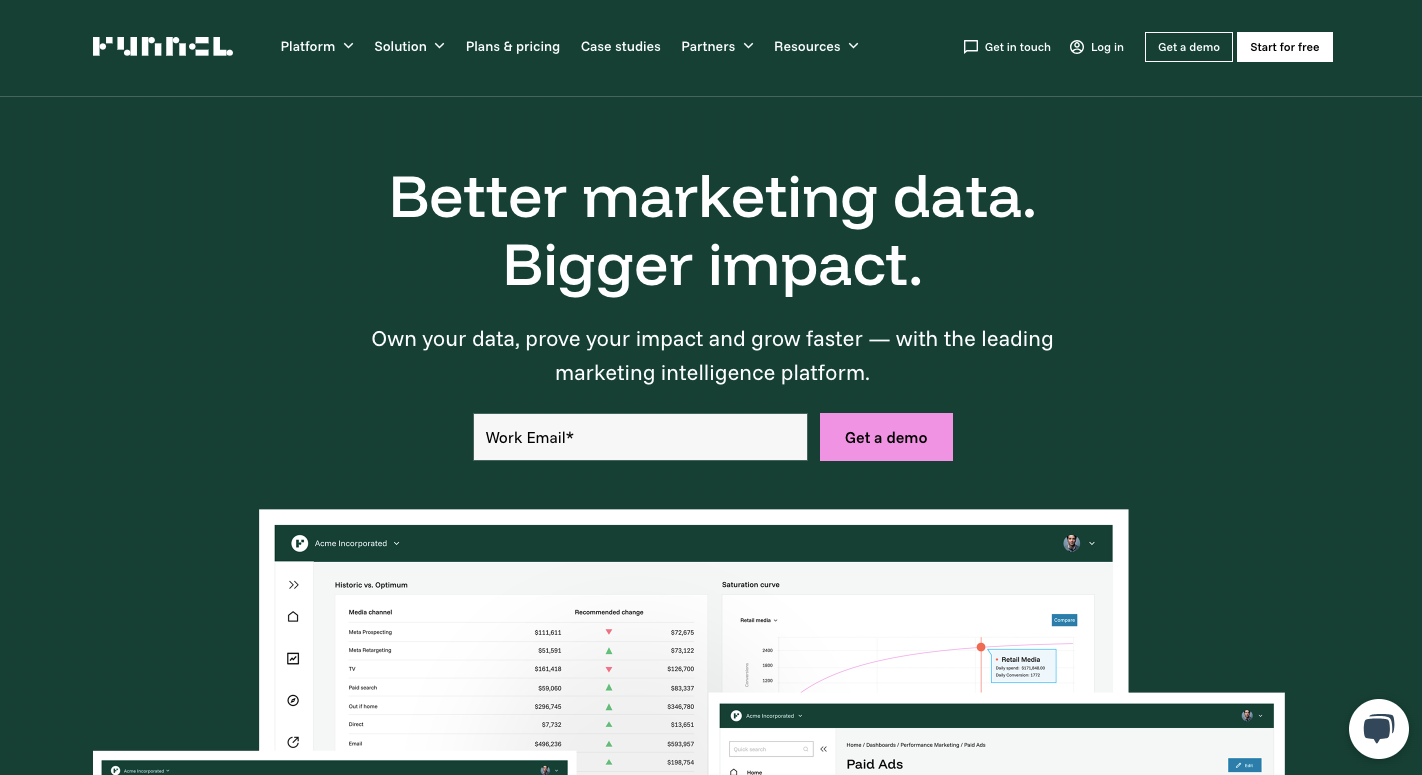
Image Source: funnel.io
Funnel.io collects marketing data from hundreds of sources and prepares it for analysis. The platform doesn’t include a full reporting interface, so marketing teams usually connect it with visualization tools or business intelligence tools to display metrics.
Funnel works well for users who need to clean, sort, and send data to other platforms based on the structure of each team or client. The software organizes incoming information with a low-code interface. It supports custom rules for grouping, labeling, and categorizing values across campaigns.
You can export data to spreadsheets, BI tools, or data warehouses like BigQuery, Snowflake, and Redshift. Funnel.io supports numerous destinations in the same workspace, so you can send metrics to one or more tools without reprocessing the data.
Teams that rely on Funnel often want to remove manual prep work before reporting. The tool simplifies the path from data source to output, so that it’s easier to manage performance reporting across brands, accounts, or regions.
Pros
-
Supports data exports to multiple destinations, including spreadsheets, warehouses, and analytics tools
-
Organizes and routes marketing data into clean formats without code
Cons
-
Lacks a built-in reporting UI
-
No built-in alerts or AI features to flag sudden changes in performance
Pricing
Funnel.io includes a free plan with limited features. Starter, Business, and Enterprise pricing tiers exist, but costs are not publicly listed.
7. Whatagraph
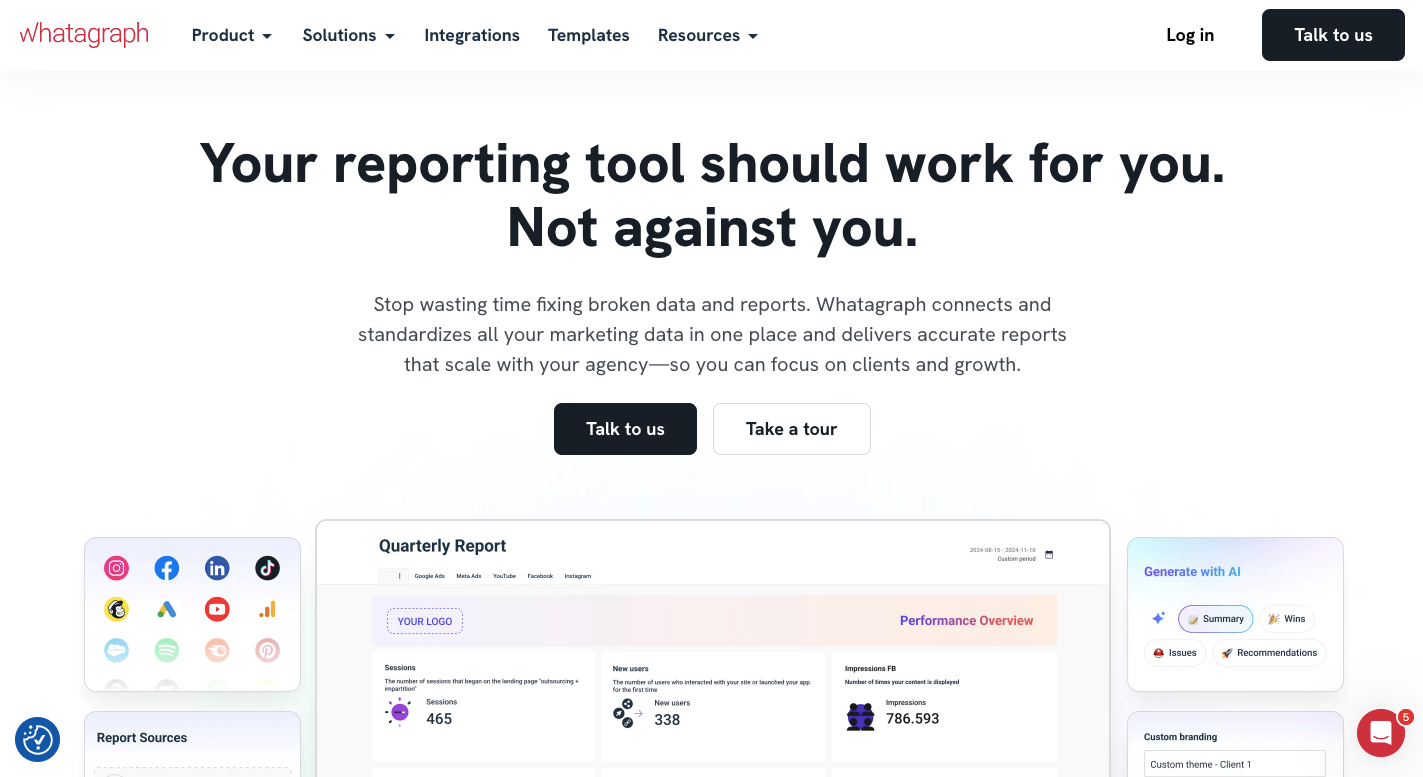
Image Source: whatagraph.com
Whatagraph offers quick and visual performance reporting for marketing agencies that want to turn numbers into sleek, client-friendly dashboards. Reports include graphs, charts, and key metrics, with full control over layout using drag-and-drop elements.
The tool supports scheduled delivery, allowing users to automate weekly or monthly updates across multiple accounts. Users can create custom metrics based on available data fields, which helps match report structures to specific client needs.
Whatagraph works as a marketing reporting tool with a strong visual focus, supporting campaign overviews across email, PPC, SEO, and social platforms. Integrations cover most mainstream sources, and connections are made through built-in APIs.
Although it looks polished, the platform doesn’t offer real-time alerts or advanced features for analytics. That gap becomes one of the biggest pain points for teams that need metric-based triggers or in-depth performance breakdowns.
In addition, Whatagraph keeps limited historical data. Most information is pulled live from each source, which makes year-over-year tracking harder without external storage like BigQuery.
Pros
-
Delivers clean, fast visuals for quick reads on campaign performance
-
Helps agencies automate reporting without building dashboards from scratch
Cons
-
No alerts or AI features to track metric changes in real time
-
Limits on historical data storage may impact long-term trend analysis
Pricing
Whatagraph does not list public pricing.
8. Improvado
Image Source: improvado.io
Improvado supports enterprise-level marketing analytics by helping teams centralize and control large volumes of data collection.
The platform connects with hundreds of ad tools, CRMs, and analytics systems, giving users full control over pipelines, dimensions, and data rules. Marketing teams can direct data into visualization platforms like Tableau, Looker, and Power BI, then use those systems to build dashboards and charts.
Large companies benefit most from Improvado’s structure. The tool organizes multi-channel campaigns, scales across accounts, and processes massive datasets for clean reporting. Multi-brand strategies can track campaign performance without building individual pipelines from scratch.
Many features support automation, including data normalization, field grouping, and advanced transformations. These allow marketing teams to create unified reports using consistent logic.
Teams that need to audit performance or match metrics across regions find these functions reliable. One key advantage comes from its ability to replace multiple tools in the stack. The platform’s most useful key features include custom metric creation and direct output into top BI tools.
Pros
-
Supports custom pipelines for cross-channel reporting and advanced campaign performance tracking
-
Connects directly to Power BI, Looker, and Tableau for flexible dashboards
Cons
-
Setup can overwhelm small agencies or teams with basic reporting needs
-
No built-in dashboard interface for teams that want all reporting in one place
Pricing
Improvado does not list pricing publicly.
9. Tableau
Image Source: tableau.com
Tableau provides you with full control over how you visualize and explore data. Reports use interactive dashboards that support filters, drilldowns, and custom views for different audiences. Built-in tools also help marketers display key metrics clearly.
The platform connects with spreadsheets, cloud services, SQL databases, APIs, and custom files. Each connection forms part of a flexible data package that users can adapt for different business units or clients.
Tableau Prep helps organize raw inputs and clean up values before they reach the dashboard, reducing the risk of confusion or misalignment.
Users can track conversion rates, engagement, spend, and ROI across big datasets. The system works best for teams that want freedom to build views and pull in varied data sources.
Pros
-
Offers interactive dashboards that support filtering, comparison, and visual exploration
-
Works with many data sources and allows deep customization of visuals
Cons
-
Some features take time to learn and require practice
-
Performance may slow when working with huge datasets across several filters
Pricing
Tableau pricing is based on user roles. The Enterprise Viewer plan costs $35 per user per month. The Enterprise Explorer plan is $70 per user. The most advanced plan, Enterprise Creator, is $115 per user monthly.
From NinjaCat to Next-Level Insights With TapClicks
TapClicks gives marketers a smarter way to manage data, reporting, and performance. Unlike NinjaCat, which stops at basic dashboards, TapClicks connects to over 250 sources and brings all your marketing data into one platform.
Teams create custom views, track real results, and automate reporting without manual work. Dashboards adapt to campaign goals, budget pacing, and metric changes. TapClicks removes limits, helping marketers move faster and act on clear, unified insights.
For growing agencies and in-house teams, TapClicks turns scattered data into strategy.
Visualize marketing performance across every channel in one place. Book a demo with TapClicks!
FAQs About NinjaCat Alternatives
Who are the competitors of NinjaCat?
Competitors of NinjaCat include TapClicks, Whatagraph, DashThis, AgencyAnalytics, Funnel.io, Supermetrics, Narrative BI, Improvado, and Tableau. These platforms serve marketing teams that need broader integrations, deeper analytics, or faster workflows than NinjaCat offers.
What should I look for when comparing NinjaCat alternatives for marketing reporting?
When comparing NinjaCat alternatives for marketing reporting, look for platforms that support custom data, dynamic reporting, goal tracking, and workflow automation. Some tools only offer static dashboards, which can limit flexibility. The best alternatives support report customization, calculated metrics, budget pacing, and team-based access controls. Ease of setup, support quality, scalability, and pricing transparency also play a big role in long-term success.
Can NinjaCat alternatives integrate with multiple data sources?
Most NinjaCat alternatives do integrate with multiple data sources, often through native connectors or custom ETL tools. These platforms pull in marketing data from Facebook, HubSpot, and other systems. Top choices process that data automatically and let users filter, group, and export it without manual intervention. That level of automation helps teams move faster and reduces reporting errors.
Do NinjaCat alternatives offer features like a custom domain or white-label reports?
Yes, many NinjaCat alternatives do support white-label features. TapClicks, for example, offers full branding control, including the ability to use a custom domain. Other platforms also allow users to replace logos, modify headers, and match report visuals to client branding, often going beyond what NinjaCat or similar tools provide.