
What Is Client Reporting? Learn the Basics in Minutes
If you’re responsible for managing client accounts, you already know how important it is to keep clients informed. But sending emails or updates without structure often leads to confusion.
That’s where client reports come in. These reports help you organize data, explain results, and show clients what they’re getting from your work.
A clear client reporting process doesn’t just highlight numbers. It shows progress toward your client’s goals and builds stronger client relationships. You don’t need to waste time spending hours gathering data either.
In this article, you’ll learn what client reporting means, how it helps your business, and how to create it using automated reporting tools.
What is Client Reporting?
Client reporting is the process of sharing results with your clients in a structured and legible way. It takes the work you’ve done, such as campaign performance, data, or outcomes, and organizes it into a format your clients can easily review.
Most reports include key data, updates, and summaries of progress. These can be sent weekly, monthly, or at specific milestones. You might use a dashboard, a document, or a slide deck.
The goal stays the same: help your clients see what you’ve achieved and how it connects to what they hired you to do.
Every report becomes part of how you communicate. Rather than leaving clients in the dark, you’re keeping them informed. The process also helps you stay accountable and focused on goals that matter to you.
Types of Client Reports
Not every client needs the same kind of report. Some want a big-picture view, while others ask for campaign-specific updates. When you match the report to what your client actually cares about, you save time and build stronger communication.
The main types of client reports you can send include:
-
Comprehensive report - A full overview covering all services or campaigns. Excellent for larger accounts managing several marketing efforts at once.
-
Channel-specific reports - Focused reports that break down performance by marketing channels like email, paid ads, or SEO. These keep things simple when your client wants to track one platform at a time.
-
Campaign-focused reports - These cover short-term efforts such as content marketing campaigns or seasonal promotions. Advantageous when your client wants to see fast results tied to a clear objective.
-
KPI dashboards - Visual summaries that highlight the most important data. Use this when your client prefers a quick look at the numbers without digging through complex data.
Sending the right type of report improves your agency client relationship and supports long-term client retention, especially if you’re working within a marketing agency environment.
Recommended Reading: Client Report: Example Templates and Automation Tips
Internal Reporting vs Client Reporting Process
You might have already built reports for your team. These help track performance, review results, and guide next steps.
That’s internal reporting. It’s for people who already understand the tools, the data, and the goals behind every number. You can include raw tables, unfinished notes, or background metrics that only your team needs.
Client reporting works differently. You’re no longer sharing information with experts. You’re helping your client understand what the data means. That changes how you write, what you include, and how much context you provide.
Internal reports often rely on manual reporting. You pull numbers directly from spreadsheets and talk through the results during a meeting. That works fine for internal use.
When you create client reports, though, you need a clear layout, short explanations, and a focus on outcomes. Most clients won’t have time to read long files filled with detailed information about every data point.
Many clients expect clean, focused updates. A solid client reporting process helps you organize that data into a format that’s easier to share and easier for clients to understand.
How Client Reporting Helps Your Business?
When you share results clearly, clients stay involved, focused, and confident in your service. Every update becomes more than a summary. It becomes proof of progress.
Below are the key ways client reporting supports your business:
-
Improves client communication - Clear reports reduce confusion and help you explain results without repeating the same points in every meeting.
-
Turns marketing data into strategic insights - Instead of pulling numbers directly from tools like Google Analytics, you organize the data in a way clients can apply.
-
Supports informed decisions - Focused reports provide clients the confidence to approve changes, pause weak campaigns, or invest more where it counts.
-
Enhances client management - You keep timelines, updates, and expectations clear, which leads to smoother relationships with existing clients.
-
Allows for custom reports - Each client can receive updates based on service type, goals, or preferred layout.
-
Measures marketing performance clearly - You’re not just saying something worked. You’re proving it with tracked results.
-
Improves your data analysis process - Clean reports force you to focus on what’s changing and why.
What Should a Good Client Report Include?
Your report doesn’t need to be long, but it does need the right parts. Every section should give your client clarity, show real progress, and support decisions.
The following are what you need to include:
Key Performance Indicators (KPIs)
Key performance indicators connect numbers to the results your client expects, and keep everyone focused on goals.
When you select KPIs, use your client’s goals as a guide. If your client has an e-commerce business, you could track revenue and order value. But for a local contractor, focus on leads and phone calls.
Pull clean data from tools like Google Search Console if you’re working on visibility or SEO projects. Every metric must tie to what matters.
Each industry uses different benchmarks. For healthcare, you might track appointment requests. For education, form completions. Take time to select indicators that actually mean something for the client’s industry and campaign type.
KPIs bring structure to your report and give clients a reliable way to measure progress over time. Place them at the top of the report and revisit them in every meeting. That consistency builds trust.
Data Visualizations
Your clients don’t want to read through spreadsheets. You can help them see results faster by turning data into charts or graphs.

Start with one or two visuals that reflect performance. Use a line chart to show traffic growth or a pie chart to show which campaigns drive the most leads. Place them near essential takeaways so the visual and the message support each other.
Studies show that 65% of individuals learn best through visual means. You can use this to your benefit. Make visuals a consistent part of your report layout. Clients will learn where to look and how to read them without extra help.
Send regular reports that include these same types of visuals, so clients can recognize trends over time. You save everyone time and make your work easier to explain.
Clear visualizations create a stronger understanding. That understanding improves your calls, your reports, and the relationship you’re building with every update.
Comparisons (Past vs Present)
You can’t show progress unless you compare current results to past performance. A report filled with stats doesn’t say much if your client doesn’t know what’s changed. Comparing past versus present data gives your report meaning and makes it easier for your client to track growth.
Start with clean numbers. Use a 30-day, 60-day, or 90-day range depending on the campaign. Highlight any wins and explain drops in performance clearly.
Give context for traffic spikes, revenue shifts, or lead volume changes. When you compare correctly, clients stay focused on results that actually matter.
Select relevant data that fits the timeframe and campaign. Avoid crowding the report with unrelated numbers. Just highlight the changes that match the goal.
Above your comparison section, add a short executive summary that calls out wins and flags any performance issues. That makes the data easier to scan.
Explanations or Key Insights
Your report needs to do more than show data. You should explain what the numbers mean. Your client may not have time to analyze everything line by line, but you can give them clarity with well-placed marketing insights.
Start by looking at what changed. If ad spend increased but conversions dropped, say so. If organic search traffic improved, point to the page that drove that growth. Make each insight short, specific, and easy to follow. Include one or two big-picture takeaways based on the numbers.
Your analysis strengthens agency client communication and saves time on future calls. Clients who receive context in writing ask fewer questions during meetings. That allows more time to focus on strategy.
For busy marketing managers, these insights often matter more than the raw data.
Recommendations
Clients expect action, not just updates. That’s why recommendations are an important part of every report. You need to use your expertise to turn data into direction. Show your client where to focus next and what to change based on performance.
Begin with one or two things your client should do, and support each point with recent data. Tie the recommendation to results already covered in the report.
Use the recommendation section to respond to client feedback from previous calls or emails. If a client asked about a drop in traffic or mentioned budget concerns, answer it here. That saves time and keeps communication smooth.
Takeaways for Clients
Clients need a quick summary of what happened and what comes next. A takeaway section gives them that. When you end your report with a list of clear points, you make it easier for clients to understand the results and take action.
Use three to five bullet points. Cover wins, losses, and upcoming changes. Focus on information that directly affects the campaign. Keep it short, direct, and tied to your earlier sections.
The clearer the summary, the fewer questions you’ll get after delivery.
Key Metrics to Include in Your Client Report Template
Every client report needs to include the right numbers. You can’t include everything, and you shouldn’t. The goal is to show results that match what your client actually cares about.
That means choosing key metrics based on the service you provide and the outcomes your client expects, such as:
Marketing: Website Traffic, CTR, Conversions, ROAS
You need to show your clients how your campaigns are performing. Website traffic tells you how many people are visiting. CTR reveals how many of them are clicking. Conversions show what actions they take once they land. ROAS measures what your client earns from ad spend.
Don’t stop at traffic spikes. Clients care about outcomes. Highlight which sources brought the most traffic, which ads got the highest clicks, and which pages converted best. Pull clean data from Google Analytics and use basic visuals to make patterns clear.
Include each of these in your marketing report every month. You could use automated data collection if you want to save time and reduce mistakes.
When you track these marketing metrics, you give your client proof that their campaigns are doing more than generating impressions.
Sales: Leads, Pipeline Status, Close Rates
You’re expected to show how marketing drives revenue. Leads, pipeline status, and close rates are how you do that. Leads prove you’re bringing in potential buyers. Pipeline status shows which ones are moving forward. Close rate measures how many turn into customers.
When you report these numbers, you help clients connect your work to their actual sales results. That’s especially important if you’re working with a new client who hasn’t seen your full impact yet.
Focus on what changed. Did more leads enter the pipeline this month? Did one channel produce better quality prospects? These shifts matter more than raw totals.
Your detailed reports should include a short explanation for each number. Help your client see where the wins came from and where improvements might be needed. These sales metrics support deeper conversations and better decisions, even when the campaign is still finding its rhythm.
Finance: Spend, Profit Margins, Projections
You’re helping your client invest in growth, so it makes sense to show how the money’s working. Total spend tells them what’s going out. Profit margins show what’s coming in. Projections help guide what happens next.
Break down ad spend by platform if you manage multi-channel campaigns. Highlight which efforts are staying on budget and which are overdelivering. Clients don’t want to guess where the money went, so make it easy to follow.
Show how much profit each campaign helped generate. If your client is tracking sales value, use that to connect spend to return. Finish with simple projections. Estimate future results based on what’s happened so far. That helps your client plan, even if the numbers shift slightly later.
Clients trust partners who manage the budget with care.
Support: Ticket Resolution, CSAT, NPS
You can learn a lot about customer experience by looking at support metrics. Fast ticket resolution means issues get handled quickly. CSAT reflects how satisfied customers feel. NPS shows how likely they are to recommend your client’s business.
Include these metrics when your campaigns affect onboarding, product launches, or messaging. If a page update caused confusion or a form isn’t working, your client may not know unless the support team shares that feedback. You can connect those dots for them.
You might also notice changes in support volume linked to social media engagement. A campaign that drives more visibility could create more questions or more praise.
Support performance ties back to marketing. When you align your work with the experience customers are having, you help your client improve more than just conversions. You’re showing them how to keep people happy after the click.
Adding these numbers helps you deliver a complete picture. You’re not just showing reach and revenue. You’re proving that your work supports better service, too.
How to Create Effective Client Reporting
The steps below walk you through how to build reports that actually work.
1. Know Your Audience
Before building your report, take a step back. Ask yourself who will read it. You need to adjust what you show and how you explain it based on who’s reading.
Talk to your client about what matters most. Do they want campaign summaries or full metric breakdowns? Do they prefer visual dashboards or written highlights? When you understand how your client measures success, you can report in a way that makes sense to them.
Getting this part right saves you from long back-and-forth emails and follow-up calls. A report that speaks your client’s language makes every meeting easier.
If your audience changes, adjust your format to match. That’s how you stay helpful and relevant.
2. Choose the Right Data Sources
You don’t need to pull data from everywhere. You need to pull it from the places that actually support the results you’re expected to deliver. Focus on quality, not quantity.
Start by mapping your reporting to performance goals. Pull from multiple data sources only when each one adds value. For example, use Google Ads for campaign results, your CRM for lead status, and Google Analytics for traffic insights.
Create a checklist of approved sources for each account. That makes reporting faster and easier every time. When your data lines up with your client’s goals, your report stays sharp and purposeful.
3. Select Your Client Reporting Tool
Building reports manually wastes time and leads to mistakes. You need a tool that pulls data from the platforms you already use and helps you stay consistent.
Look for reporting software that supports easy integrations and clean layouts. If you manage multiple brands, using white-label client reports keeps everything professional and on-brand.
Set up automated reports to avoid rebuilding the same charts each week. When you automate client reporting, you free up time to focus on results, not formatting.
TapClicks checks all these boxes, as it:
Pull Data from Every Data Source
Many reporting tools only connect with standard platforms like Google Ads, Facebook, or LinkedIn. If you’re running campaigns on radio, TV, or demand-side platforms, those tools force you to fill the gaps manually or rely on separate software.
TapClicks eliminates that problem. You can pull data from over 250 direct integrations, including ad platforms, ecommerce sites, CRMs like Salesforce, and cloud databases like Microsoft Azure and Snowflake. Platforms like Genius Monkey, Verve, and Tiger Pistol are supported too.
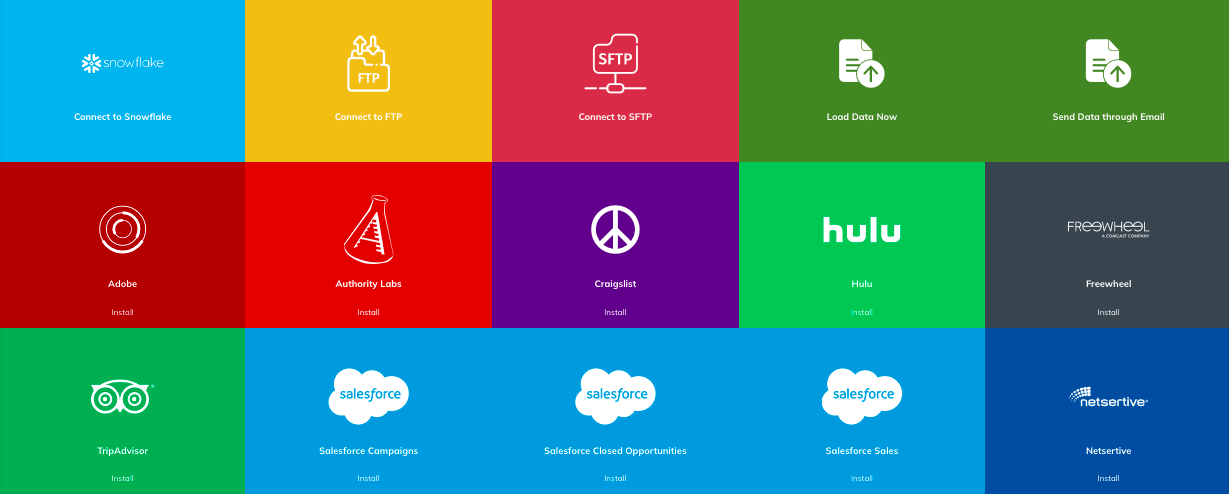
If the connection doesn’t exist yet, you can build it yourself with Smart Connector. That tool has already supported over 6,000 unique sources, including internal databases and offline files.
You also get historical data, up to 12 months in most cases. Once you set it up, data flows in every day or whenever you refresh it. You don’t need to worry about broken connections. We maintain the APIs so you stay focused on reporting.
Store and Access Your Data Anytime
Most platforms show a live snapshot of your campaigns. That sounds helpful until you need last year’s numbers and realize they’re gone. Platforms like Amazon Ads only store 60 days of data. If you don’t export and store that data yourself, it’s lost.
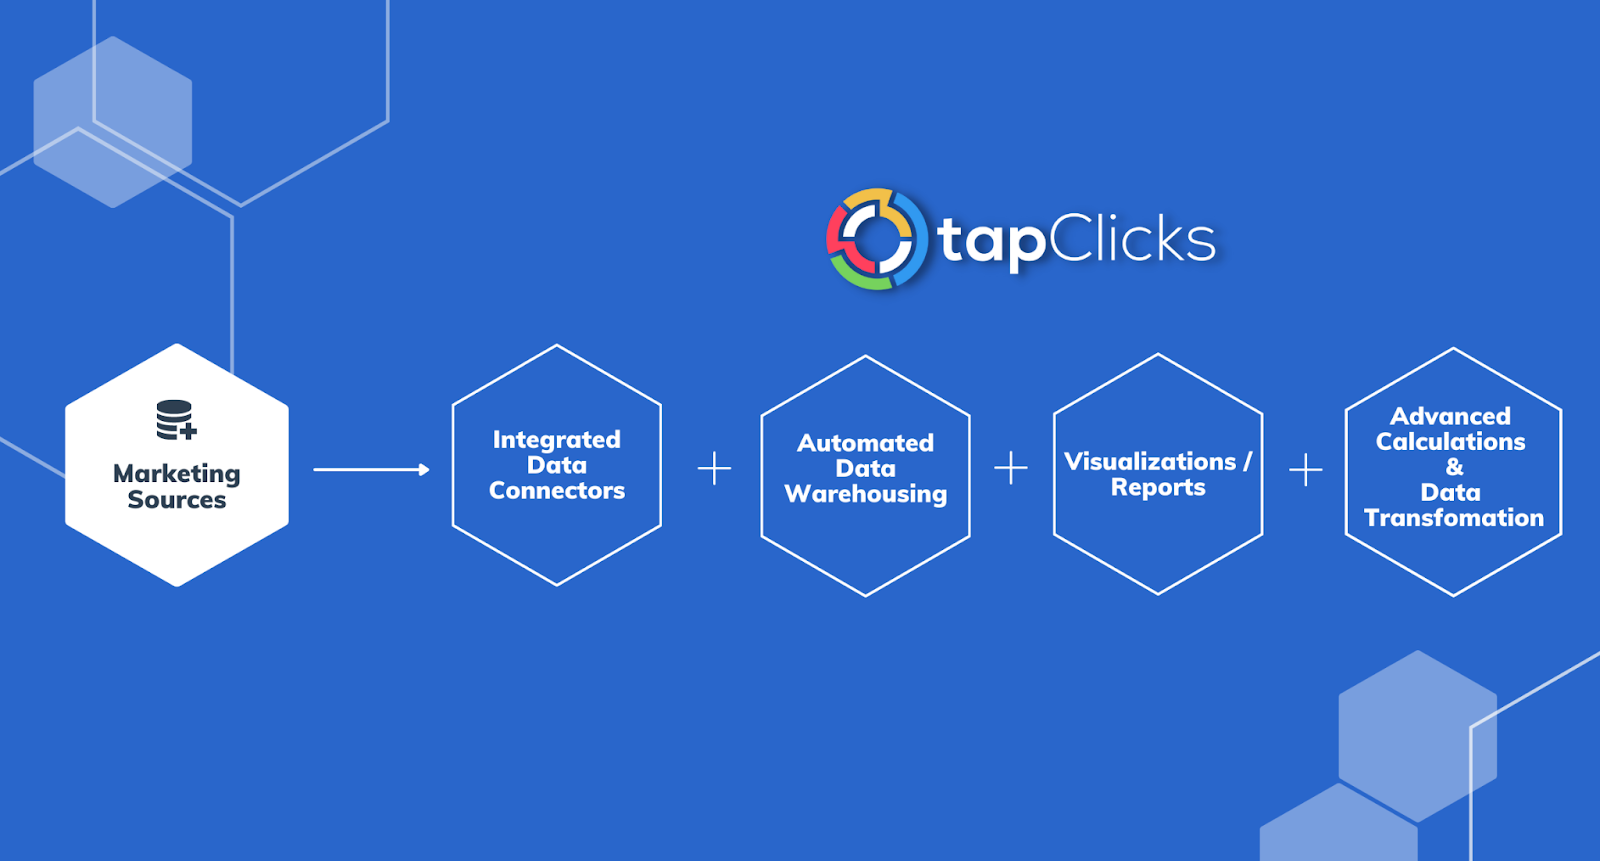
TapClicks stores all of your data in a secure, managed warehouse that doesn’t require any coding to access. You can log in and find what you need without sending requests to the data team.
Everything stays in one place, from dashboards to calculations to custom visualizations. You don’t need a separate database or BI tool to analyze performance or track growth.
Your data stays available as long as you need it. Reports, dashboards, and insights stay linked to real performance metrics from past and current campaigns. You’ll never lose data because someone forgot to export it in time.
Automate Complex Calculations Across Campaigns and Clients
Manual calculations eat into your schedule. You know what that’s like if you’ve ever added up click-through rates or cost per acquisition across multiple platforms in a spreadsheet.
Some clients ask for channel-level breakdowns. Others want blended results across campaigns. Every new report means more copy-paste work and math.
TapClicks gives you a faster option. You can define formulas once and apply them across any campaign, client, dashboard, or report.
Want to combine engagement metrics from Facebook, YouTube, and Twitter (X) into one view? You can set up a total social engagement metric in seconds. That formula pulls in updated data automatically and applies it wherever you want.
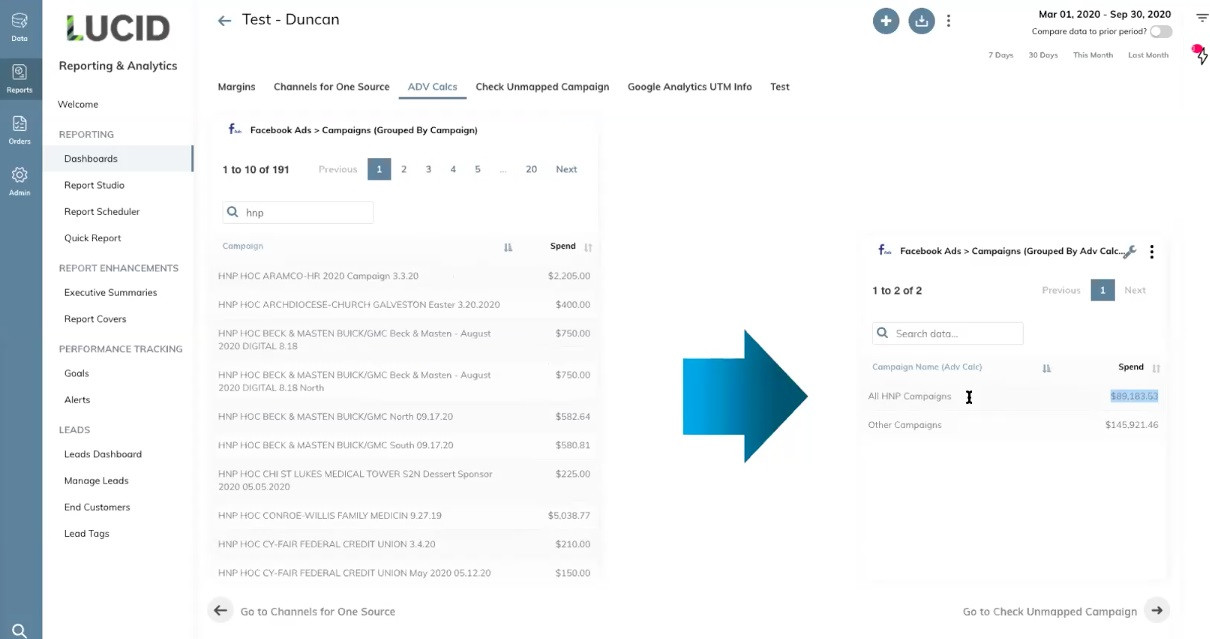
TapClicks also lets you group campaigns by brand, location, or any custom label. You could build a segment like “HNP Campaigns,” tag every campaign that fits, and roll them into a single line in your report. You can zoom in or out by product, campaign type, or region without redoing the work.
All of this runs in the background. You define it once and drop it into reports again and again, with no extra effort.
Customize Dashboards for Any Client
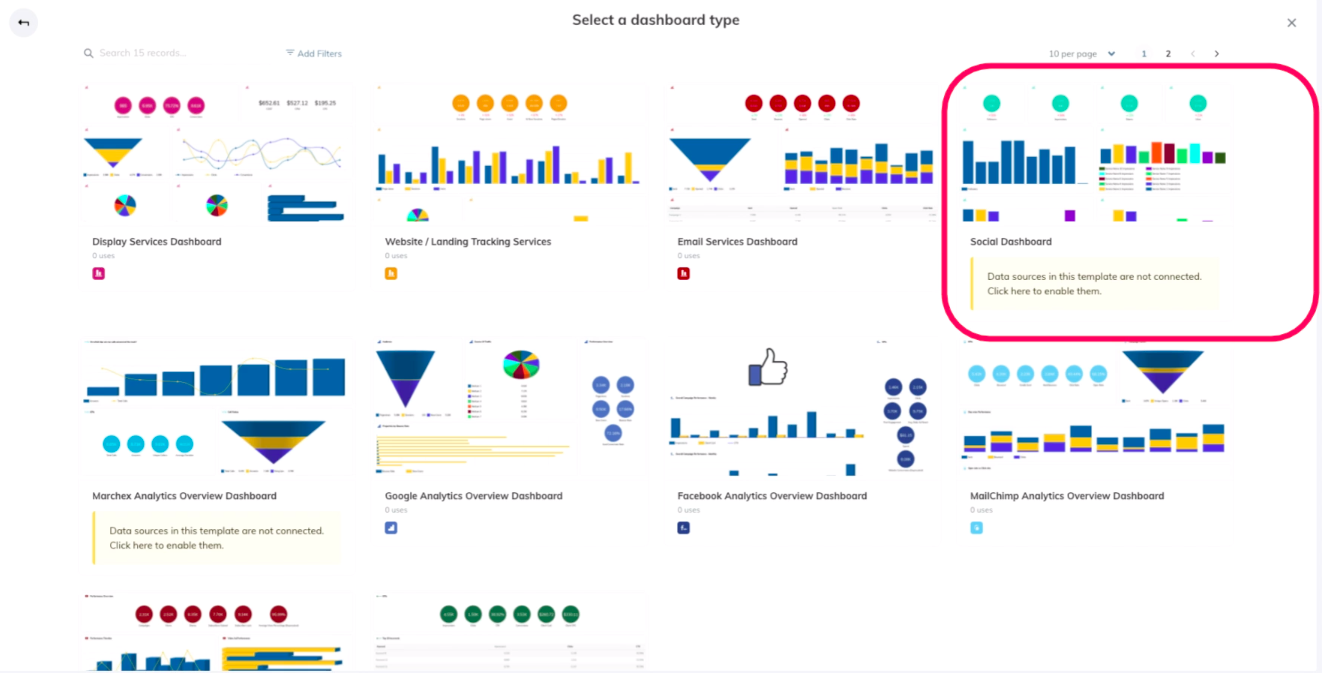
If you’re updating dashboards one at a time, you’re wasting hours. Making the same change to 30 clients means clicking into 30 accounts, updating each chart, and hoping nothing breaks. That doesn’t work when you’re growing fast.
TapClicks dashboards run on templates. When you add a new metric or chart, you can apply it across every relevant client dashboard instantly. That update takes minutes, not hours. If one client doesn’t need it, you can uncheck the box and move on.
Every widget, metric, or full layout can be reused and updated automatically. You’re not limited by account size.
You don’t have to send reports manually either. You can grant access to clients and let them check dashboards on their own time. You set permissions, control who sees what, and keep sensitive metrics private.
Auto-Fill Branded Reports with the Latest Data
If you’re still building decks by hand, you already know how long it takes to pull screenshots, paste charts, and export numbers.
TapClicks ReportStudio handles that for you. You can use ready-made templates or design your own. Reports come white-labeled by default and export in PDF, PPT, or CSV.
Any calculation or chart you created earlier shows up in your report automatically. You don’t have to touch it again unless you want to make a change. That means no outdated metrics and no broken formulas.
You can schedule reports to send weekly, monthly, or on your preferred timeline. TapClicks sends them automatically to your list. Permissions let you show the right data to the right audience, without exposing sensitive information.
Recommended Reading: Why Storytelling Is the #1 Thing a Client Reporting Tool Needs
4. Build a Visual Layout
Your client should be able to open your report and find the necessary numbers in seconds. That’s your goal. Clear layouts help your client read faster and make better decisions.
Group similar metrics together. Put campaign performance and conversions in one section. Use visual space to separate each group. Highlight what changed with simple charts or labeled numbers.
Work from customizable report templates if you manage multiple accounts. That gives you structure without making every report feel the same.
A layout that’s clean and predictable helps your client trust what they see. When your reports are easy to follow, you spend less time explaining and more time focusing on results.
5. Add Context and Explanations
Don’t assume your client knows every metric—help them. Explain what changed, why it changed, and what it means for their goals.
Write clear, simple explanations under your charts or summaries. If conversions dipped, say what might have caused it. If traffic spiked, point to the campaign or channel behind it.
Context helps your client understand your work. It also keeps the conversation productive. When clients walk into meetings with a full picture, they ask better questions and make better decisions.
6. Review and Polish Before Delivery
Read your report before you send it. If something feels off, fix it. Check your numbers, verify your sources, and make sure everything is current.
Look at the layout. If it feels crowded or hard to follow, spread the content out. Fix small things like heading sizes, font spacing, or chart alignment. You’re showing your client that you care about the quality of the work, even in presentation.
Professional formatting builds trust. Your report should be easy to read, visually clear, and fully accurate.
7. Set a Reporting Schedule
You need a rhythm your client can rely on. Reports should arrive when expected, not when convenient. Pick a schedule that fits the pace of your work. Weekly reports work well for ad campaigns. Monthly reports make sense for SEO or brand projects.
Talk to your client about timing. Set a clear delivery plan, and stick to it. Use reminders or automation to stay consistent.
Set up shared links or folders so you can give your client access to reports without needing to resend files. A reliable schedule makes it easier to work with and shows your client that you’re organized.
Regular updates keep communication smooth, especially when results change quickly. A steady rhythm helps your client stay focused and gives your reports more impact.
Show Actionable Insights Without Drowning in Data With TapClicks
TapClicks helps you stop sorting through endless spreadsheets. You connect your data once, and the platform organizes it for you. Each report shows only what matters, based on your client’s goals.
You can highlight trends, compare past and present performance, and add context. Charts and metrics update on their own, so you never waste time on repeat work. If something changes, your reports reflect it right away.
FAQs About What is Client Reporting
How to do a client report?
Start by gathering relevant data from your marketing platforms. Choose key metrics that align with the client’s goals, add clear visualizations, provide context and insights, and deliver the report on a regular schedule.
What does a client report look like?
A client report includes an executive summary, key performance indicators, visual charts, comparisons over time, and specific insights or recommendations tied to performance.
Could you give some examples of working with client reports?
You might report on website traffic growth from a content marketing campaign, compare ad spend versus return on multiple platforms, or highlight shifts in audience engagement after a strategy update.
What are client reporting best practices for agencies?
Use consistent templates, automate data collection, focus on clarity, align metrics with client goals, and send reports on a predictable schedule. Always provide context, not just numbers.