

TapClicks AI Reporting makes marketing insights effortless. All you have to do is connect your data, choose your format, and let AI do the work. In minutes, your numbers transform into clear, actionable stories — not just reports. SmartReports delivers the outcomes that matter most: more time back in your week, sharper insights in your hands, and a clear story behind every campaign. It's reporting that doesn't just show data — it delivers decisions.
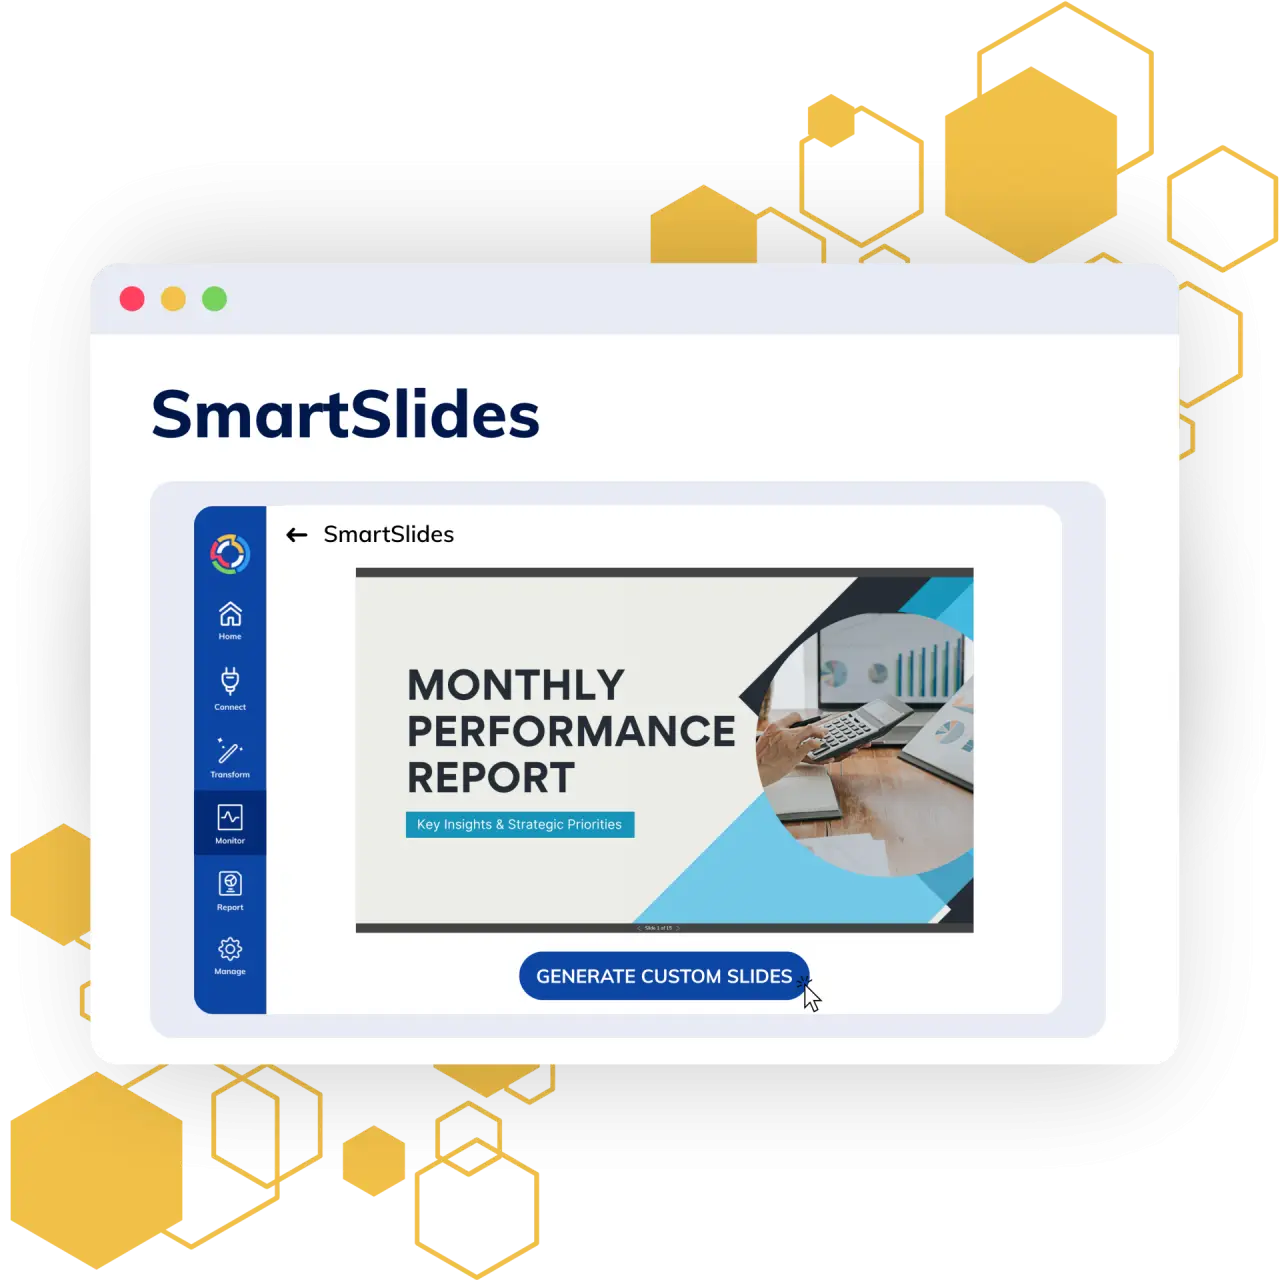
SmartSlides
AI Reporting with SmartSlides turns your marketing data into stunning, insight-driven presentations — instantly. Every slide is professional, polished, and built to tell the right story. Walk into every meeting prepared, confident, and ready to impress.
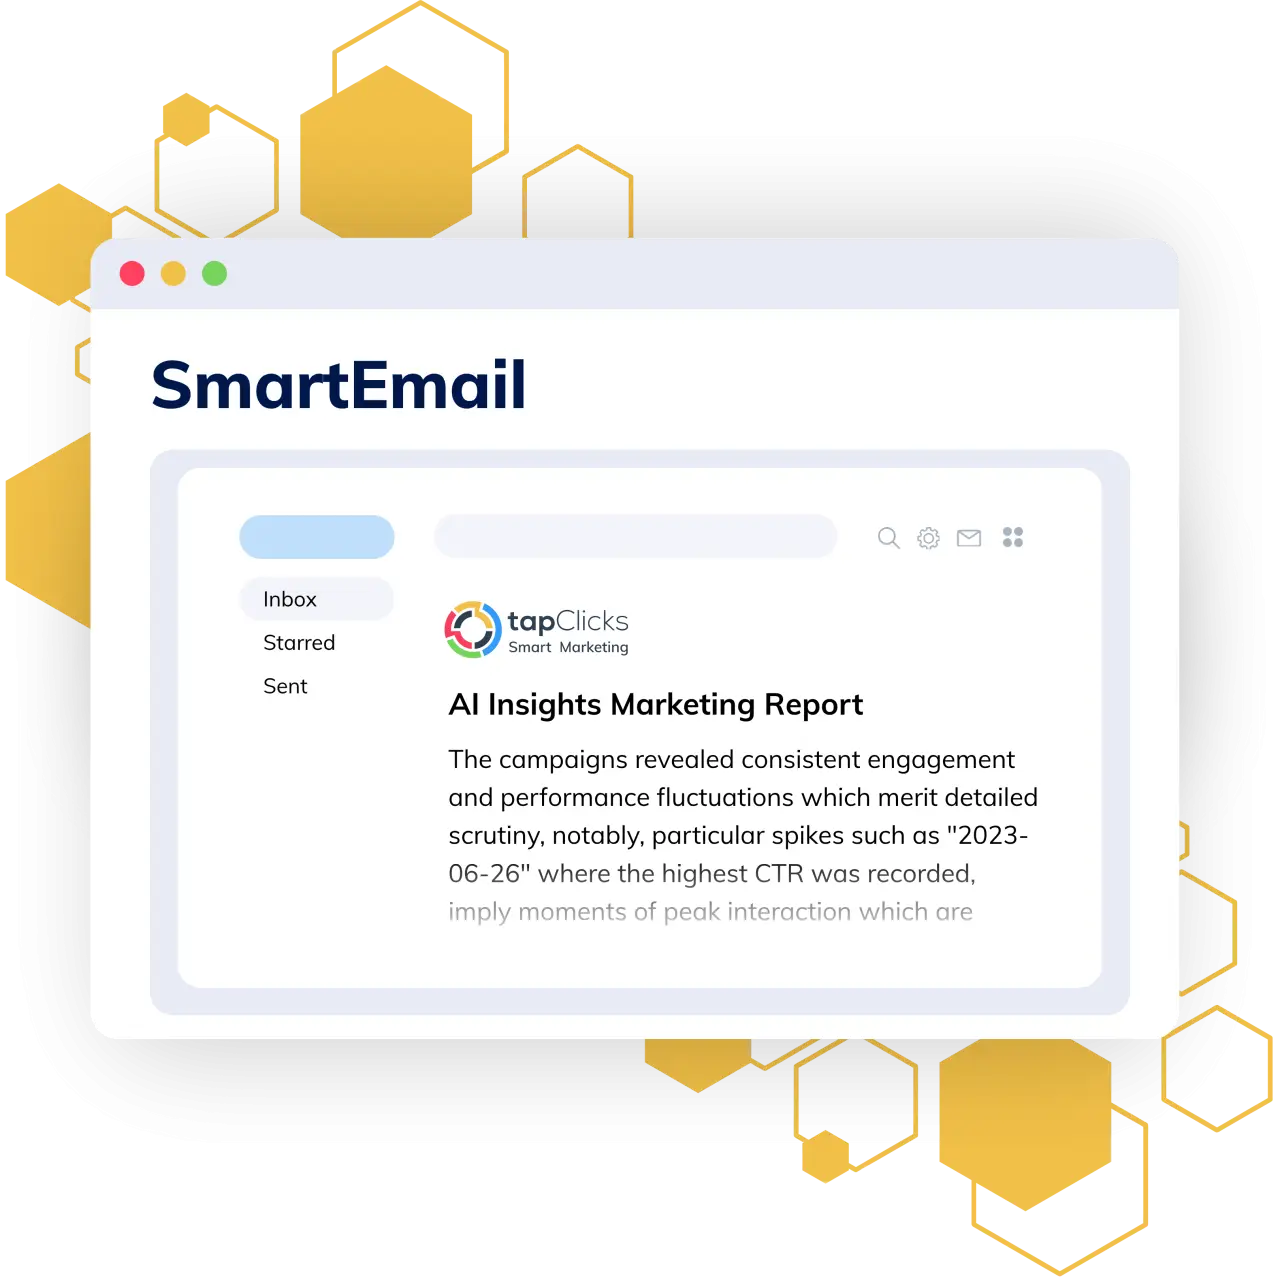
SmartEmail
Tired of sending reports no one opens? AI Reporting with SmartEmail delivers summaries people actually understand. It automatically identifies trends, flags issues, and highlights wins — turning data into quick, readable insights that drive action. Your team stays informed and aligned without lifting a finger.
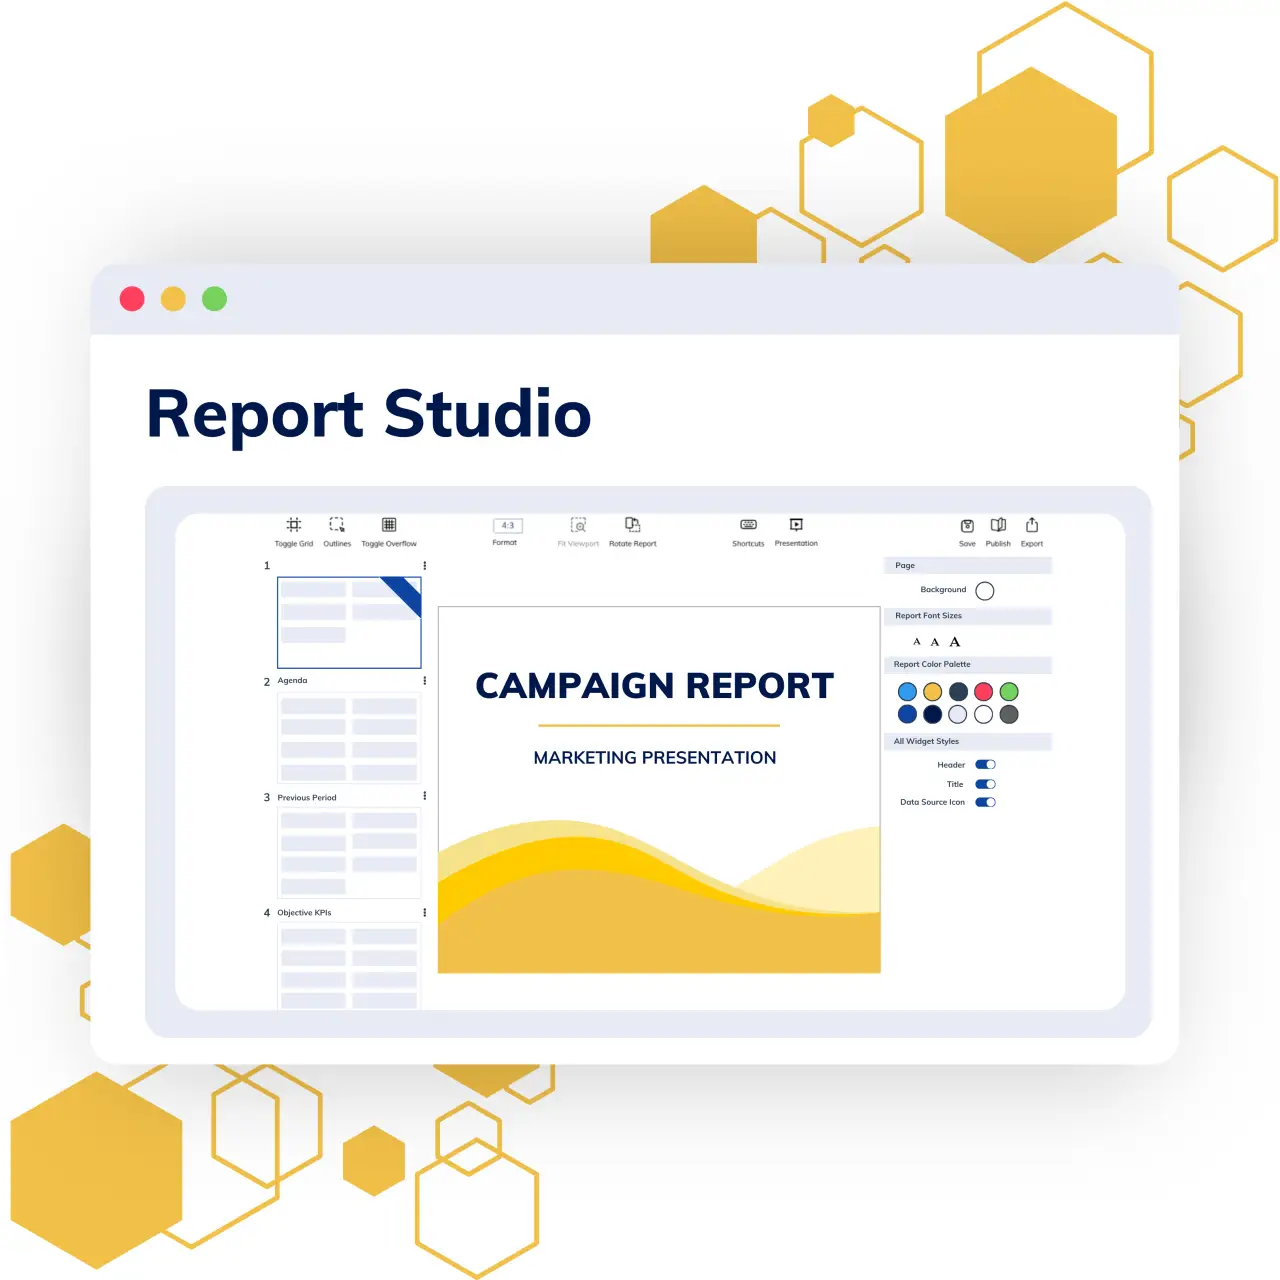
Report Studio
Report Studio empowers you to create visually stunning, data-driven reports with ease. Using an intuitive drag-and-drop editor, customizable templates, and dynamic variables, Report Studio transforms complex data into captivating presentations tailored to each client or business unit. Elevate your reporting experience with custom widgets, stunning visualizations, and the ease of dynamic content.
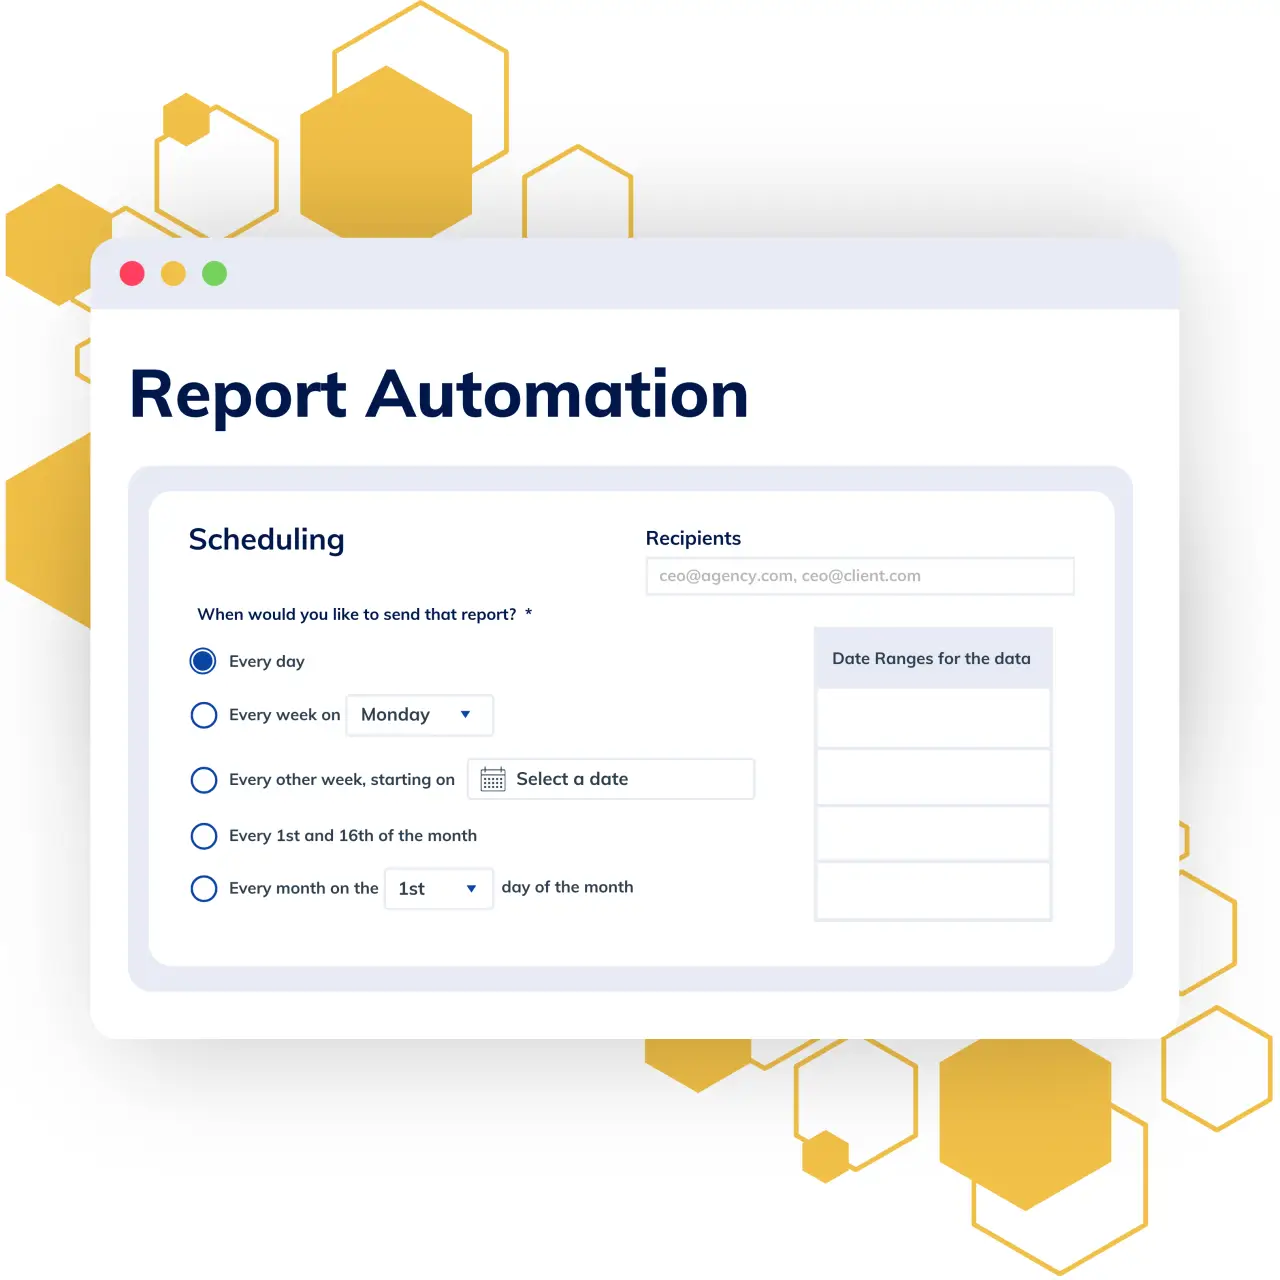
Report Automation
Effortlessly schedule and share reports, ensuring stakeholders stay informed with timely, accurate insights. Automate report delivery on a daily, weekly, or monthly basis, or share quick downloads for instant needs. Compatible with various formats, including dashboards and Report Studio content, it offers flexibility for any reporting requirement.
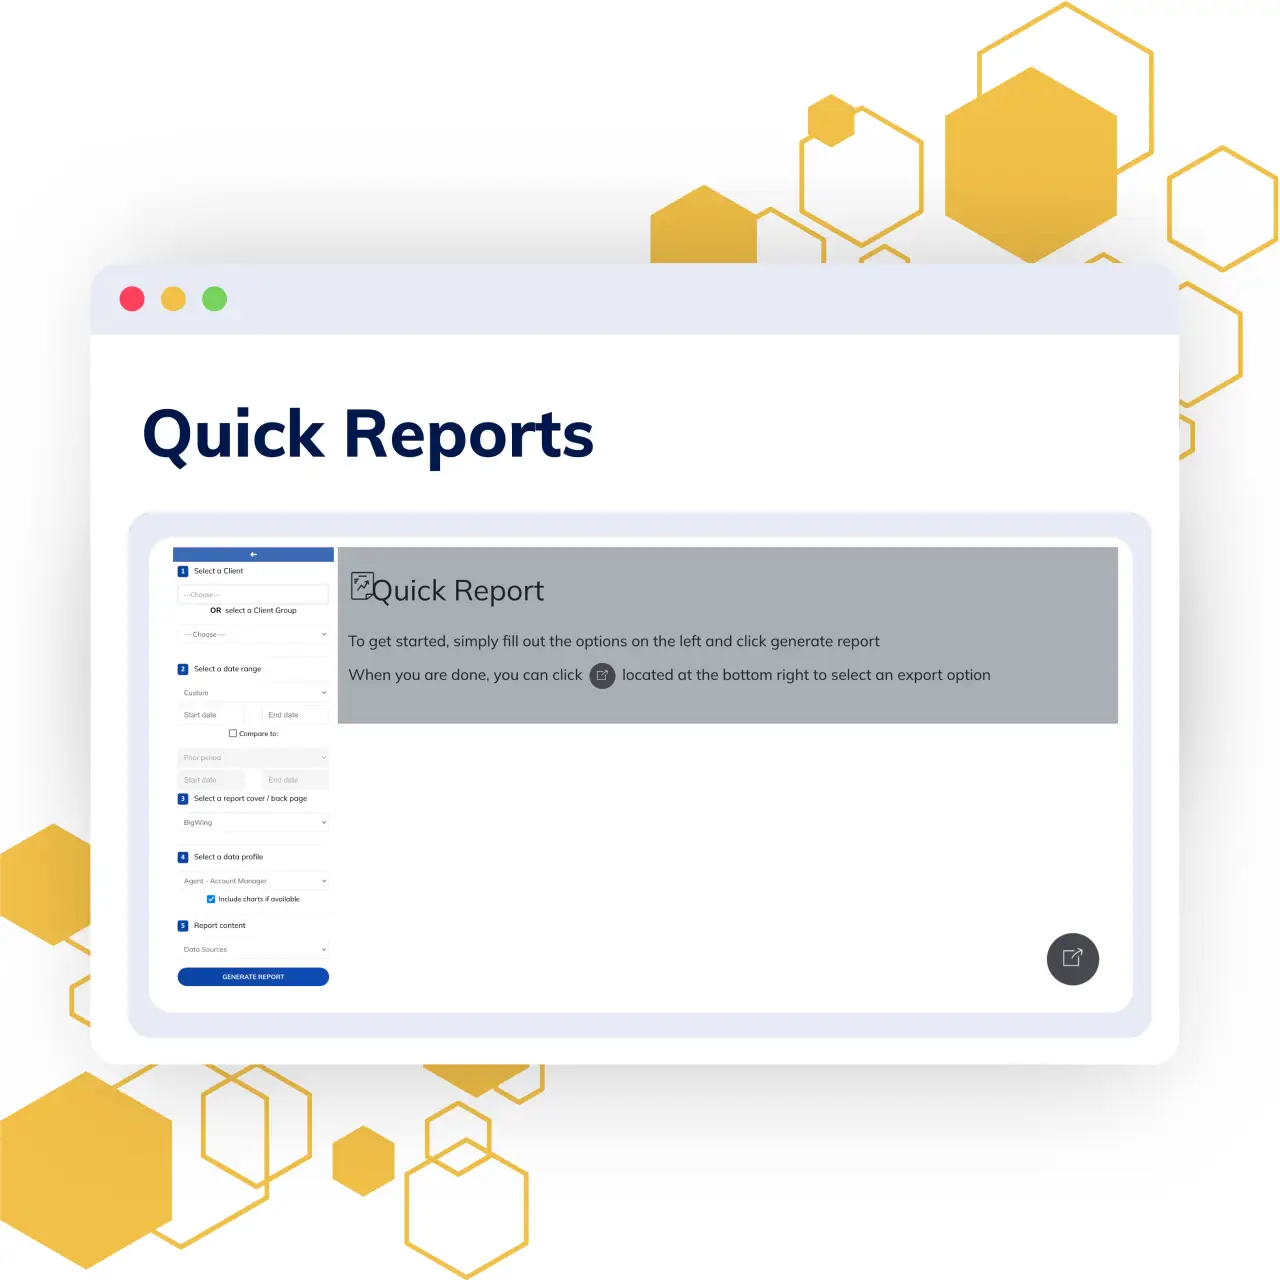
Quick Reports
Quick Reports simplifies reporting and amplifies impact by enabling instant report generation and streamlined communication. With support for various formats, it provides flexibility in report creation and immediate distribution to multiple recipients, ensuring all stakeholders are promptly updated. Save time, enhance convenience, and maintain efficiency across your organization.
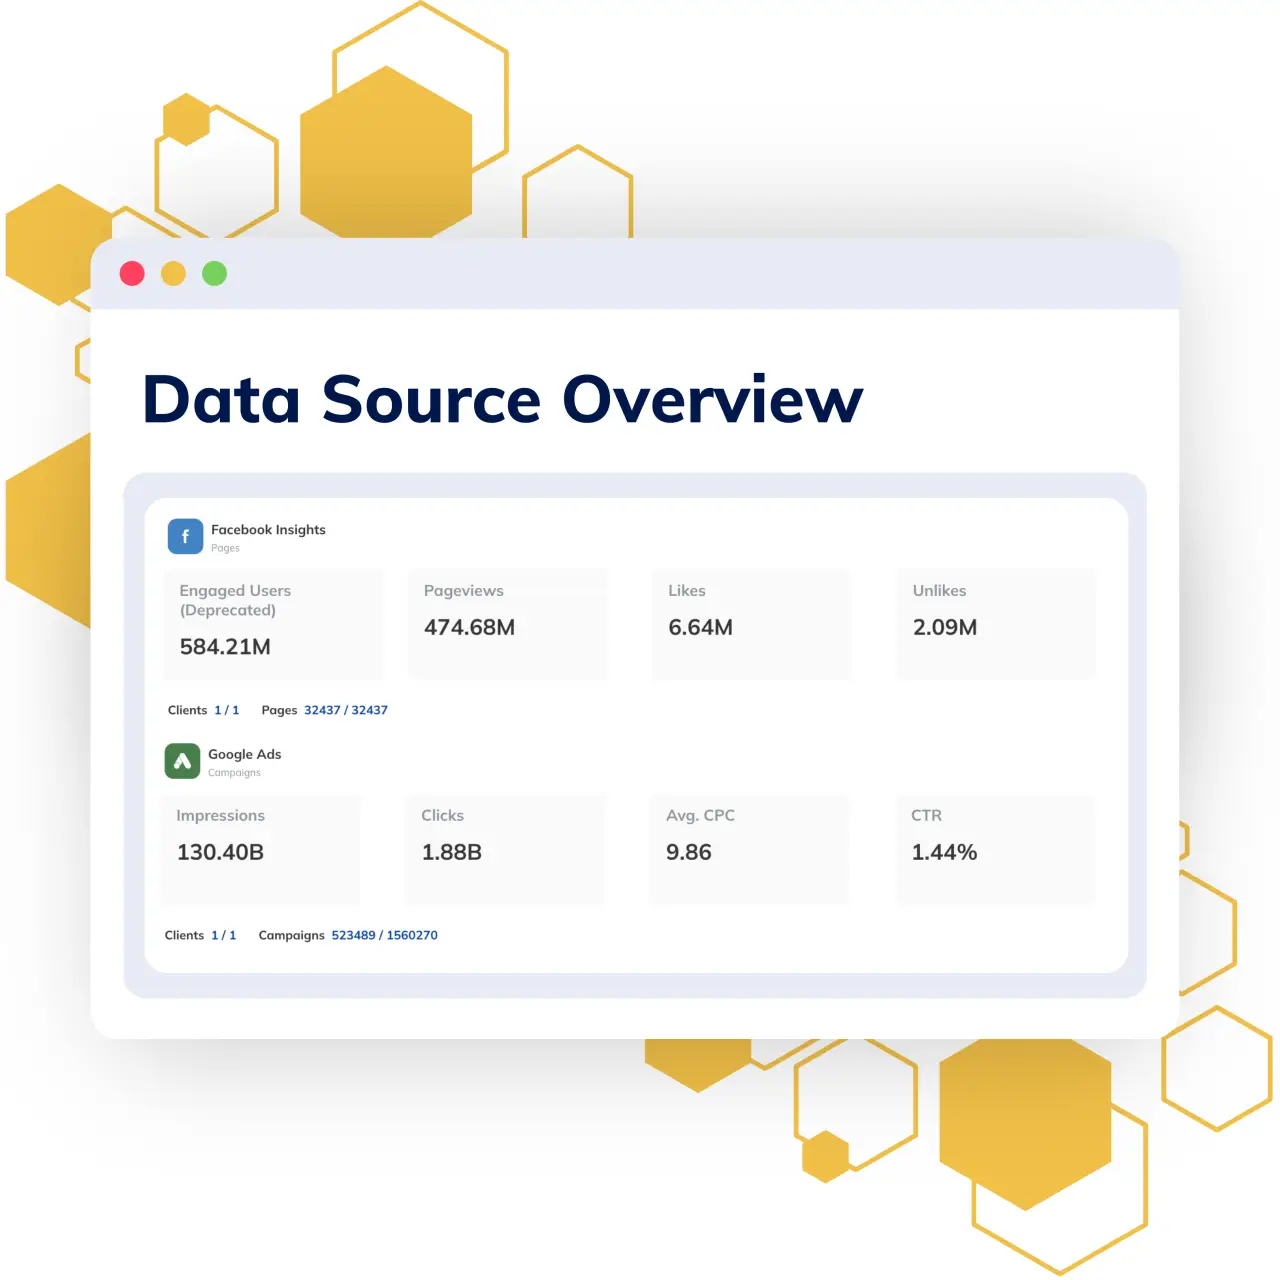
Data Source Overview
Effortlessly manage and troubleshoot your marketing data with the Data Source Overview. This feature aggregates all connected data sources into a streamlined interface, allowing businesses, brands, and agencies to easily monitor, filter, and verify data. Save time and enhance clarity with customized data viewing, all in one place.
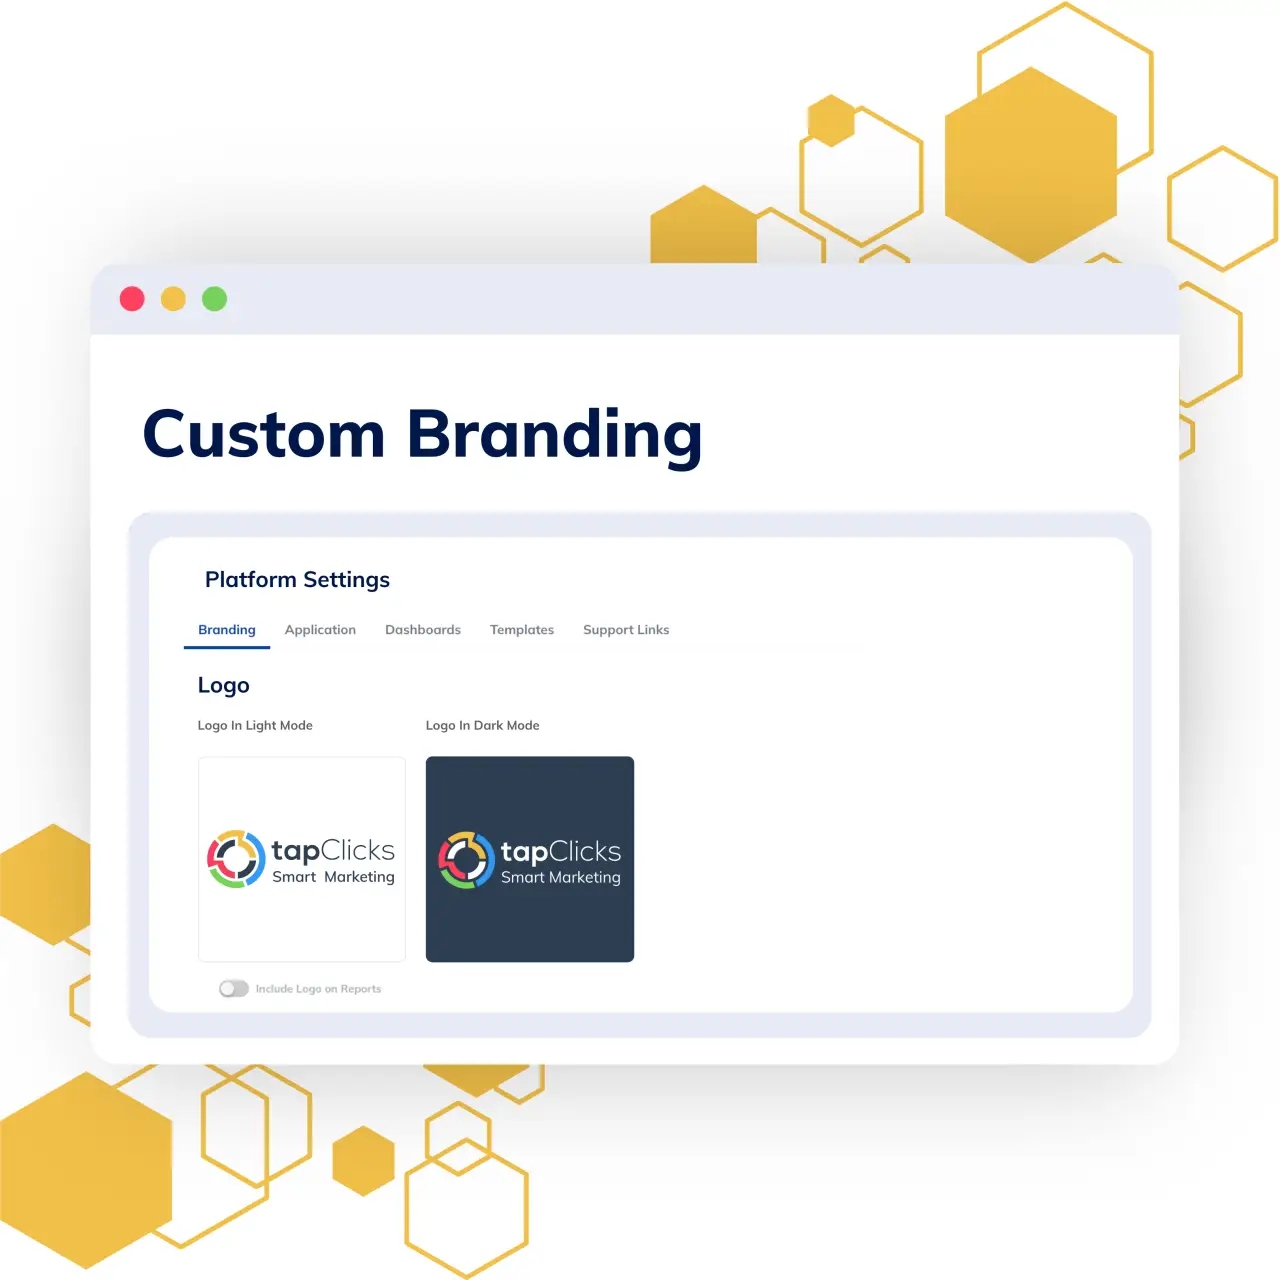
Custom Branding
Custom Branding empowers you to elevate your brand identity by fully personalizing the platform for your employees and clients. Customize everything from logos and color schemes to login screens and welcome emails, creating a cohesive branded experience. For a more comprehensive brand presence, advanced options include vanity URLs, customized email fields, and tailored application naming.
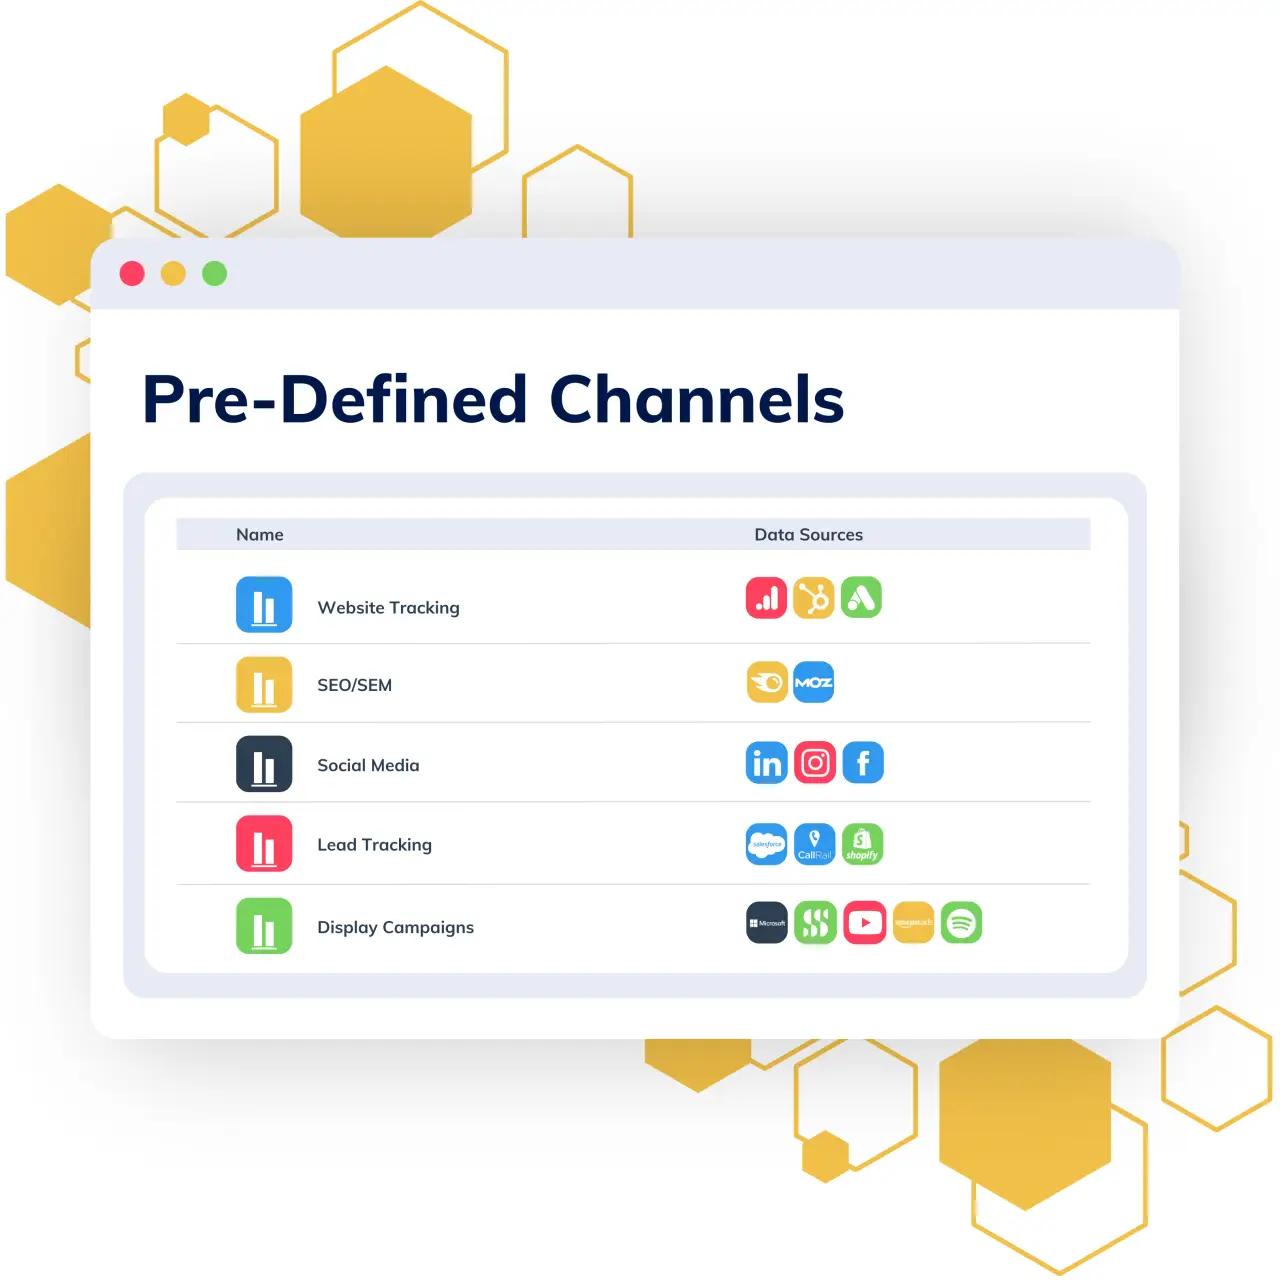
Pre-Defined Channels
Pre-Defined Channels streamline your data analysis by offering ready-made views that consolidate key metrics across various marketing services. Instantly access insights from Display, Email, SEM/PPC, Social Media, SEO, and more, without the need for custom configurations. These channels are designed for immediate use, saving you time while delivering critical data in a clear, actionable format.
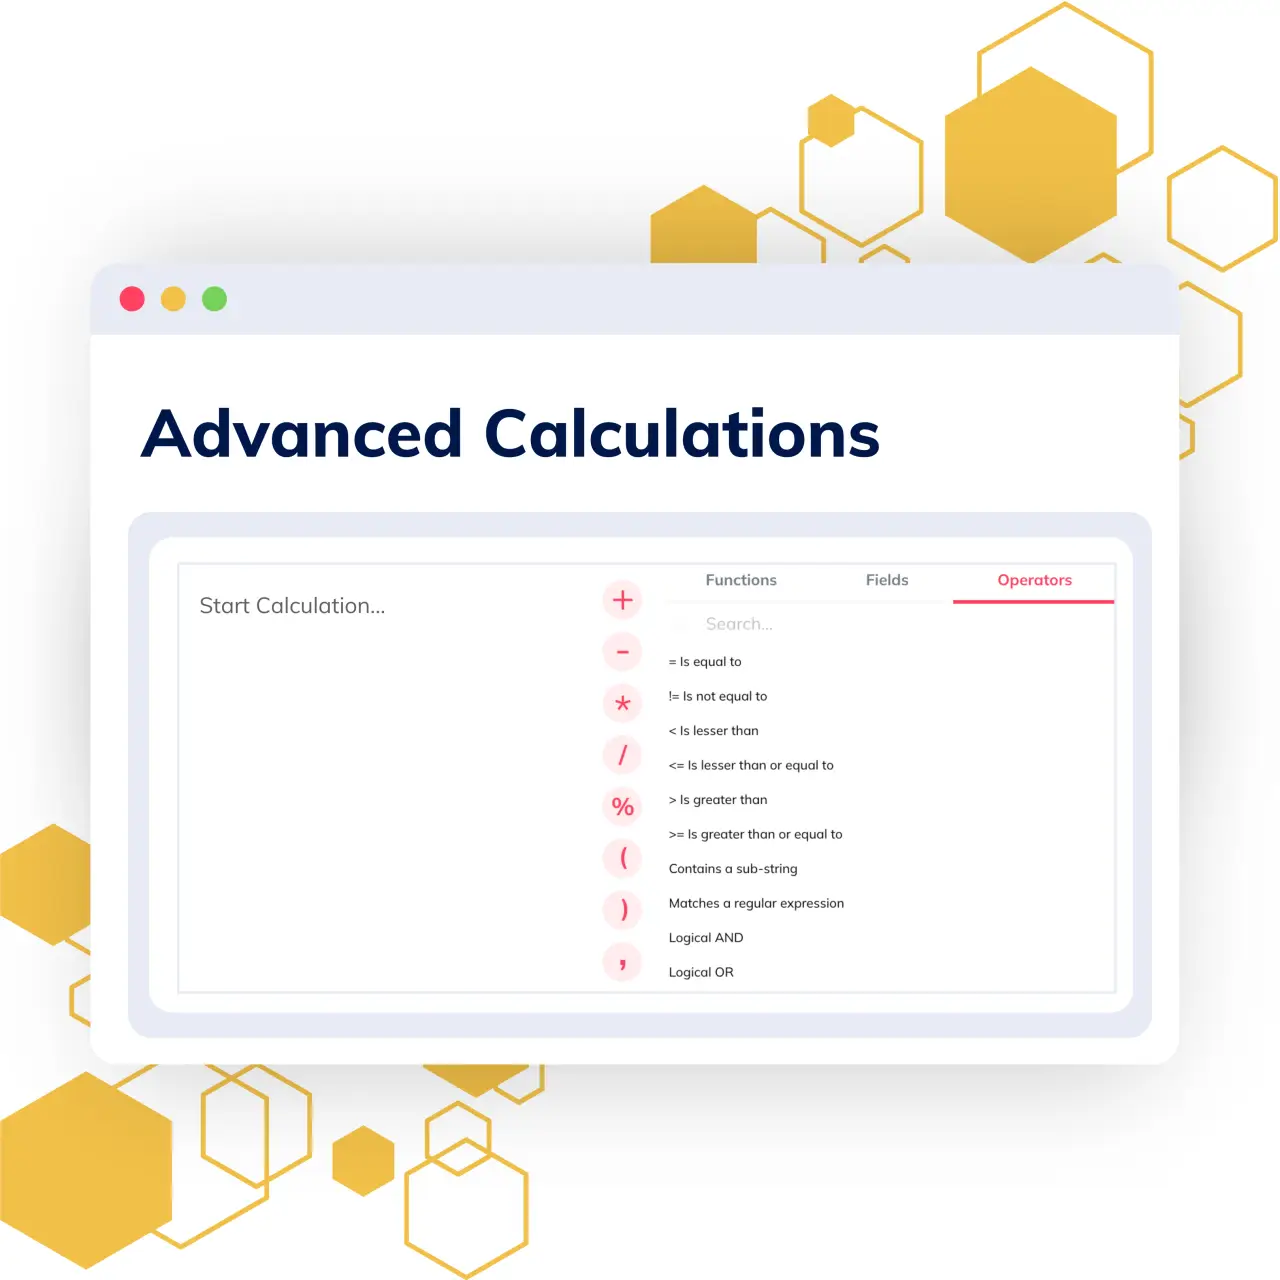
Advanced Calculations
Elevate your analytics with Advanced Calculations, transforming your data into a powerhouse of insights. With precision and flexibility, this feature enables deep analysis through custom formulas, conditional calculations, and advanced text manipulation. Whether you're aggregating data or applying specific business logic, Advanced Calculations offers total control, turning raw data into actionable intelligence that drives informed decisions and business growth.
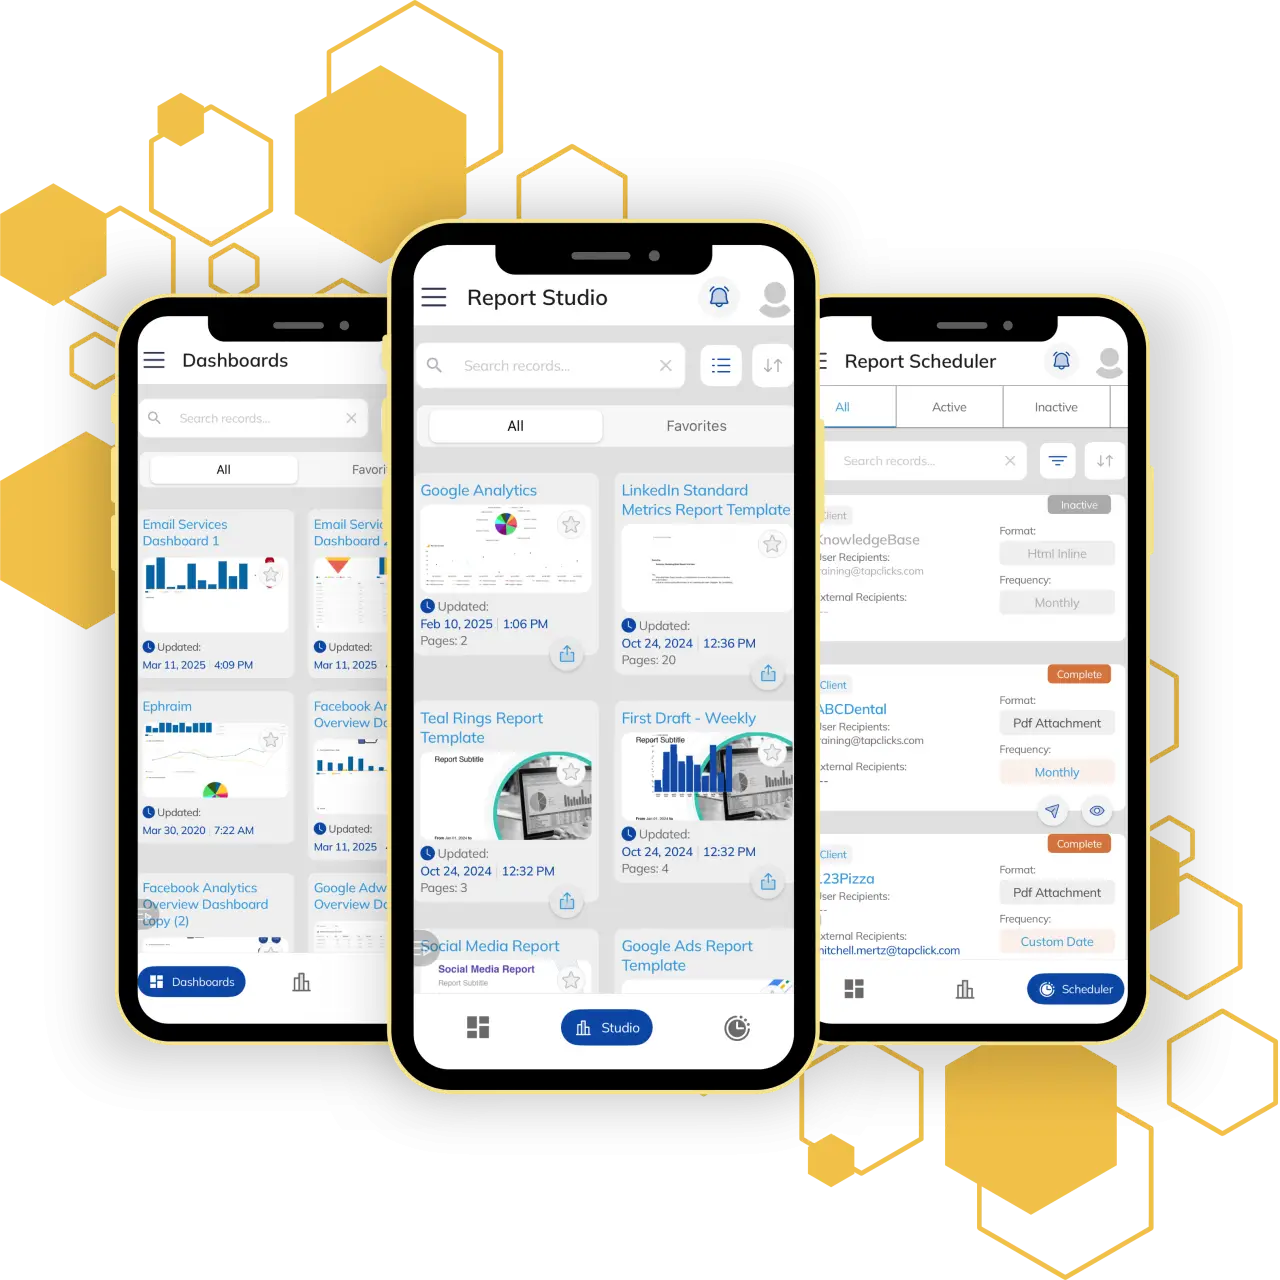
TapReports Mobile App
Use the TapReports Mobile App to access your dashboards, view reports, and manage scheduled reports on the go. Stay informed with key marketing insights and data analysis anytime, anywhere. Are you an existing TapReports user? Click here to download the app from the Play Store or App Store.
"They helped streamline and automate the process, saving us enough in man-hours alone to achieve our ROI goals. Most importantly, we now have a tool that helps us attract new clients as well as up-sell and better retain our existing clients."
"TapAnalytics helps our clients toll up all campaign information in a single customizable dashboard, with on-demand reporting, saving a huge amount of time and effort."
The AI-Powered Marketing Intelligence Platform. Where data intelligence becomes competitive advantage.
TapClicks © 2026. All Rights Reserved.