How to Automate Marketing Analytics Without Spreadsheets
How many hours do you spend updating reports every week? Many teams still export data from separate platforms, which makes campaign performance harder to track.
Companies now use centralized dashboards and connected data sources to keep performance insights accurate and easier to manage. Unified dashboards, scheduled updates, and AI-powered analysis help teams monitor results without constant manual work.
This guide explains how to streamline marketing analytics through centralized data, dashboards, AI insights, and multichannel performance analysis.
TL;DR
-
Automate marketing analytics by connecting campaign data into centralized dashboards and automated workflows.
-
Standardize campaign naming and tracking rules to improve data consistency across platforms.
-
Use dashboards, alerts, and scheduled summaries to monitor campaign performance.
-
Apply AI-powered analytics tools to identify trends, attribution issues, and unusual campaign activity faster.
-
TapClicks helps teams automate reporting, dashboard management, stakeholder updates, and cross-channel analytics.
Choose the Right Metrics Before You Automate Reporting
Many teams set up reporting before identifying which numbers connect to revenue. That usually creates dashboards packed with campaign data nobody reviews after the first week. Reports lose value when you can’t explain higher ad costs or lower conversion rates.
Start with a focused group of key performance indicators (KPIs) linked to marketing performance and customer growth.
Most teams track:
-
Conversion rates
-
Customer acquisition cost (CAC)
-
Customer lifetime value (CLV)
-
Return on ad spend (ROAS)
-
Pipeline contribution
-
Retention metrics
Keep metric definitions consistent across platforms. Your Google Ads account, customer relationship management (CRM) system, and website analytics tools should measure conversions using the same logic.
Different definitions create data discrepancies. Dashboards should help you spot campaign pacing issues, ad cost changes, or retention drops quickly.
Too many widgets make insights harder to interpret. Cleaner layouts make actionable findings easier to understand.
Automate Marketing Data Collection Before Reporting
Disconnected measurement systems create inconsistent performance analysis. Your CRM may show 120 conversions, while Google Ads shows 145. Email and web analytics tools often rely on different attribution rules.
As a result, stakeholders spend time reconciling figures and questioning which metrics reflect actual performance.
Automated data collection connects your analytics platform directly to advertising channels, CRM systems, email tools, and social media platforms. Application programming interface (API) integrations update dashboards automatically as new campaign data becomes available.
Naming conventions also affect measurement accuracy. One group may label a promotion “Meta Lead Gen,” while another uses “Paid Social Leads.” Dashboards then split the same initiative into separate categories.
Raw information can create additional challenges. Duplicate conversions, outdated labels, and broken tracking fields distort performance metrics. Automated transformation rules clean and standardize records before dashboard refreshes.
Automate Marketing Analytics Dashboards and Reports
Your dashboards should answer performance questions immediately. For example, a paid media manager may check whether yesterday’s campaign launch increased ad spend without improving conversions.
Later that day, a director may access the same view to confirm whether pipeline numbers still match weekly targets. That keeps campaign measurement consistent during stakeholder discussions.
Marketing analytics tools can automate those update workflows. Scheduled summaries can arrive through email or shared views before meetings begin.
Interactive dashboards also improve cross-channel visibility. Users can compare email engagement against paid search traffic during the same period. That context helps reveal how customers interact with different channels before converting.
Historical data also helps identify patterns after a targeting update or creative revision. Data visualization tools make campaign results easier to interpret when performance views track key metrics from multiple channels.
Many companies still prepare reports manually before presentations. TapClicks simplifies stakeholder distribution through interactive dashboards and centralized delivery workflows.
You can send presentation exports, dashboard links, and scheduled summaries without recreating deliverables every week.
Automate Marketing Alerts, Monitoring, and Performance Analysis
Automated alerts help teams catch problems earlier. Your dashboard can notify you when conversion tracking stops after a landing page update.
It can also flag unusual spending patterns before budget pacing drifts too far from monthly targets.
Many marketing automation tools monitor campaign activity continuously. Operations teams then receive alerts when Google Analytics traffic drops unexpectedly, or attribution reporting no longer matches conversion data.
These alerts often track:
-
Conversion tracking failures
-
Budget pacing issues
-
Unusual traffic spikes
-
Attribution inconsistencies
Performance monitoring also helps surface insights without constantly checking dashboards.
In some cases, a decline in branded search traffic points to a tracking issue rather than weaker performance. Web analytics platforms can also detect sudden shifts in user behavior after audience targeting updates or landing page revisions.
Cohort analysis adds another layer of insight. Comparing how recent customers respond to campaigns versus earlier audience segments can reveal long-term performance trends that daily monitoring may overlook.
Artificial intelligence expands this analysis further. Predictive models can identify unusual patterns in customer behavior and channel activity before performance issues affect revenue.
Use AI to Automate Dashboard and Widget Creation
Manual dashboard setup creates workflow bottlenecks for marketing teams. Analysts often configure widgets by hand before performance data becomes accessible.
Requests for new visualizations can quickly pile up when campaign managers need fresh insights.
AI simplifies that workflow. Many tools can now generate dashboard widgets from plain language prompts.
For example, you can type “show campaigns with high spend and low conversions,” and the platform creates the chart automatically.
AI also helps teams track metrics without configuring every field manually. The system can identify the correct source, recommend chart formats, and organize complex data into usable visualizations.
That gives more people direct access to insights. Coordinators, account managers, and executives can analyze data without waiting for analyst support.
TapClicks applies that approach through its Widget Creation Agent. You describe the report you need in plain language, and the platform generates the visualization using connected campaign data already inside the dashboard.
Automate Cross-Channel Campaign Analysis and Attribution
Marketing campaigns rarely generate conversions from one source alone.
A customer may click a paid search ad first, revisit later through email, and convert after finding your brand through organic search. Attribution analysis should connect those customer interactions into a unified customer journey view.
Cross-channel analysis helps you understand how different channels influence purchasing decisions before conversions happen.
Data integration capabilities also improve visibility. Information from several platforms appears in one place instead of separate dashboards.
For instance, you can combine CRM records with paid media metrics to identify which initiatives generate qualified leads. That context helps you make more informed decisions during budget planning and performance reviews.
Grouping related initiatives also simplifies analysis for enterprise organizations. You can evaluate related efforts together instead of opening multiple views individually.
Connect Reporting, Monitoring, and Optimization Into One Workflow
Marketing analytics automation continues evolving after dashboards go live. Automated workflows update as campaign data changes. The system also helps teams identify trends before problems affect performance.
A typical automation workflow includes:
-
Trigger-based data refreshes after CRM or campaign changes
-
Automated analysis pipelines for recurring stakeholder updates
-
Shared dashboards for sales discussions
-
AI alerts for unusual campaign activity
-
Centralized analytics systems connected to business intelligence (BI) tools
AI can identify unusual patterns in campaign activity, but human review is still necessary to interpret the results. For example, lower conversion volume may point to tracking issues or seasonal buying behavior.
Shared dashboards also improve alignment between departments. Marketing and sales teams can reference the same performance data during campaign planning and customer journey analysis.
That process becomes more important as analytics ecosystems expand. Unified workflows help organizations stay organized without relying on disconnected files.
How TapClicks Helps Automate Marketing Analytics
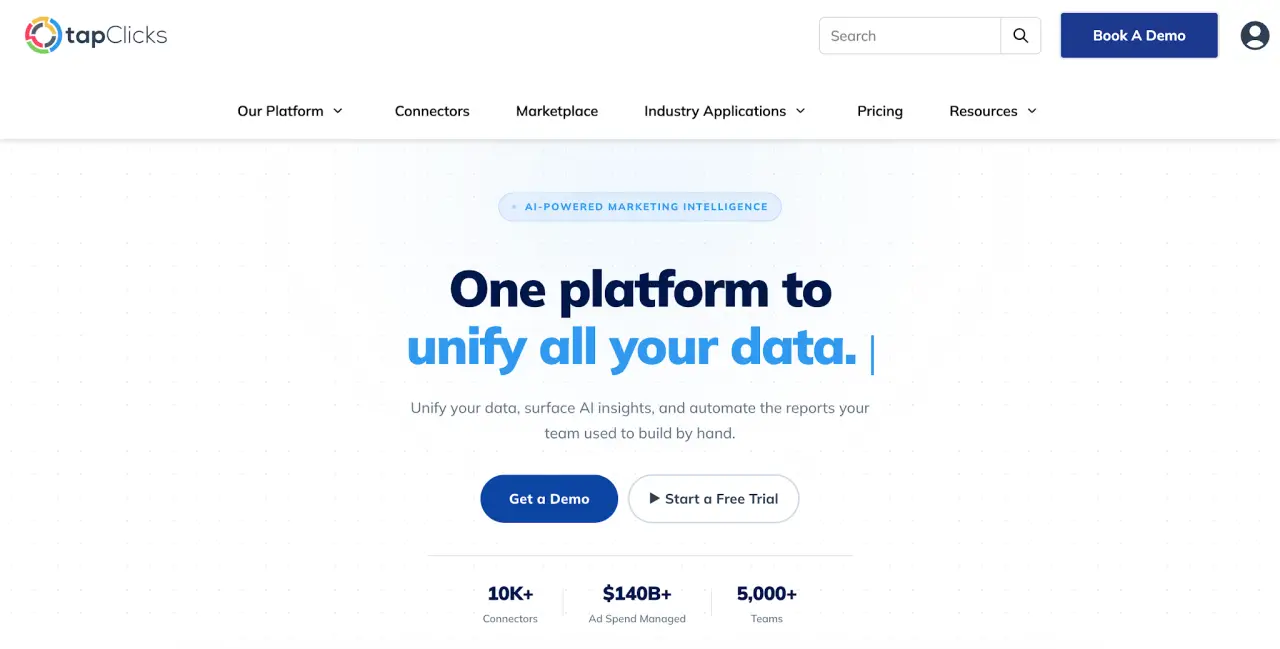
TapClicks helps you connect campaign data, automate recurring updates, and manage performance analysis inside a single platform. You can import information from multiple sources without manually moving files between systems.
Connect, Transform, Analyze, and Report in One Platform
TapClicks includes more than 10,000 data connections for marketing reporting. You can consolidate performance metrics from social media platforms, paid advertising accounts, and CRM systems into a unified view.
The platform also includes a Transformation Hub for organizing campaign data before the report updates. Businesses can standardize campaign naming after separating departments label campaigns differently.
Transformation Hub also normalizes metrics, helping maintain consistency between dashboards.
Turn Marketing Data Into Executive-Ready Narratives
Analyzing customer information often slows preparation before executive reviews. TapClicks addresses that through reporting products like SmartReports, SmartSlides, and SmartEmail.
SmartSlides converts campaign results into presentation-ready summaries for clients and executives. SmartEmail distributes scheduled updates directly through email.
Automate Reporting Distribution
Interactive Dashboards bring performance visibility into a single workspace. Organizations can schedule recurring performance updates through Report Scheduler.
They can also distribute reports through dashboard links, email summaries, or presentation exports.
Unify Campaign Reporting and Analytics With TapClicks
Marketing analytics automation helps you manage reporting as campaign activity expands. Automated workflows can refresh dashboards, monitor activity, and distribute updates without constant manual effort.
Consistent data standards also improve analysis. You can review attribution insights, performance trends, and executive summaries within the same framework, reducing confusion during planning discussions and budget reviews.
TapClicks consolidates reporting, dashboard management, and stakeholder communication inside the same platform.
The platform also helps organizations manage recurring workflows without rebuilding presentations every week.
The right marketing analytics tool also helps you respond faster when performance changes. That becomes increasingly important as organizations add new data sources, customer segments, and personalized promotional strategies.
Book a demo to explore how TapClicks can automate your marketing analytics workflows.
FAQs About Automating Marketing Analytics
What is the 3-3-3 rule in marketing?
The 3-3-3 rule helps teams structure messaging around three goals, three audience pain points, and three calls to action. Many companies use it to simplify campaign planning and improve customer satisfaction through clearer messaging.
What are the seven steps of a marketing analysis?
Most marketing analysis processes include goal setting, data collection, audience research, competitor analysis, campaign measurement, performance review, and optimization.
Organizations often use A/B testing during the optimization stage to compare campaign variations and improve results.
Which software is best for marketing metrics analysis?
The right platform depends on your needs, campaign complexity, and data sources. Many teams choose platforms with dashboards, scheduled reporting, and data warehouse integrations.
TapClicks helps companies manage cross-channel analytics and stakeholder reporting from one platform.
How do you automate marketing?
Marketing automation uses software to streamline repetitive tasks like reporting, email sequences, lead tracking, and campaign monitoring.
Many platforms also organize campaign data automatically before updating dashboards and performance reports.