AI Reporting / Dashboards
AI Marketing Dashboards: How to Turn a Prompt Into a Client-Ready Report
An AI marketing dashboard is a reporting view that a large language model builds for you from a plain-English description instead of a manual widget-by-widget setup — mapping your prompt to the right metrics, data sources, and chart types, then rendering it with your live campaign data. Instead of dragging and dropping for 45 minutes, you type a sentence and review a finished dashboard.
That shift matters more than it sounds like it should. Marketers manage more tools than ever — the 2026 Marketing Technology Landscape now counts 15,505 martech products, and the average team still uses less than half of what it owns (chiefmartec, May 2026). Reporting is usually where that fragmentation shows up first: someone has to stitch together Google Ads, Meta, LinkedIn, and GA4 into something a client or a CMO can actually read. AI dashboard creation is the first tool built specifically to remove that step, not add another platform on top of it.
This guide covers what an AI marketing dashboard actually does, how the workflow looks in practice using TapClicks' AI Dashboard Creation as a working example, prompts you can copy, and where the technology still needs a human in the loop.
What Is an AI Marketing Dashboard?
An AI marketing dashboard is a live reporting view generated from natural language input rather than manual configuration. You describe the outcome — the channels, the audience, the metrics that matter — and the system handles the mechanical work: picking data sources, choosing chart types, and organizing everything into sections.
This is different from dashboard automation, which refreshes data on a schedule but still requires a human to design the layout once. AI dashboard creation removes the design step itself. The AI reads your prompt the way an analyst would read a reporting request, then builds the structure a competent analyst would build.
Why Marketing Teams Are Turning to AI Dashboards Now
Three trends are converging at once, and reporting sits at the intersection of all three.
Stacks are getting more complex, not less. The 2026 martech landscape grew to 15,505 products — its flattest year of growth in 15 years on the surface, but underneath that, 1,488 products were added and 1,367 were removed, meaning the tools teams rely on are still churning fast (chiefmartec via Digital Applied, 2026). More connected sources means more manual work to unify them into one view.
Stack utilization is recovering but still low. Gartner's Marketing Technology Survey chain shows utilization bottomed at 33% in 2023 and has since recovered to 49% in 2025, with teams targeting 61% (Gartner via chiefmartec). Reporting tools are only useful if the output actually gets used — and a dashboard nobody opens because it took too long to build, or is too generic to act on, doesn't move that number.
AI adoption in marketing has outpaced AI production use. 90.3% of marketing and martech leaders say they use AI agents somewhere in their stack, but only 23.3% run them in full production, and 80.6% keep AI in an assist-only, human-approves-it role ("Martech for 2026," chiefmartec/MartechTribe, December 2025, via Digital Applied). Dashboard creation is a natural place for AI to graduate from pilot to production, because the output — a structured report — is easy for a human to check before it goes to a client.
Put together: teams have more data sources than they can manually wire into reports, and they're actively looking for AI use cases with a fast, verifiable payoff. Reporting is one of the clearest.
How AI Dashboard Creation Works: A Walkthrough
TapClicks' AI Dashboard Creation — part of SmartReports, released in the June 2026 platform update — is a useful, concrete example of how this works end to end, because the whole point of the feature is removing the manual build step entirely.
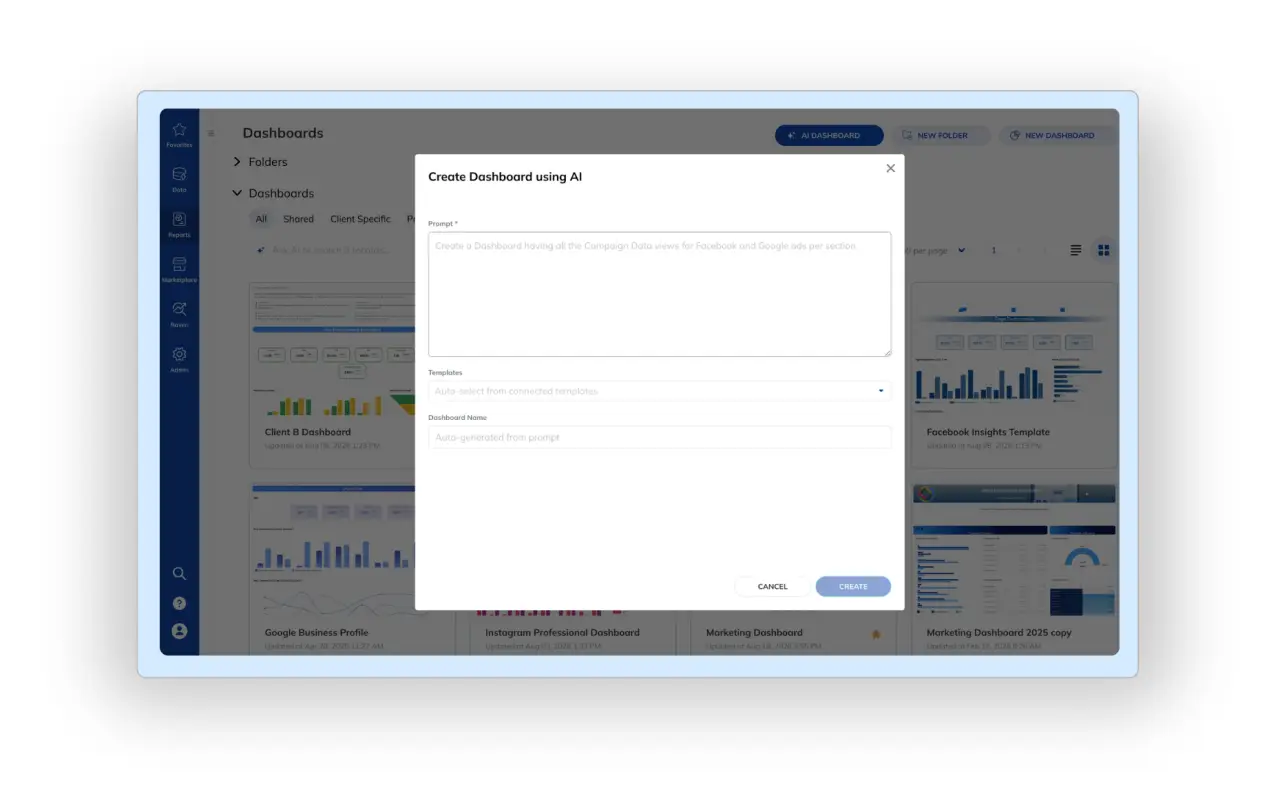
The old way: plan out sections and layout, build each widget one by one, select a data source per widget, pick a chart type manually, then arrange, preview, and tweak. TapClicks estimates this at 45+ minutes per dashboard for an experienced analyst.
The AI way:
- Describe the dashboard you want. For example: "Create an executive-ready marketing dashboard that consolidates Google Ads, Facebook Ads, and LinkedIn Ads, and highlights Impressions, Clicks, CTR, Conversions, CPA, ROAS, and Spend vs. the previous period."
- The AI parses the request into a build plan. It identifies the business objective (executive reporting), the connected data sources that match (Google Ads, Facebook Ads, LinkedIn Ads), the metrics named, and the comparison requested (vs. prior period).
- It structures the sections automatically. Dashboards get organized into groups like Executive Summary, Channel Performance, Campaign Breakdown, and Geo/Device Analysis, based on what the prompt implies.
- It assigns chart types by best practice. Line charts for trends over time, bar charts for comparisons, pie charts for distribution, tables for detailed breakdowns.
- It renders live. The finished dashboard populates with real, connected campaign data — not placeholder content — and is ready to review immediately.
TapClicks puts the resulting build time at under 2 minutes. The output is fully editable afterward through the standard dashboard editor, so refining filters, date ranges, or layout still happens the normal way — the AI removes the blank-canvas problem, not the analyst's judgment.
Watch AI Dashboard Creation in Action
5 Dashboard Use Cases You Can Build From a Single Prompt
The quality of an AI-generated dashboard depends on the quality of the prompt. These are five real use cases, with the kind of prompt that produces a usable result on the first try.
1. Executive multi-channel summary. "Create an executive-ready marketing dashboard that consolidates Google Ads, Facebook Ads, and LinkedIn Ads, and highlights Impressions, Clicks, CTR, Conversions, CPA, ROAS, and Spend vs. the previous period." Best for the report a CMO or agency client opens first.
2. Structured client report. "Structure the dashboard into Executive Summary, Channel Performance, Campaign Breakdown (top/bottom performers), and Geo/Device analysis, using a mix of charts and data grids." Best for recurring monthly client deliverables where consistency matters more than novelty.
3. Organic vs. paid traffic trend. "Create a data grid showing organic vs. non-organic page visits by day for the last 30 days." Best for a quick SEO-vs-paid pulse check without opening a separate analytics tool.
4. Landing page performance. "Show top landing pages by sessions, split organic vs. paid." Best for conversion teams deciding where to focus CRO effort.
5. Search term efficiency check. "Show top search terms with high spend but low conversions." Best for a fast wasted-spend audit before a budget review.
How to Write a Prompt That Builds a Good Dashboard
A dashboard prompt carries more information than it looks like — a business objective, a set of channels, specific metrics, and how you want the data broken down. The more of that a prompt includes, the more accurate the result.
| Include this | Example |
|---|---|
| Business objective | "executive reporting," "performance tracking," "wasted spend audit" |
| Channels | "Google Ads, Facebook Ads, LinkedIn Ads" |
| Key metrics | "CTR, Conversions, ROAS, CPA, Spend" |
| Breakdown | "by campaign," "by geo and device," "organic vs. paid" |
What a prompt can't do (yet): set dynamic filters or a custom date range. Those are governed by the dashboard's own controls after it's built, not by the prompt itself.
What AI Dashboards Still Can't Do
Worth being direct about this, because the honest limitations matter as much as the capabilities. As of the current release, AI dashboard creation does not generate automatic insights — anomaly detection and narrative summaries are on the roadmap, not shipped. It builds from existing dashboard templates, so highly unconventional layouts may still need manual assembly. And output quality is directly tied to prompt clarity: a vague prompt produces a generic dashboard, the same way a vague brief produces generic analyst work.
None of that makes the tool less useful — it just means AI dashboard creation replaces the setup labor, not the judgment labor. An analyst still decides what the dashboard should prove; the AI just stops making them build the scaffolding to prove it by hand.
AI Marketing Dashboards vs. Traditional Dashboard Builders
| Traditional dashboard builder | AI marketing dashboard | |
|---|---|---|
| Setup time | 45+ minutes per dashboard | Under 2 minutes |
| Skill required | Familiarity with the platform's widget/layout tools | Ability to describe the objective in plain English |
| Data source selection | Manual, per widget | Automatic, matched to connected integrations |
| Chart type selection | Manual | Applied by reporting best practice |
| First draft for a new client | Built from scratch | Built from prompt, refined from there |
| Customization after build | Full | Full — same editor, same controls |
FAQ: AI Marketing Dashboards
What is an AI marketing dashboard?
A reporting view built by AI from a plain-language prompt instead of manual configuration. The AI selects relevant metrics, chooses chart types, and organizes widgets into sections automatically, using your connected data.
How long does it take to build a dashboard with AI?
With TapClicks' AI Dashboard Creation, a fully structured dashboard renders in under 2 minutes, compared to an estimated 45+ minutes building the same dashboard widget by widget.
Does an AI dashboard use my real campaign data?
Yes. The dashboard renders using your connected data sources and reflects real performance. If a data source has gaps, affected widgets show limited or zero values rather than hiding the issue.
Can I customize a dashboard after AI builds it?
Yes. Generated dashboards are fully editable — you can modify widgets and layouts, adjust filters and date ranges, and add or remove sections through the standard editor.
Do I still need an analyst if I use AI dashboard creation?
Yes. AI dashboard creation removes the manual build step, not the analysis. Someone still needs to decide what the dashboard should measure and interpret what it shows.
What's the difference between AI dashboard creation and dashboard automation?
Automation refreshes data on a schedule inside a dashboard a human already designed. AI dashboard creation designs the dashboard itself, from a prompt, before any manual layout work happens.
Try It: A Prompt You Can Copy Right Now
If you want to see this on your own connected data, start with a version of the executive summary prompt above and adjust the channels and metrics to match your account. TapClicks' AI Dashboard Creation is available now inside SmartReports, SmartAnalytics and SmartSuite. If you're evaluating whether your data is even structured well enough for AI tools like this to work reliably, TapClicks' AI data-readiness assessment is a fast way to check before you build.
For related reading on making the reports themselves more effective once they're built, see our guides on client reporting, marketing agency reporting tools, and digital marketing reporting.