
11 Supermetrics Alternative Options That Offer Better Value
If you’re managing reports from different marketing channels, you’ve probably come across Supermetrics. It connects to tools like Google Sheets and Looker Studio and aggregates data into a single view.
For many marketers, it saves time on repetitive reporting. But once your reporting grows more complex, you might notice its limits.
In this article, you’ll find 11 Supermetrics alternatives that offer better value. Each one solves a different problem, so you can choose the right fit for your reporting needs.
What is Supermetrics?

Image Source: supermetrics.com
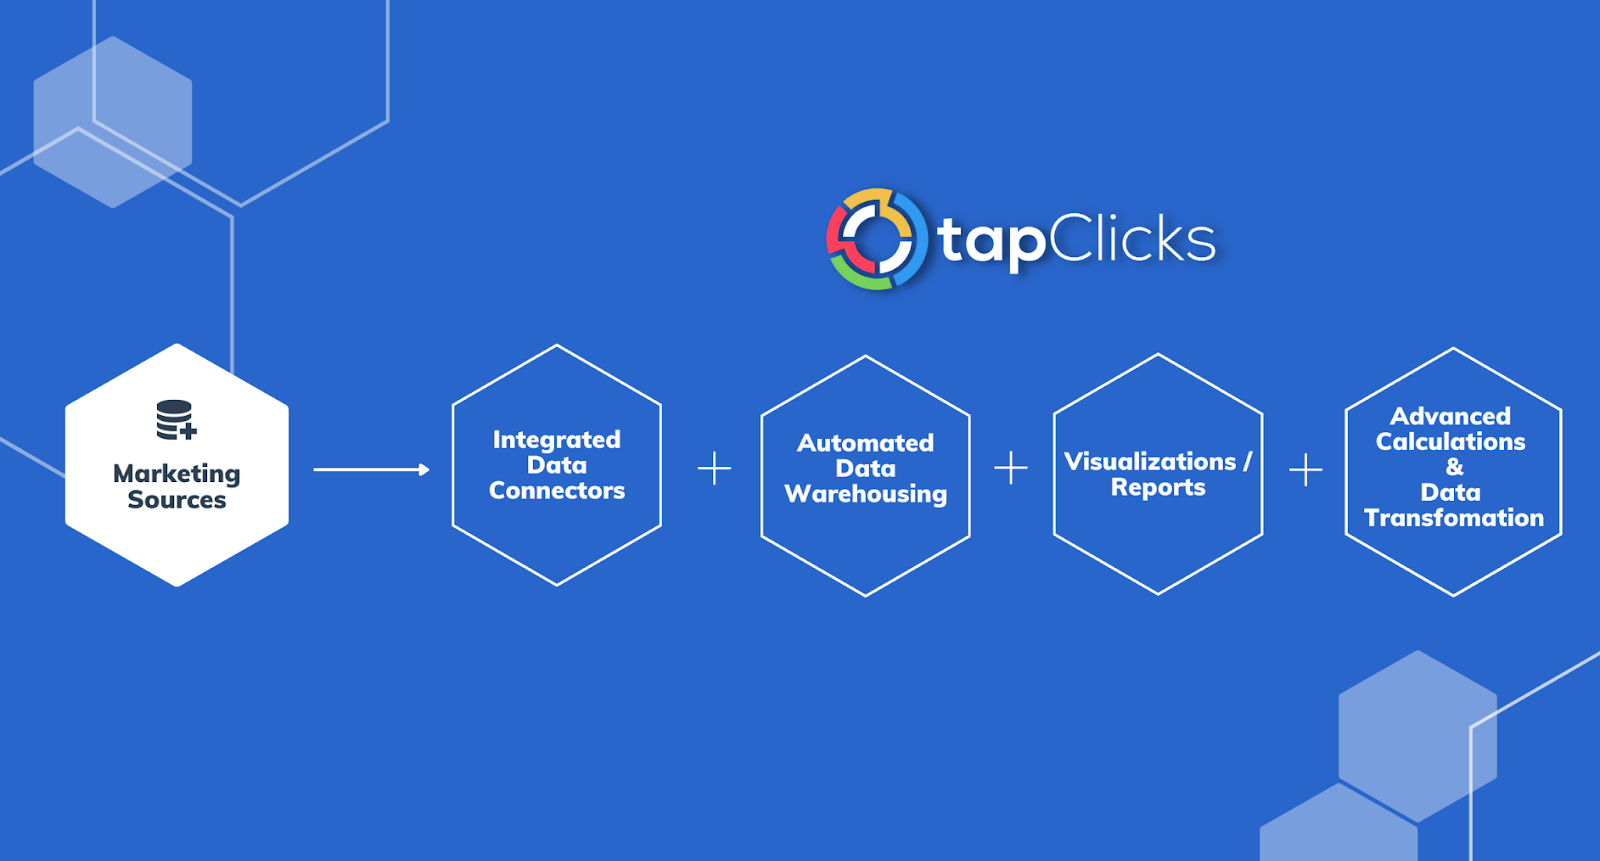
Supermetrics moves marketing and analytics data from your source platforms to your reporting tools. You can send information from Google Ads, LinkedIn Ads, Google Analytics, HubSpot, and other platforms to Google Sheets, Looker Studio, Power BI, or a data warehouse like BigQuery.
You don’t need to manage scripts or custom exports. The tool supports over 100 data source connectors, letting you pick what to pull and where to send it. For example, if you’re tracking several advertising accounts, you can combine that data into a single dashboard using predefined connectors.
Most marketers rely on Supermetrics for data integration across multiple platforms. You can select your data destination and begin reporting with minimal setup. The platform supports data blending, so you can combine metrics from different sources into a unified report without using spreadsheets.
For teams using data visualization tools or BI tools, Supermetrics allows deeper data analysis through filters, segment options, and calculated fields. It also includes advanced data transformation capabilities that help clean and standardize reports before exporting them.
Why Look for a Supermetrics Alternative?
You might have started with Supermetrics because it makes reporting easier. But as your reporting needs grow, some limitations can slow you down or block your progress.
If that sounds familiar, these are a few signs it’s time to look for a better fit:
-
Not enough platform coverage – If you use niche tools or custom platforms, you’ve probably noticed that Supermetrics supports fewer data sources. That means gaps in your reporting or more time spent handling exports manually.
-
Slow report performance – Large reports require fast data processing. If Supermetrics slows down when you run big pulls, you lose time.
-
Connector issues – Some Supermetrics connectors don’t include all the fields you need. Others stop working without warning, causing delays and incomplete reports.
-
Rising costs – Upgrading just to unlock basics like more destinations or refreshes adds up fast. You need pricing that matches your real usage.
11 Supermetrics Alternatives That Offer Better Marketing Reporting in 2025
If Supermetrics no longer fits your workflow or budget, you’ve got better options, such as:
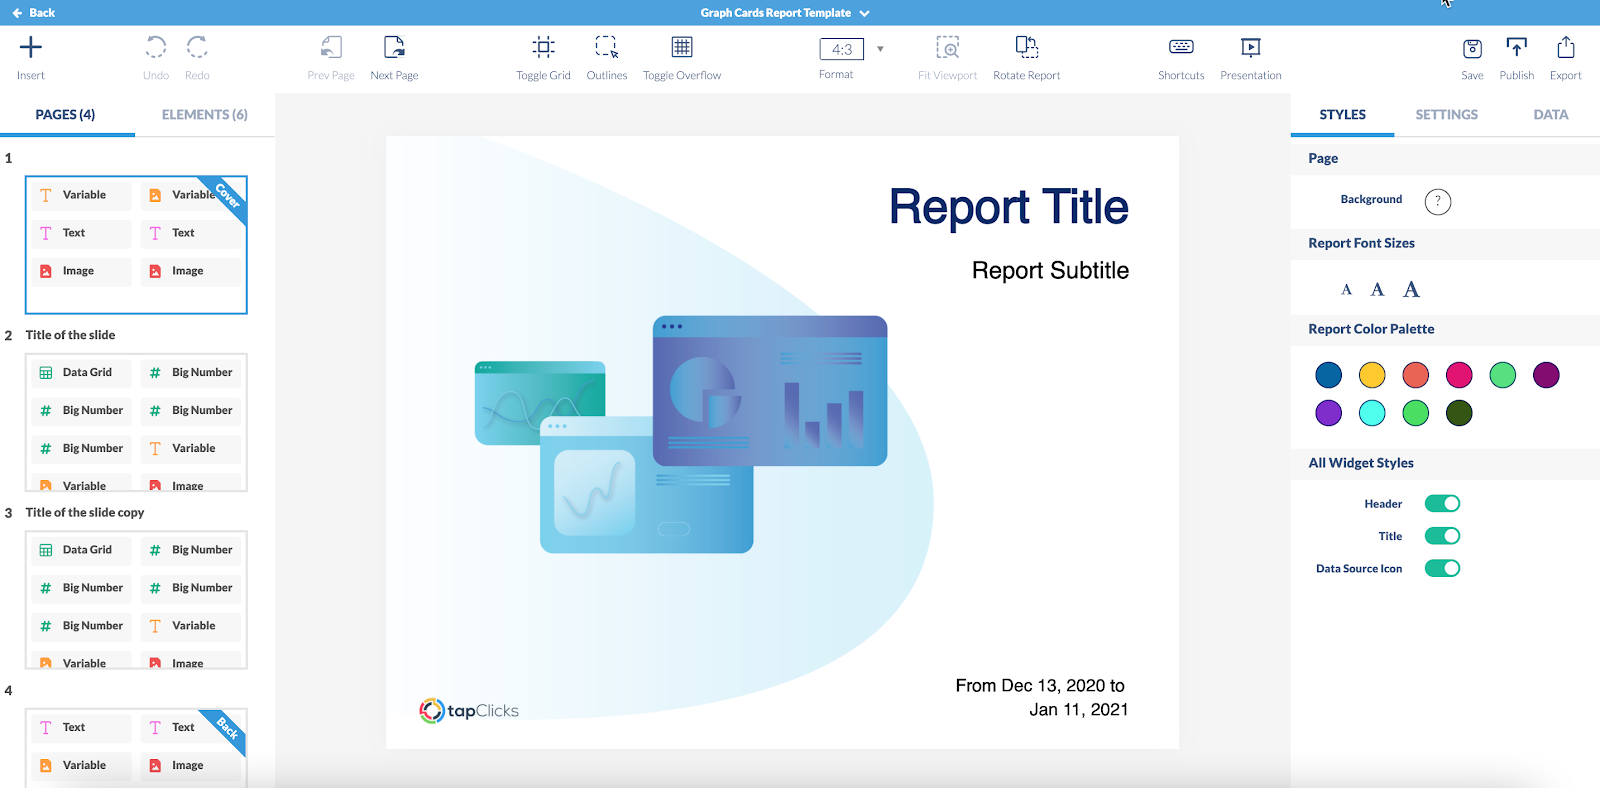
1. TapClicks
The following are five key features that make TapClicks the best alternative to Supermetrics.
Feature 1: We Pull Data from Every Source You Use
Some platforms only connect to marketing tools like Facebook or Google Ads. That doesn’t help if your team relies on traditional channels like radio, TV, or specialized DSPs.
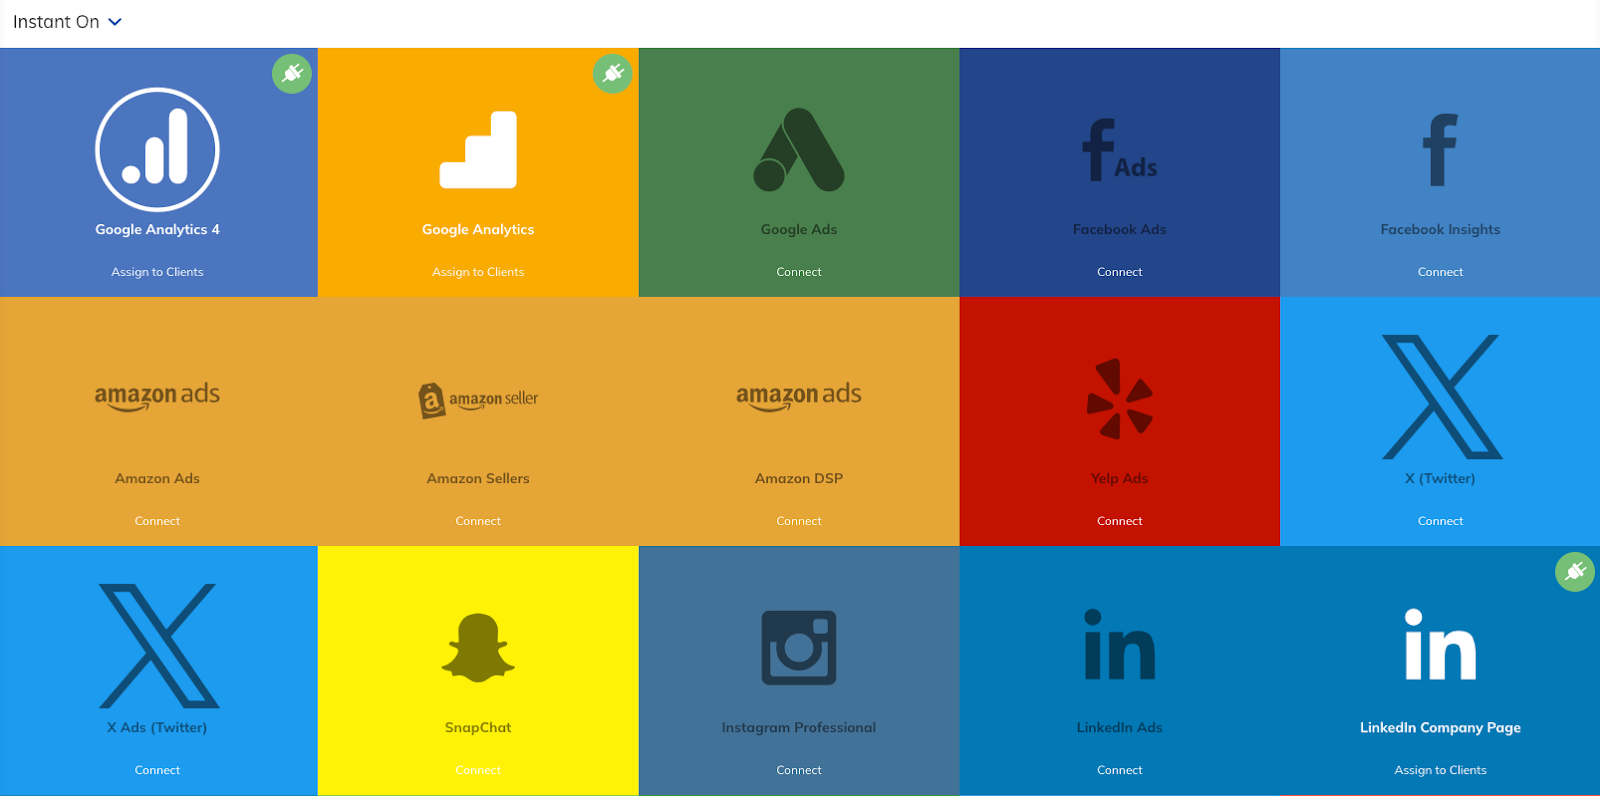
TapClicks connects to over 250 built-in marketing integrations and supports thousands of unique data sources. You can pull in data from platforms like Wide Orbit, Genius Monkey, Salesforce, Snowflake, and even custom databases.
Our Smart Connector is also the biggest time-saver, as it helps you build new connections fast, including homegrown and offline sources.
If you use TapClicks, you can access 12 months of historical data for many integrations. Refreshes happen automatically, daily or on demand. No need to manage APIs or troubleshoot connection issues. We handle that for you.
Feature 2: You Get a Permanent Data Store
Some tools only display real-time data without storing it. Losing historical insight makes it hard to compare performance across seasons or analyze growth. You shouldn’t need a technical team just to access older campaign data.
TapClicks stores all data inside a fully managed marketing data warehouse. Everything stays accessible inside the platform, no coding required. You don’t need to use another system for long-term storage or request help from IT.
When you work in TapClicks, all marketing data, past and present, lives in one place. You can run analyses, schedule reports, and build dashboards using data that never expires or disappears.
Feature 3: You Can Automate Complex Calculations
Manually calculating campaign results wastes time. You often spend hours inside spreadsheets just to calculate customer acquisition costs or total engagement across platforms.
TapClicks eliminates those steps. You can define custom metrics, automate logic, and apply everything across campaigns, dashboards, and clients. Create a formula once and reuse it forever.
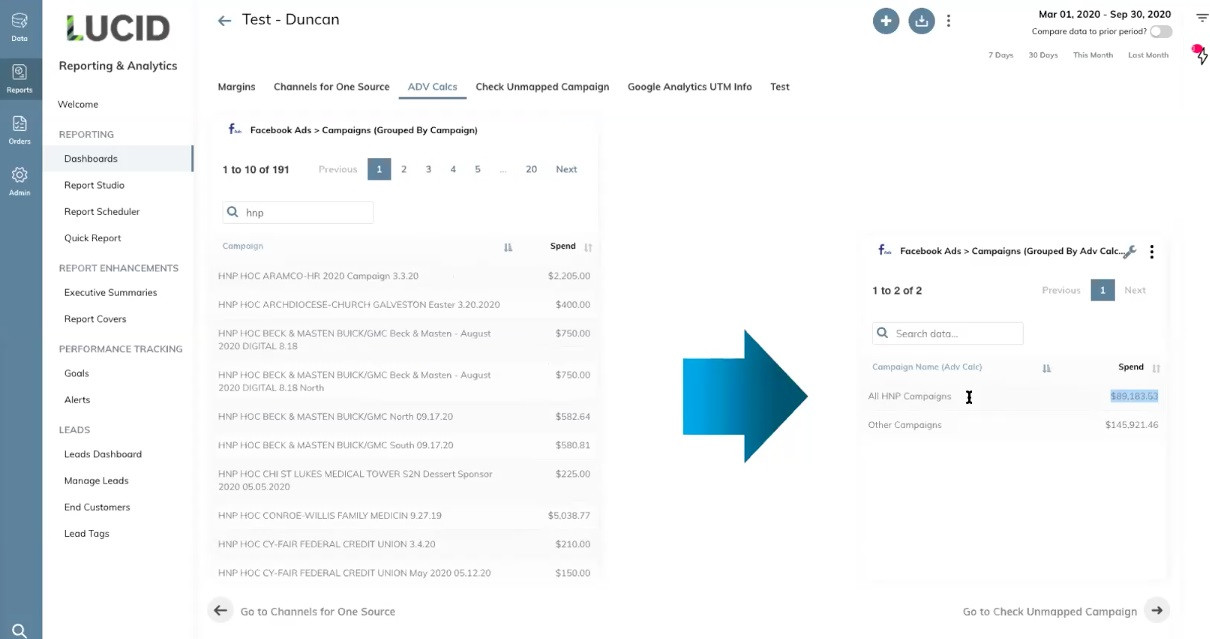
Want to combine social media engagement metrics into a single value? Define it inside TapClicks, and the platform will track it for every campaign going forward.
Further build region-specific performance calculations or brand-level breakdowns using keywords in campaign names. Set the logic, and TapClicks applies it to every dashboard and report instantly.
Feature 4: You Can Scale Custom Dashboards to All Clients Instantly
Updating dashboards one by one creates major roadblocks for growing teams. Making the same change for dozens or hundreds of clients drains your time and introduces risk.
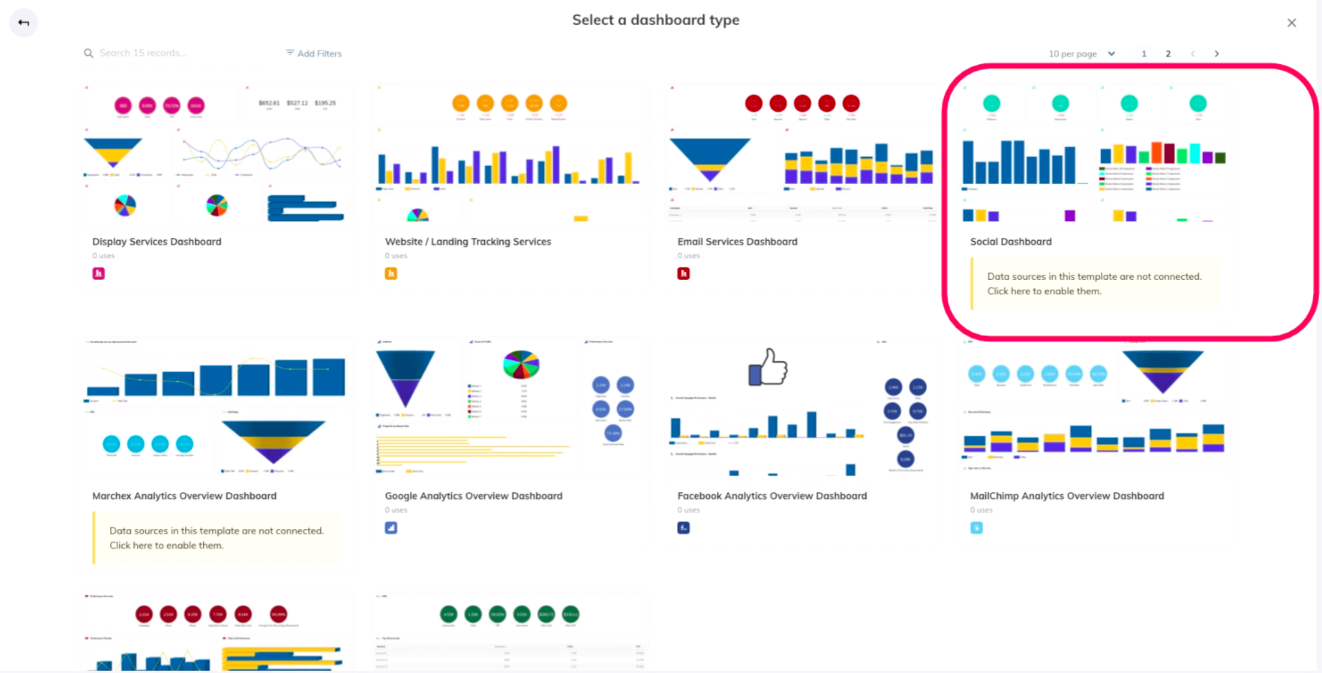
With TapClicks, each dashboard acts as a template. Build it once, apply it to every client, and manage changes globally.
Add a new Facebook Ads widget or update a report filter, and that update rolls out to every assigned dashboard. Adjust settings for individual clients when needed using simple checkboxes and filters.
Use our templates as a starting point or create your own from scratch. Every widget and metric remains flexible and scalable. No limits on dashboards or client accounts.
Feature 5: Reports Automatically Update with the Latest Data
Building monthly reports by copying dashboard screenshots wastes valuable hours. Many teams still paste metrics into slide decks manually, repeating the same task again and again.
TapClicks ReportStudio solves that. Reports populate automatically with live metrics from your dashboards.
Use one of our templates or create your own white-label version. Download in PDF, PPT, or CSV format and schedule delivery daily, weekly, or monthly.
Include only the metrics each audience needs by setting report-level and widget-level permissions. Set everything up once. TapClicks keeps reports updated and sends them out based on your schedule.
2. Power My Analytics
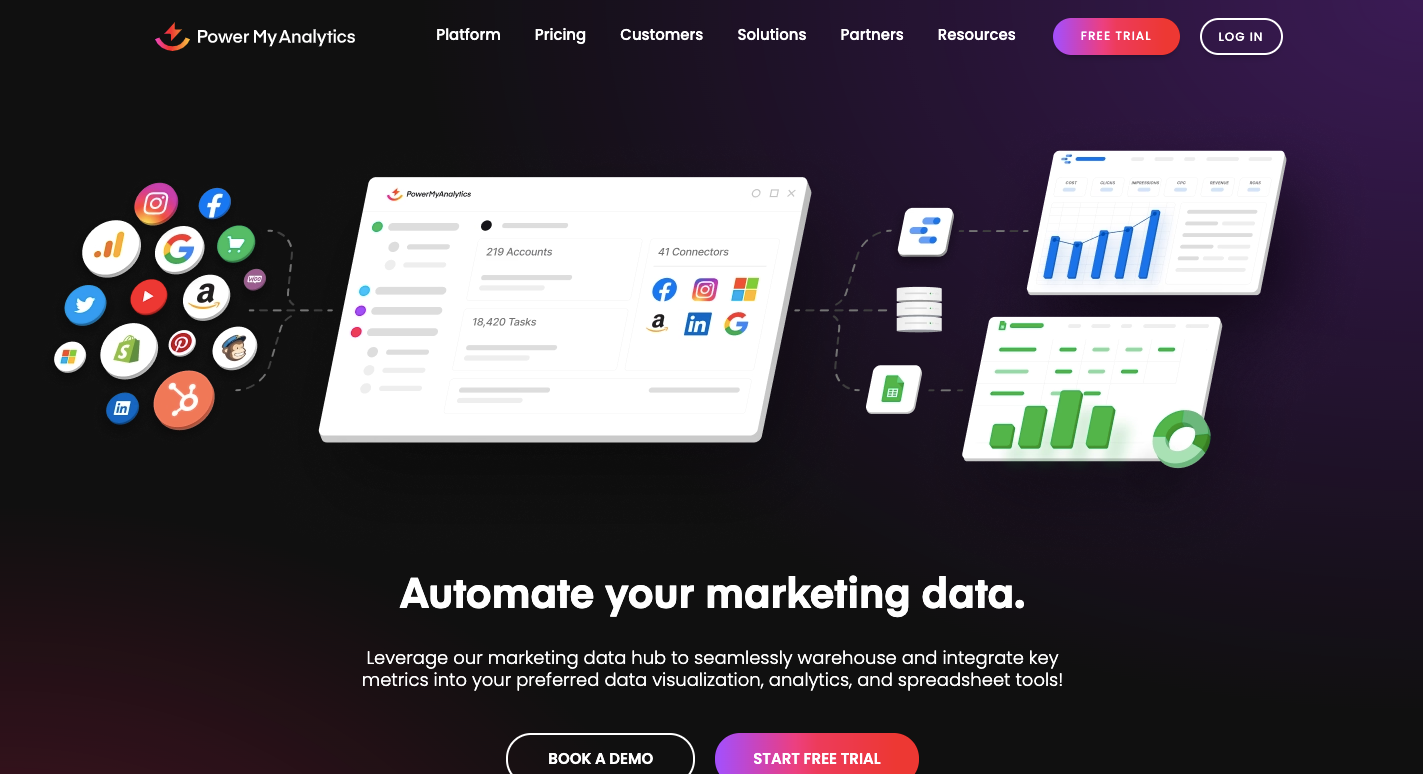
Image Source: powermyanalytics.com
Power My Analytics (PMA) is a data integration platform that gives you a way to manage reporting if your focus is on the essentials.
You can pull data from over 40 marketing data sources like Google Analytics, Facebook Ads, LinkedIn Ads, and HubSpot. From there, you can send it directly to Google Data Studio, Sheets, Excel, BigQuery, or MySQL.
Compared to Supermetrics, PMA keeps things easier to set up and use. You won’t need a technical background to get started, and support responds quickly. But if you’re working with many platforms or need complicated reporting logic, you’ll start to feel the limits.
PMA supports fewer data sources, which could matter if you’re managing multiple clients or specialized tools. It also doesn’t integrate with data visualization platforms if you have a lower plan. If your workflow depends on those, you’ll need another alternative.
Advanced capabilities like data normalization, data blending, and deeper data manipulations are also not included. Supermetrics handles all of that better. Yet, if you care more about speed, PMA helps you get reports out faster without overcomplicating things.
Features
-
Automated data integration - Connects directly to ad platforms, CRMs, ecommerce tools, and social media.
-
Data warehousing - Stores data in encrypted environments, improving load times and protecting against API interruptions. A personal data warehouse option is available on the Enterprise plan.
-
Data visualization - Includes pre-built dashboards in Sheets and Google Data Studio, with options to adjust layouts.
-
Reporting and analytics - Allows you to build scheduled reports, analyze trends, and compare campaign results.
-
Multiple data sources - Covers Google Ads, Facebook Ads, Mailchimp, LinkedIn, HubSpot, and more.
-
Data import/export - Lets you move files easily between Sheets, Excel, BigQuery, and MySQL. Note that Excel and BigQuery exports require purchasing add-ons.
-
Custom dashboards and reports - Let you apply filters, remap fields, and tailor outputs to client needs.
-
Data builder - Creates unified datasets and gives you access to more focused data analytics.
Pricing
The Single plan starts at $14.95 per month. Business costs $39.95 per month, Pro is $99.95 per month, and Enterprise is $295 per month.
3. Whatagraph
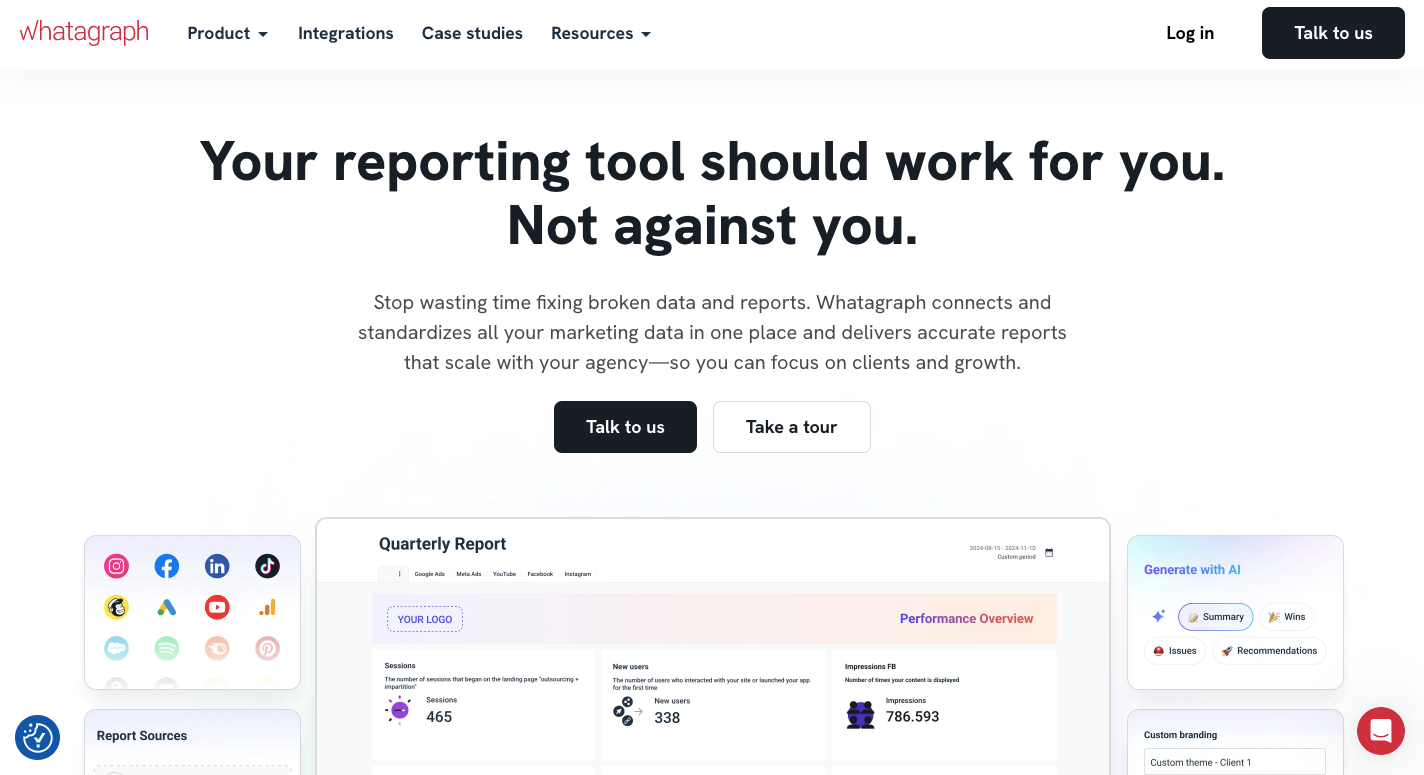
Image Source: whatagraph.com
If you’re building reports for clients or stakeholders and need something easy to use, Whatagraph can save you time. You can connect to over 55 native marketing data sources like Facebook Ads, LinkedIn, Shopify, and others, with options to build custom connectors or export data to BigQuery or Google Sheets for unsupported sources.
Unlike Supermetrics, Whatagraph keeps you inside its platform and doesn’t integrate with data visualization tools outside of its own system. That might work well if your reports stay simple, but you may feel boxed in if you need outside integrations.
Whatagraph also includes some basic data transformation features. These include data aggregation and custom formulas to combine data from multiple platforms without coding.
Supermetrics, in comparison, handles more advanced logic and data management features across larger datasets. Still, if your team needs to visualize data quickly, share live dashboards, and reduce manual steps, Whatagraph makes that easier.
Features
-
Data connectors - Pulls performance data directly from Facebook Ads, LinkedIn, Shopify, and other sources.
-
Data aggregation and transformation - Combines data from multiple platforms without code.
-
Data warehouse integration - Transfers reports into platforms like BigQuery for long-term access.
-
Pre-made widgets and templates - Speed up report creation with ready-to-use layouts.
-
Drag-and-drop report builder - Gives you control over layout, text, and metrics without technical steps.
-
Cross-channel reporting - Lets you blend multiple marketing channels into one view.
-
White-label reporting - Customizes reports with logos, brand colors, and company details.
-
Live dashboard sharing - Shares dashboards in real-time with clients or team members.
-
Report automation - Sends scheduled reports without needing manual exports.
-
Goal tracking and insights - Tracks performance goals and surfaces insights for better decisions.
Pricing
Whatagraph doesn’t list its pricing publicly.
4. Funnel
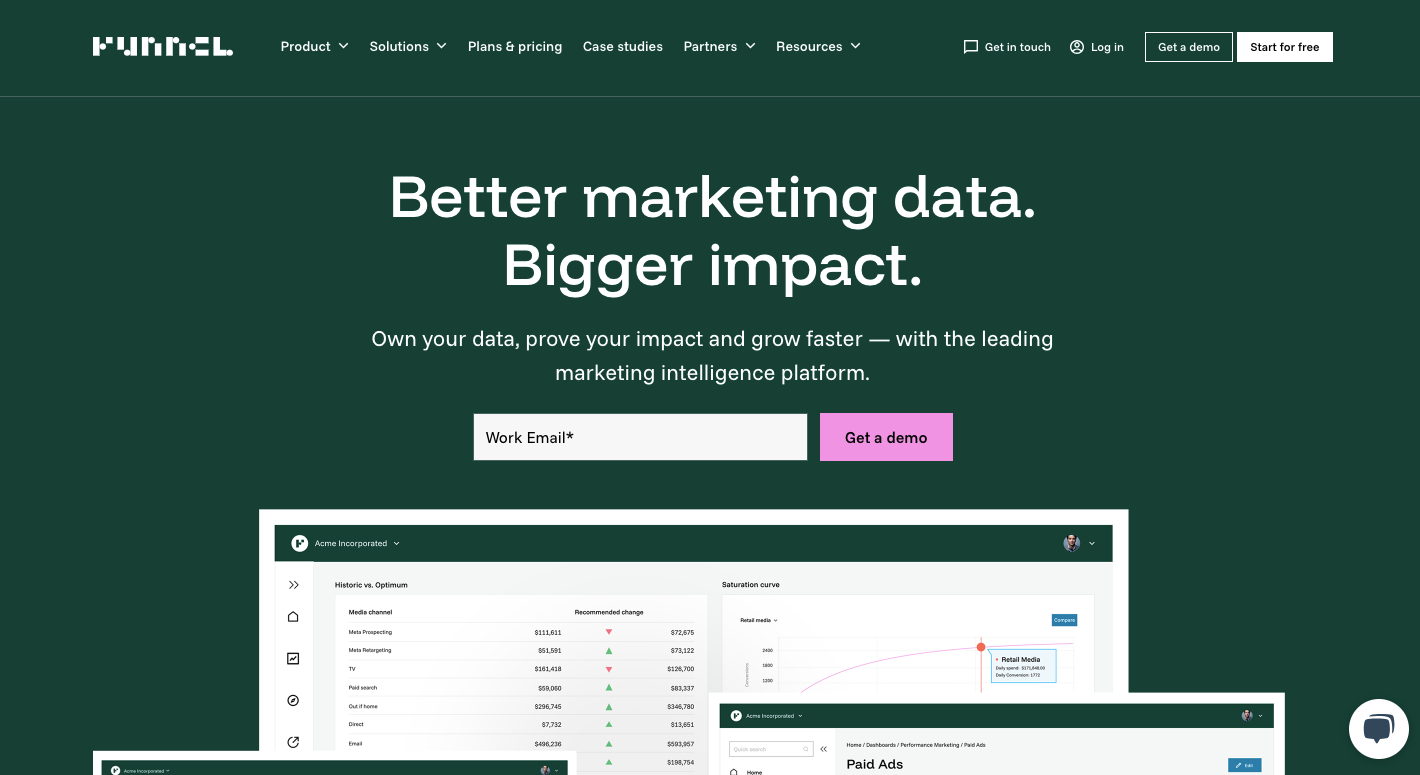
Image Source: funnel.io
Funnel helps you bring together data from hundreds of sources and shape it into reports that actually make sense. If you’re working across multiple data sources, it acts as a central hub for your marketing data, so you could organize and automate how information flows.
Supermetrics handles basic exports and templates well, but Funnel offers wider coverage and deeper controls. You can push reports to Sheets, Tableau, or BI tools, and sync everything with your data warehouses like BigQuery or Snowflake.
The platform further collects data from over 500 integrations. Some connectors are built for specific customers, and you can request custom data connectors if you need more. Funnel even has an in-house team that builds custom connectors for Business and Enterprise plans.
If you value consolidated data, adaptable setups, and deeper control over structure, Funnel stands out. You’ll spend more time configuring sources than with a basic reporting tool, but once it’s running, it delivers consistency across various marketing platforms.
Features
-
Data connectors – Over 500 integrations, including Google Analytics, CRMs, ecommerce, and ad platforms
-
Data transformation – Clean and format data using custom rules, calculations, and grouping.
-
Data warehouses – Store data in BigQuery, Snowflake (available only on the Enterprise plan), or other storage tools for long-term use.
-
Reporting tool – Build automated reports with scheduled delivery, filters, and branding.
-
Real-time sync – Keeps dashboards current by syncing incoming data regularly.
-
White-label reporting – Customize report visuals to reflect your agency or brand.
-
AI-powered insights – Includes attribution modeling, MMM, and incrementality testing.
-
Custom connector support – Lets you request custom data connectors when default ones don’t fit.
Pricing
Funnel does not publish prices online. But it has a free plan that includes four connectors.
5. Adverity
Image Source: adverity.com
Adverity gives you more control over how you handle marketing data, especially if you’re working across several platforms. It automates data collection, transformation, quality checks, and export workflows. That’s a major upgrade if you’ve hit limits with tools like Supermetrics.
Where Supermetrics focuses on ease and templates, Adverity puts customization first. You can apply rules, blend sources, and validate inputs to maintain data accuracy across every channel.
The platform has over 600 data connectors, including core and premium connectors, with access depending on your plan. It also offers the use of an AI-powered data transformation co-pilot to simplify complex data tasks.
If your priority is control over how data flows, how clean it is, and where it goes, Adverity gives you more depth than Supermetrics.
Features
-
Connect to various data sources – Has over 600 data connectors, covering ad tools, CRMs, ecommerce, and more.
-
Data transformation – Provides no-code and advanced config tools (Python, regex) to shape reports.
-
Automated data operations – Schedules regular syncs, transformations, and exports.
-
Data blending – Merges different platforms into unified datasets.
-
Data accuracy – Tracks quality KPIs and alerts you to issues in real time.
-
AI features – Includes Agentic AI for mapping and data conversations for direct questions.
-
Data conversations – Helps you explore data by asking natural language questions.
-
Destination support – Sends structured data to BI tools, spreadsheets, and warehouses.
-
Custom monitors – Add rules based on your internal metrics and requirements.
Pricing
Adverity doesn’t list pricing publicly.
6. Fivetran
Image Source: fivetran.com
If you’re looking for an automated data movement platform for your complex data workflows, Fivetran gives you serious backend control. You won’t need to manage scripts or schedule manual updates. Once it’s connected, Fivetran does the pulling, formatting, and delivering of data where you need it.
You’ll find over 700 native connectors, but what sets Fivetran apart is how it handles transformations. You can pick between transformations for dbt core scheduled in Fivetran or in code, and quickstart data models available in beta, which makes modeling more efficient if you’re already using dbt.
Unlike Supermetrics, Fivetran doesn’t send data straight to BI tools. Instead, it moves everything into a warehouse first. That adds flexibility, but also means more setup work.
If you’re not familiar with SQL or dbt, you’ll quickly notice it has a steep learning curve.
Features
-
Extensive connectors – Gives you access to 700+ integrations, covering databases, SaaS apps, analytics tools, and file storage.
-
Data transformation – Automates schema mapping, version control, and logic for in-warehouse modeling.
-
Low-impact syncs – Syncs happen incrementally, so your systems stay responsive.
-
Data security and control – Includes SOC 2 Type II and ISO 27001 certifications, along with column hashing, role-based access control, and enterprise-grade monitoring.
-
REST API – Lets you automate connector setup, permissions, and sync jobs.
-
Pre-built data models – Saves you time building metrics from scratch.
-
Granular access – Lets you manage roles and permissions per data source.
-
SLAs and alerts – Guarantees delivery timelines and flags errors or schema issues.
-
Reliable uptime – Keeps data flowing with enterprise-grade monitoring.
Pricing
Fivetran doesn’t list pricing publicly, but it offers a free trial across all plans.
7. Stitch
Image Source: stitchdata.com
Stitch lets you move raw data from different platforms into your warehouse. If you’re working with multiple tools and want full control over how data travels to your destination, it helps you automate everything. It supports over 140 native connectors and works well for engineering-driven teams.
Unlike Supermetrics, Stitch focuses on backend workflows instead of ready-to-use dashboards. You won’t find pre-built templates or direct connections to Looker Studio or Power BI.
Stitch sends data to destinations like Redshift, BigQuery, and Snowflake for further modeling. That works well if you’re a data analysts who want to prep numbers before presenting them elsewhere.
Stitch does offer data transformation support, but only minimal built-in transformations, such as data typing and JSON flattening. Advanced transformations require Talend, its parent platform, which adds more setup work, especially if you’re not already using Talend.
If you’re technical or work with engineers, Stitch gives you orchestration tools, schema control, and alert systems that help you manage the full pipeline.
For hands-on teams who want to control every step from sync to schema, Stitch builds a solid path, though you’ll need some time and technical skill to make the most of it.
Features
-
Connector coverage – Offers over 140 native connectors across SaaS apps, CRMs, analytics platforms, and databases.
-
Cloud warehouse support – Works with Snowflake, Redshift, BigQuery, and other storage options.
-
Automated syncing – Keeps your pipelines current with scheduled refreshes and issue detection.
-
Schema management – Automatically adjusts tables and fields as source systems evolve.
-
Data transformation – Offers cleansing and modeling support through Talend integrations.
-
Data replication – Moves source data into a unified location for analysis and reporting.
-
Pipeline orchestration – Lets you manage pipeline status, scheduling, error logs, and webhooks.
-
Security – Supports HIPAA compliance, SOC 2 certification, and encrypted connections.
Pricing
Stitch’s Standard plan starts at $100 per month. The Advanced plan is priced at $1,250 per month, and Premium begins at $2,500 per month, based on features, sync frequency, and support level.
8. Apipheny
Image Source: apipheny.io
Apipheny is a Google Sheets add-on that works well if you’re looking for a lightweight Supermetrics alternative.
If your goal is to pull data from APIs straight into your spreadsheet without writing code, Apipheny gives you that control. You won’t need to rely on preset connectors, just paste your API details and go.
Supermetrics focuses on plug-and-play integration, but it limits you to predefined sources. Apipheny opens things up. You can connect to nearly any platform that offers an API and only import data to Google Sheets. That keeps your workflow simple but effective.
The setup feels technical at first, especially if you’re not familiar with APIs. But once you’re in, Apipheny supports automation, pagination, and even POST requests. You can run reports, refresh data on a schedule, and stack multiple API calls in one command.
Features
-
API integration – Connects to any REST API using GET or POST methods, with support for JSON and CSV.
-
Data automation – Schedule refreshes by hour, day, or week to avoid manual updates.
-
Cell referencing – Use cell values to dynamically update API requests.
-
URL stacking – Combine multiple API endpoints in one call and load them into separate sheets.
-
Pagination support – Retrieves all pages of API results automatically, including cursor, offset, and page number types.
-
Custom functions – Insert API results directly into any cell using =APIPHENY().
-
No code setup – Simplifies the API connection process with a user-friendly interface.
-
Organized output – Keeps data separated by endpoint or group for cleaner dashboards.
Pricing
Apipheny offers a free plan with limited access. Paid plans start at $10 per month per seat for Hobby, $15 per month for Pro, and $29 per month for Business. There’s also a one-time lifetime deal for $499.
9. Improvado
Image Source: improvado.io
If your team needs a platform that can manage every step of the reporting process, Improvado brings a complete solution. From data pulls to final dashboards, it supports every step of the marketing reporting cycle. That makes it easier to track performance across all your channels in one place.
Improvado connects to 500+ data sources, including Google Ads, CRMs, ecommerce tools, and niche platforms. You can create automated pipelines, apply custom transformation logic, and route clean data to any warehouse or dashboard.
Unlike Supermetrics, Improvado doesn’t stop at integration. It gives you granular control over how your data looks and flows.
The platform also includes raw data extraction through email and a visual monitoring system that helps you catch issues early. You’ll gain more data granularity and pre-built reporting models, which help speed up analysis and reduce prep time.
Features
-
Extensive integrations – Pulls data from 500+ sources, including ads, analytics, CRMs, ecommerce, and social platforms.
-
Custom data connectors – Let you pull in platform-specific datasets not supported by default.
-
Unlimited accounts – Works well for agencies or multi-brand companies needing cross-account access.
-
Data transformation – Cleans, maps, and unifies fields using advanced recipes.
-
Adaptable storage – Supports multiple data storage options, including Redshift, BigQuery, and on-prem setups.
-
Governance features – Alerts on compliance issues, data drops, or metric shifts.
-
AI insights – Offers smart suggestions based on anomalies or campaign trends.
Pricing
Improvado pricing details are not publicly available. The cost depends on your data volume, connector usage, and team size.
10. Windsor.ai
Image Source: windsor.ai
Windsor.ai lets you track customer journeys, assign credit to each channel, and measure performance in one unified view. That means less manual sorting and more time focusing on what’s working.
Compared to Supermetrics, Windsor.ai gives you more freedom in how you set up your connections. You can run multiple accounts per source, which is great if you manage several brands or clients. The platform helps you connect data from over 325 marketing and CRM tools.
Windsor.ai further supports integrations with tools like Google Sheets, Power BI, Tableau, and Looker Studio. It works well for marketers who want both attribution modeling and ELT automation.
If you need daily syncs, automated reports, and fast results without complexity, Windsor.ai makes that easier for you.
Features
-
Data integration and ELT – Pull from 325+ platforms and automate formatting with no code.
-
Attribution modeling – Track conversions across touchpoints and find what drives revenue.
-
Dashboards – Customize reports inside Google Sheets, Excel, or BI platforms.
-
Fast reporting – Schedule daily data updates, so your insights stay fresh.
-
Cross-platform analytics – Combine insights from CRM, ads, and analytics into a single source.
Pricing
Windsor.ai starts with a free plan. Paid tiers begin at $23 per month for Basic, then scale to $118 for Standard, $299 for Plus, and $598 for Professional. Enterprise plans are available with custom pricing.
11. Porter Metrics
Image Source: portermetrics.com
Porter Metrics helps you build marketing reports without code or complicated setup. If you run a small team or agency, you’ll likely appreciate how fast it connects to popular platforms like Facebook Ads, GA4, and HubSpot. All data sources are unlocked from the start, so you won’t need to upgrade just to track your full campaign set.
Unlike Supermetrics, which supports broader integrations, you can only load data to Google Sheets or Looker Studio (formerly Google Data Studio) using Porter Metrics. That works well if you want simple workflows with no need for data warehouses.
Daily or 12-hour refresh cycles keep your reports updated. You’ll also find over 100 Looker Studio templates to help you launch faster. The interface feels clean and fast, and the built-in data blending features allow you to combine performance data across platforms in one report.
Features
-
Connect to 19+ platforms - Includes support for Facebook Ads, GA4, HubSpot, Shopify, and Instagram.
-
Automated refreshes - Updates your reports every 12 hours or daily without manual effort.
-
Data blending - Merges information from multiple sources into one clear report.
-
Built-in templates - Offers over 100 pre-designed templates to speed up your report setup.
-
Data visualization - Displays your metrics using scorecards, tables, charts, funnels, and maps.
-
Google integrations - Works seamlessly with Google Sheets and Looker Studio for easy access and sharing.
-
BigQuery support - Lets you optionally migrate and store data in Google BigQuery for better performance.
-
No-code setup - Removes the need for scripts, code, or IT involvement.
-
Affiliate program - Gives users a chance to earn from referrals.
-
Responsive support - Highly rated by users for quick and helpful responses.
Pricing
The entry-level plan starts at $15 per month for one account.
Explore a Powerful Option Beyond Supermetrics With TapClicks
Managing marketing data shouldn’t involve patching together tools or spending hours on repetitive reporting.
TapClicks gives you a single platform that pulls in data from thousands of sources, stores it securely, and transforms it into ready-to-use insights.
If you’re exploring Supermetrics alternatives because you’re outgrowing its limitations, TapClicks is built for where you’re headed. You can unify campaigns across every channel, set up custom metrics once, and reuse dashboards and reports across hundreds of clients or brands.
FAQs About Supermetrics Alternative
What Supermetrics alternative offers the best data integration for marketing teams?
TapClicks offers the best data integration for marketing teams with 250+ direct connectors, Smart Connectors, and automated workflows.
Is there a free Supermetrics alternative?
Google Search Console is a free Supermetrics alternative for basic website performance tracking.
How does Supermetrics handles data mapping, transformation, and visualization?
Supermetrics offers basic data mapping and transformation but lacks advanced modeling or built-in visualization tools beyond Looker Studio integration.
Is there a Supermetrics alternative with strong analytics power and ETL tool functionality for building data pipelines?
Yes, TapClicks provides strong analytics capabilities and ETL functionality, allowing you to build scalable marketing data pipelines without coding.