
9 Marketing Analytics Techniques for Smarter Campaigns
Most marketing teams sit on large amounts of data, yet they struggle to pull out what’s useful. Numbers accumulate across reports, making it difficult to determine which marketing efforts actually drive business growth.
Marketing analytics techniques can organize that clutter. They help you spot patterns, track performance across channels, and make choices based on what your audience responds to.
With the right marketing analytics tools, you can review performance, track progress, and optimize marketing campaigns.
In this guide, we’ll break down nine of the main techniques for marketing analytics.
What Are Marketing Analytics Techniques?
Marketing analytics techniques are methods that help you examine performance across your channels.
They use information from marketing channels such as web analytics, ads, email, and social media to highlight patterns in customer behavior.
You can review key metrics, compare audiences, and spot changes in engagement across different touchpoints.
These techniques also help you read customer feedback, interpret qualitative data, and organize your customer segments.
9 Core Techniques in Marketing Analytics
Marketing analytics techniques help you understand how people respond to your marketing activities. Each method focuses on a different part of the customer journey.
Together, they help you study your target audience and see how they interact with your content across multiple channels.
1. Descriptive Analytics
Descriptive analytics helps you review past results across your marketing channels.
It highlights key performance indicators (KPIs) such as page views, email opens, conversion rates, click behavior, and activity on social media. These numbers form a snapshot of audience interest during a set period.
Marketing teams use descriptive analytics to compare one period to another. It also helps you spot early patterns in customer behavior.
You can pair it with customer surveys, web analytics, and sales data to see which topics or offers attract attention from your target audience.
How Descriptive Analytics Works in Practice
You might review historical sales data and notice a lift during a seasonal promotion. Descriptive analytics confirms the pattern. It doesn’t explain the cause, but it gives you a starting point before advanced data analysis.
Descriptive analytics help you sort results, track key metrics, and make data-driven decisions about where to focus next.
2. Inferential Analytics
Inferential analytics helps you study customer data and form assumptions about how different groups behave.
It uses multiple data sources instead of a single metric, which gives you a fuller view of your customer behavior patterns. This method helps you see why certain groups respond in different ways.
Teams often use inferential analytics when they want context behind their numbers. You can compare customer surveys, on-site feedback, and web analytics to find repeating themes.
These themes help you sort your customer segments and understand what each group values.
How Inferential Analytics Works in Practice
You might review feedback from two email lists. Subscribers who browse buying guides may request more comparison content in surveys.
Subscribers who view product pages may ask for shorter updates that highlight price changes or stock alerts.
Inferential analytics helps you see these differences so your marketing team can make data-driven decisions about future content and messaging.
3. Regression Analysis
Regression analysis helps you study how two or more variables in your marketing data relate to each other. It shows whether changes in one metric correspond to changes in another.
This method helps you review conversion rates, ad results, email engagement, or any metric that depends on another input.
Teams use regression analysis when they need more in-depth summaries. You can compare email open rates with sales data to see if higher engagement leads to more completed purchases.
You can also compare paid search clicks with web analytics to see which keywords bring visitors who view product pages or add items to a cart.
How Regression Analysis Works in Practice
Here's a concrete example. A team reviews six months of ad spend and form submissions from a lead generation program. Submissions rise during weeks when the team increases spending on high-intent keywords.
Regression analysis confirms that the rise in spend and the rise in submissions move together. It doesn't prove the reason behind the increase, but it highlights the parts of your data that need more attention.
4. Content Analysis
Content analysis helps you review qualitative data and turn it into organized findings. It draws from customer surveys, interviews, reviews, support tickets, and on-site feedback.
This method helps you understand how people describe their experiences, concerns, and expectations in their own words.
Teams rely on content analysis when they need context that numbers alone can’t provide. You can sort similar comments, compare themes across customer segments, and see which topics appear most often.
This helps you understand what influences customer satisfaction. It also helps you identify trends that may not appear in basic metrics or standard data analytics reports.
How Content Analysis Works in Practice
For example, a team reviews 100+ open-ended survey responses after a product launch. Many customers mention confusion with the setup steps. Others mention slow page load times.
Content analysis helps the team place these responses into clear categories so they can study the patterns more closely. It also shows which concerns each customer segment shares most often.
This helps your marketing team refine future messaging and gives product teams the insights needed for data-driven decision-making.
5. Predictive Analytics
Predictive marketing analytics uses past customer data to estimate how people may behave in the future.
It relies on patterns in purchase history, browsing activity, and repeated actions. This helps you see how your target audience responds to certain offers or products.
Teams use predictive analytics when they want direction for planning upcoming marketing campaigns.
You can study market trends and compare responses across different customer segments. This helps you spot early signs that may affect customer loyalty or long-term demand.
How Predictive Analytics Works in Practice
Let’s say the process starts with three years of historical data from seasonal promotions. Sales rise whenever winter accessories appear in late November email campaigns.
Predictive analytics uses that pattern to estimate demand for the upcoming season. This helps the team plan inventory, prepare content, and optimize campaigns for the period that draws the highest interest.
6. Demand Forecasting
Demand forecasting helps you estimate future demand by reviewing historical data and past campaign performance. It shows how interest rises or falls during specific months or promotional periods.
This technique helps teams plan inventory levels and adjust upcoming marketing strategies based on predictable patterns.
Teams rely on demand forecasting when timing affects results. You can compare sales trends across different customer segments and track market trends that influence buying decisions.
This helps you prepare for periods with higher orders or slower activity.
How Demand Forecasting Works in Practice
Here's an example to help you understand demand forecasting. Two years of sales data from a home goods brand show a steady rise in orders for outdoor furniture every May and June.
Demand forecasting uses this pattern to estimate how much inventory the team needs for the next season.
It also helps the marketing team plan content and schedule promotions for the months that draw the most interest.
7. Competitor Analytics
Competitor analytics helps you study how other brands promote their products, structure their offers, and communicate with their audiences.
It focuses on specific items such as pricing, product features, messaging themes, and content formats. This gives you a clearer view of how your category operates.
Teams use competitor analytics when they want to understand where they stand in the market. You can review email campaigns, blog content, and social media analytics from competing brands.
This helps you see which topics receive attention, how often certain promotions appear, and how audiences respond to different content styles.
How Competitor Analytics Works in Practice
For instance, one team reviews six months of competitor activity across blogs, email newsletters, and social posts. Several competing brands highlight free shipping in their promotions.
Competitor analytics tracks how often that message appears and how engagement changes when they feature it. These findings give you marketing insights that help shape upcoming offers and content themes.
8. Marketing Mix Modeling
Marketing mix modeling (MMM) helps you measure how different marketing inputs affect sales outcomes.
It uses historical data to study how product updates, pricing changes, promotions, and distribution channels influence results over time. MMM lets analysts review multiple factors together instead of looking at each channel separately.
Organizations use MMM when they want a deeper view of marketing performance. Analysts can compare promotional periods, pricing adjustments, and channel spend to see which elements contribute the most to sales.
This supports future marketing strategies that rely on measurable patterns rather than assumptions.
How MMM Works in Practice
Here’s an example to show how MMM functions in a real scenario. A retail group reviews two years of sales data from online and in-store channels.
Sales rise during weeks when bundle discounts appear in email campaigns and paid search spend increases at the same time.
Marketing mix modeling breaks down how much each factor contributes to the lift. It also shows whether pricing changes or promotional volume had a stronger effect, which helps the group plan next season’s priorities.
9. A/B Testing
A/B testing helps you compare two versions of a single element to see which one performs better.
Marketers often test headlines, call-to-action copy, images, landing page layouts, and email subject lines.
This technique shows how people respond to specific changes, so the marketing group can make updates with purpose.
Many organizations use A/B testing as part of a marketing analytics strategy. You can review open rates, click rates, or conversion rates to identify which option performs better.
The process also helps when you're analyzing data from different customer segments, since it shows how each group reacts to the same message.
These results give marketers actionable insights that support future content planning.
How A/B Testing Works in Practice
For example, one ecommerce brand tests two versions of an email subject line for a weekend sale. Version A uses a short product-focused message.
Version B highlights a limited-time discount. A/B testing finds that version B earns more opens and leads to more product page visits.
The marketing group uses this result to shape subject lines for upcoming campaigns.
How Marketers Apply These Techniques Across Major Marketing Channels
Marketing analytics techniques become most useful when you apply them to the channels you manage each day.
-
Social media marketing: Social platforms generate large amounts of engagement data that helps marketers study audience behavior. Some organizations use sentiment analysis to understand how people react to brand mentions or campaign themes.
-
Email marketing: Email programs provide consistent performance data for A/B testing and message refinement. Marketers often connect email activity to Google Analytics to review on-site behavior after a click. Customer segmentation also helps tailor content for readers with different levels of interest or purchasing habits.
-
Content marketing: Content channels show how readers interact with articles, guides, and product pages. Trend analysis helps identify topics with rising search interest. Some groups use digital marketing tools to review scroll depth, returning visitors, and on-page engagement.
-
Paid advertising: Paid channels offer detailed cost and conversion metrics. Regression analysis helps compare spend against results. Some organizations test advanced analytics models to study how changes in targeting or creative choices influence conversions.
These channel-specific applications help marketers understand performance at a deeper level and use data to guide everyday decisions.
Solve Data Challenges With Centralized Marketing Analytics Platforms
Marketing data often sits across several tools. This makes it harder to compare results or understand how channels relate to each other.
A centralized analytics platform brings this information together so marketers can review it without switching between systems. This list outlines the main challenges and how a central hub solves them.
-
Data spreads across email platforms, ad accounts, and customer relationship management (CRM) systems. A centralized platform integrates data from these sources so you can review it in one place.
-
Manual exports create inconsistent reports. Automated updates in a central hub improve data quality and remove repeated steps.
-
Metrics vary across tools, which complicates comparisons. A unified view organizes results in the same structure so channels can be evaluated side by side.
-
Important patterns stay hidden when data sits in separate systems. A central hub helps marketers uncover actionable insights that guide planning.
Large organizations rely on business intelligence platforms and marketing data warehouses for deeper analysis.
A centralized platform such as TapClicks supports these systems by sending clean, organized data into them.
Book a demo now and learn how TapClicks can help you view all your data in a single dashboard!
How TapClicks Supports Advanced Marketing Analytics Techniques
TapClicks helps marketers study performance and apply advanced techniques without switching tools. Each module supports a different part of the analytics process.
Together, they create a system that helps organizations use their data with more structure and fewer gaps.
Build Your Data Foundation With TapData
TapData serves as the platform’s data pipeline. It connects to hundreds of sources and accepts custom API feeds. The Transformation Hub organizes names, prepares metrics, and handles complex calculations.
Historical records help you compare long-term changes and spot early signals related to future trends.
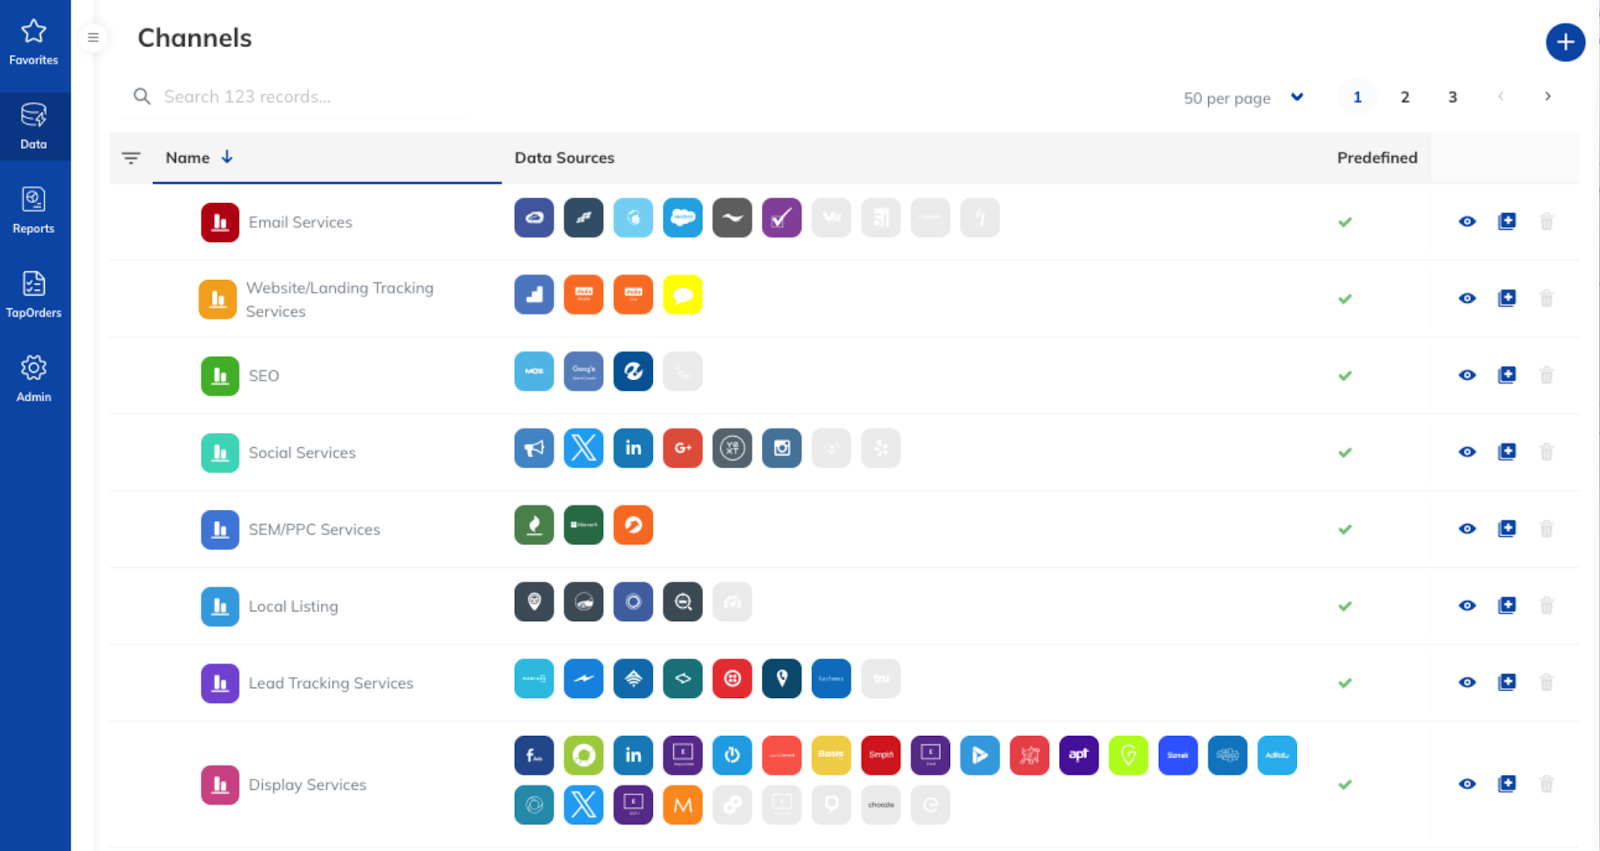
These functions support reliable data collection and strong data integration. TapData also connects to CRM systems, ad platforms, and marketing automation tools.
This gives you a consistent source when you apply regression analysis and other advanced techniques.
Analyze Cross-Channel Performance With TapAnalytics
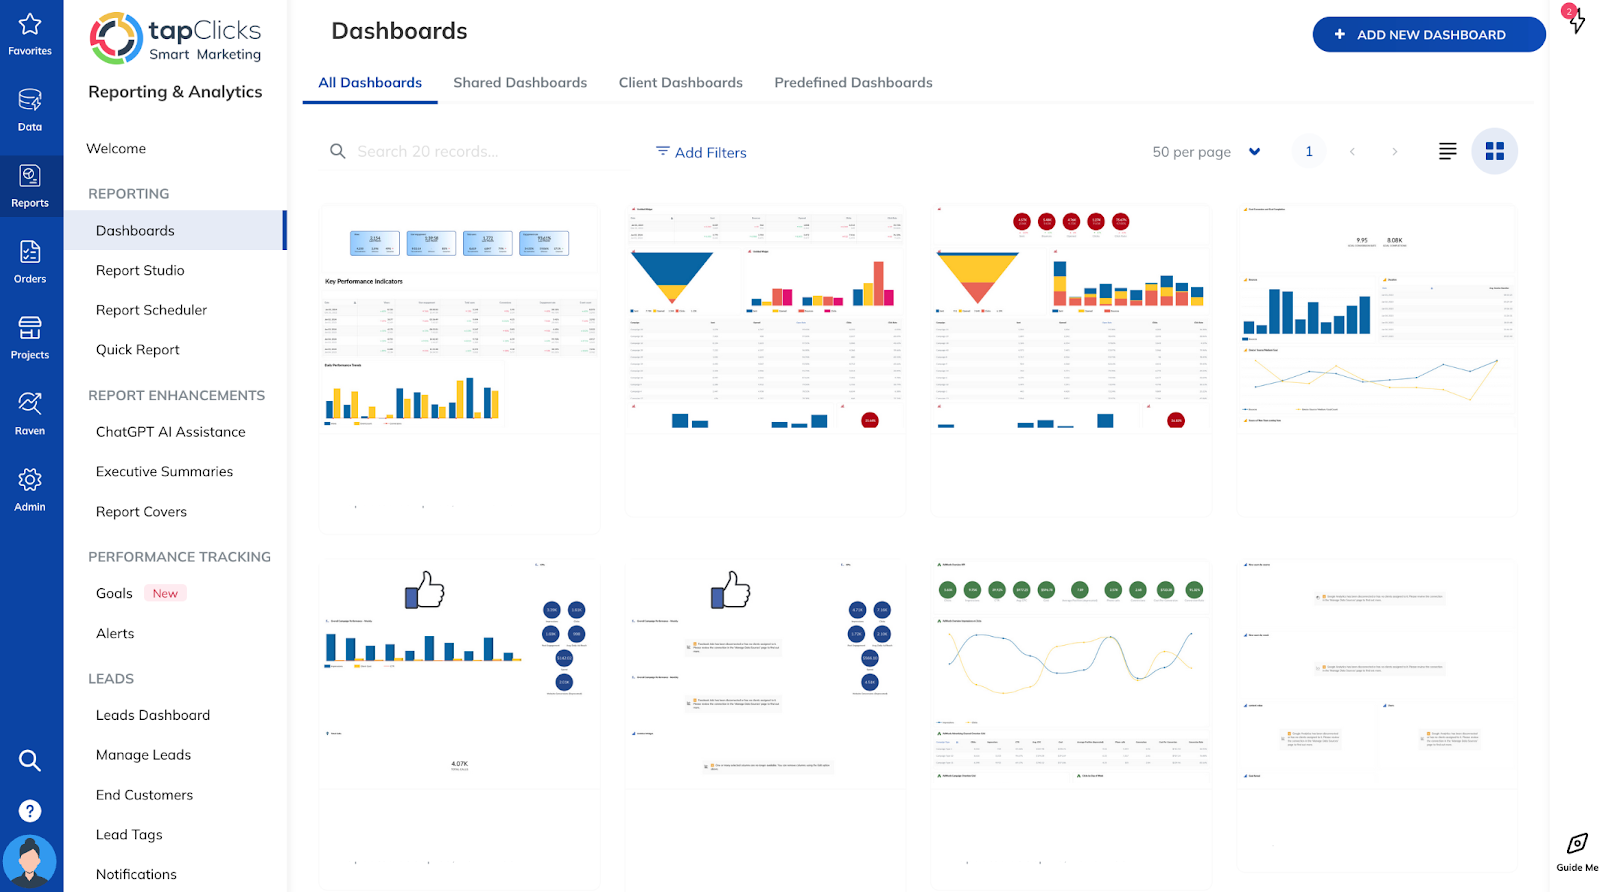
TapAnalytics provides interactive dashboards that update as new data enters the platform.
Users build custom channel views and group matching campaigns across networks. They can also apply cost logic to compare spend and conversions.
Data lookups attach attributes such as region or customer tier.
These tools support segmentation, regression analysis, and marketing mix modeling. You can also track customer lifetime value and review market size analytics when examining long-term performance.
Streamline Reporting With TapReports
TapReports prepares reports and sends updates on a set schedule. Report Studio supports slide-based summaries with templates and custom widgets.
Interactive dashboards inside TapReports update automatically when connected sources change.
These functions help marketing executives review results quickly. You also benefit from a consistent reporting structure for quarterly and yearly comparisons.
Manage Campaign Execution With TapOrders and TapWorkflow
TapOrders records campaign requests and keeps inputs consistent. TapWorkflow assigns tasks, manages approvals, and stores communication in one system.
Together, they link planning and execution with the performance data that later appears in TapAnalytics.
This connection supports a solid marketing strategy. You can gain context by seeing the decisions behind each campaign.
FAQs About Marketing Analytics Techniques
What are the four types of analytical methods?
The four main analytical methods are descriptive, diagnostic, predictive, and prescriptive. Descriptive methods explain what happened. Diagnostic methods explore why it happened.
Predictive methods estimate what may happen next. Prescriptive methods outline possible steps based on those estimates.
What are the five Cs of marketing analysis?
The five Cs are Company, Customers, Competitors, Collaborators, and Context. This framework helps marketers study their position in the market. It also helps identify areas where they may gain a competitive advantage.
What is the 3-3-3 rule in marketing?
The 3-3-3 rule helps marketers judge whether a message can hold attention at three levels. It should capture interest in 3 seconds, engage someone for 3 minutes, and drive action in the next 3 days.
This helps small businesses build interest as prospects learn more about a product or service.