
8 AI Reporting Tools That Make Data Analysis Easy
Manual reporting wastes time. You dig through spreadsheets, clean raw data, and format charts only to explain results that should’ve been obvious. It slows down your team and your decisions.
That’s why more business users are switching to AI reporting tools. These platforms automate the reporting process, pulling from live dashboards and generating shareable reports.
In this article, you’ll see eight reporting tools that help you make data-driven decisions, and some AI agents examples from TapClicks.
Book a demo with TapClicks to create consistent, accurate, and structured reports for every client.
1. TapClicks
TapClicks lets you connect data from everywhere and turn it into actionable insights. We’re especially strong in marketing reporting, as we bring clarity to complex data sets and give you professional-looking reports in just a few clicks.
And TapClicks doesn’t stop at what’s already happened. Our agents are built to surface problems early, find new patterns, and even predict future outcomes.
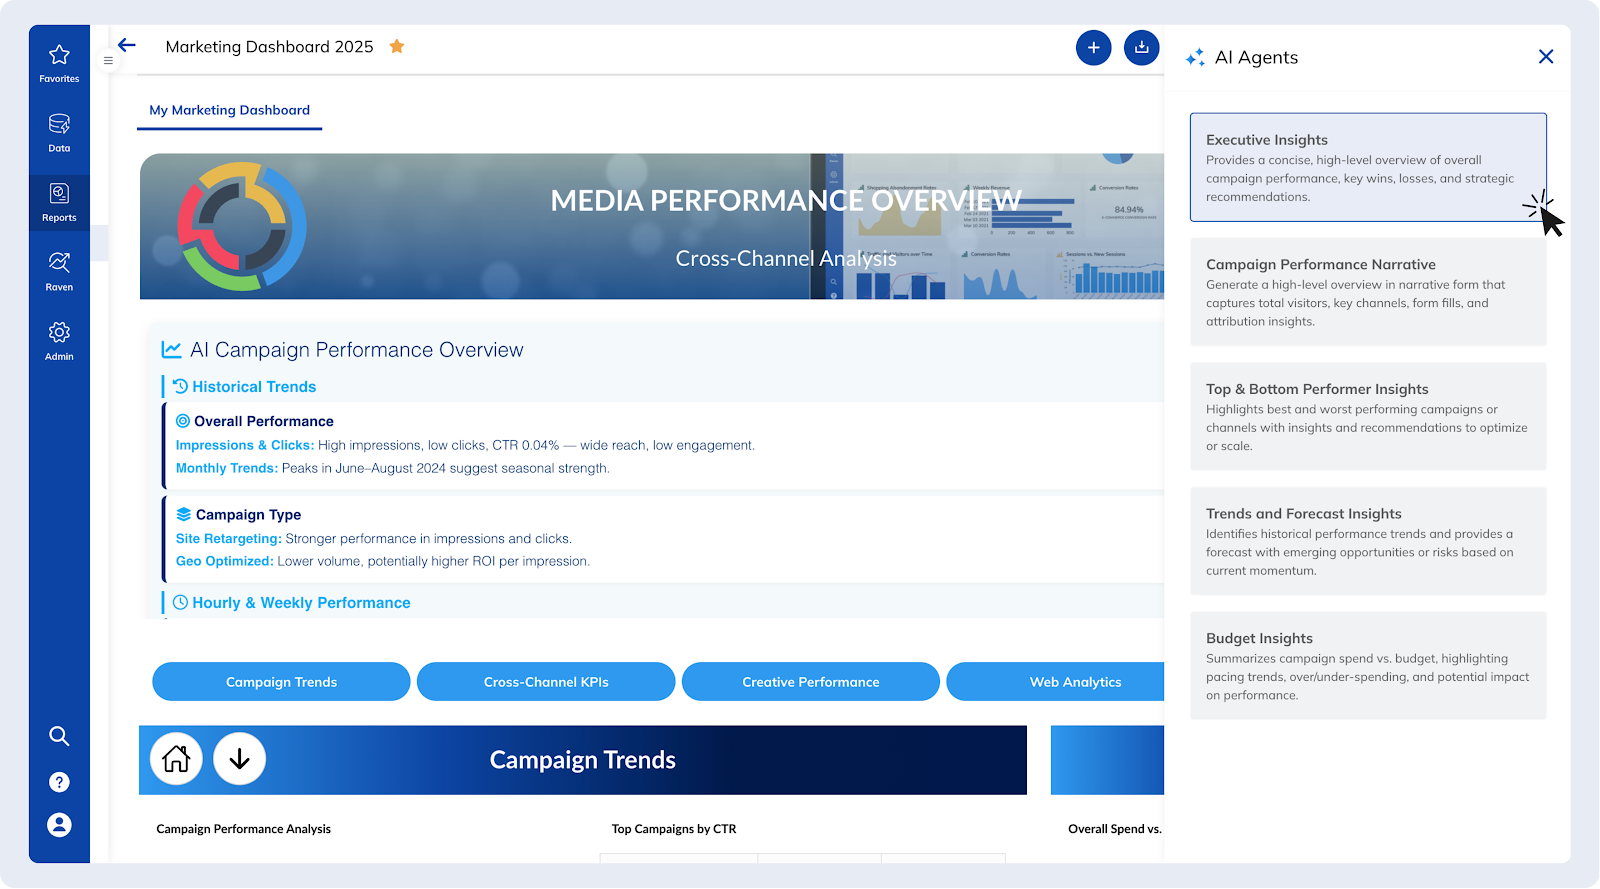
Executive Insights Agent
Executive Insights Agent scans all your integrated platforms, like social, search, and display, and generates high-level summaries. You get narrative context explaining what changed, how it affects performance, and what next steps make sense.
There’s no need to dig through dashboards or build slide decks. It packages cross-channel data into digestible insights, perfect for sharing with clients or internal teams.
Campaign Performance Agent
Campaign Performance Agent goes deeper into individual campaign execution. It tracks metrics across every platform and ties them together to create a complete performance story. Instead of guessing why click-through rates dropped or conversions spiked, you’ll see exactly what caused it.
The agent also works in real-time. That means no more waiting until the end of a marketing campaign to analyze results. You can spot trends while there’s still time to reallocate your budget or refine the creative.
Top and Bottom Performer Insights Agent
Every campaign has outliers, but figuring out why can take hours. Top and Bottom Performer Insights Agent ranks your top-performing creatives, channels, and audiences, then does the same for the lowest.
It breaks down engagement, conversion, and spend to explain what’s working and what’s falling flat. Want to cut waste? This agent helps you do it. Need to scale what’s working? It points the way.
Trends and Forecast Insights Agent
TapClicks combines current performance with historical patterns to map out what’s next. Trends and Forecast Insights Agent uses existing data to highlight where momentum is building and where you might hit a slowdown.
That’s especially helpful during seasonal changes or pre-launch planning.
Budget Insights Agent
Your budgets can drift, as it’s easy to underspend on high-opportunity campaigns or blow your allocation on tactics that don’t move the needle. Budget Insights Agent watches spend levels in real time and alerts you when you’re pacing too fast or too slow.
Besides that, it ties spending back to performance so you know exactly what your dollars are doing. It helps you stay efficient, avoid surprises, and connect budget decisions to actual outcomes.
Build-Your-Own Agent
Do you have unique metrics or workflows? You can design a custom AI agent that mirrors your strategy and reporting style. No coding or developers are needed.
2. HubSpot
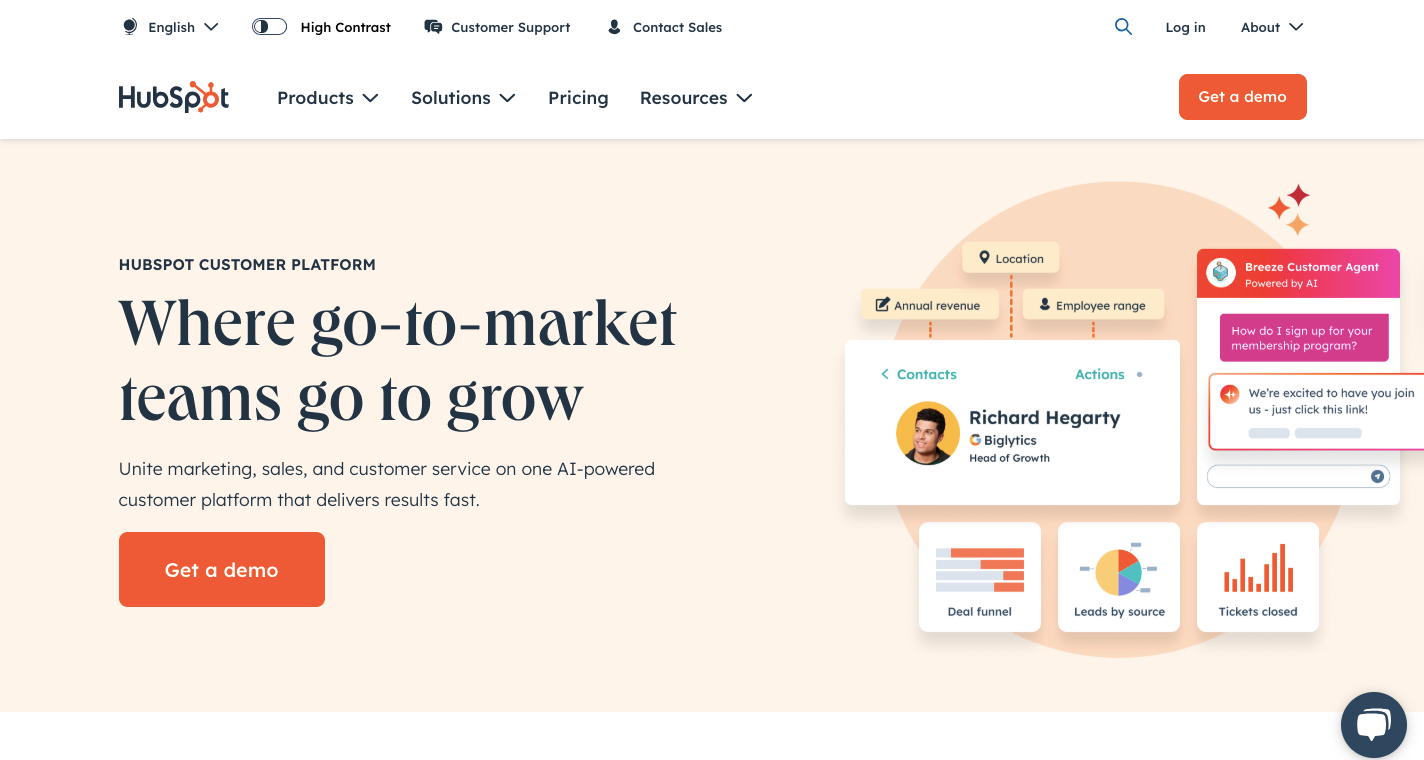
Image Source: hubspot.com
HubSpot brings your marketing, sales, service, and operations into one system. More importantly, it makes that system functional for teams that don’t want to dig through disconnected tools.
Everything starts with its CRM. That’s where customer data, conversations, and campaign activity come together. You’ll also see smarter workflows, content suggestions, sales triggers, and reporting automation that save time across your entire team.
The reporting features even go beyond the basics. You can build detailed performance snapshots, track sales metrics, and even use AI-generated reports to surface the data that matters most.
Other than that, HubSpot is transparent about how this works: it logs and stores your prompts, generated language, and usage metrics when you use AI tools inside the platform. That’s something to keep in mind if data governance is a priority.
You further have access to tools powered by artificial intelligence to build complex reports, automate lead tracking, and run predictive analytics.
Features
HubSpot includes AI across all its hubs, such as:
-
AI content assistant – Drafts email copy, blog posts, and social captions based on custom prompts.
-
AI-powered forms – Helps boost sign-ups by improving autofill and optimizing layout fields.
-
Content remix – Converts top-performing content into fresh assets for other channels.
-
AI forecasting – Uses CRM history and engagement trends to predict future outcomes.
-
Sales prospecting agent – Automates follow-ups and lead routing to reduce manual work.
-
AI-powered reports – Creates clean, actionable dashboards with fewer clicks.
-
AI customer agent – Handles common support requests so teams can focus on complex issues.
-
HubSpot breeze – Automates tasks like sending reports, scoring leads, or assigning tickets.
-
AI messaging insights – Tracks how your team communicates and where improvements can be made.
-
Smart CRM suggestions – Uses performance patterns to guide your marketing strategies in real time.
Pricing
HubSpot’s pricing is tiered. The Professional Marketing Hub starts at $900 per month and includes three core user seats, with more available at $45 per month each.
For teams that want advanced performance analysis, the Enterprise plan starts at $3,800 per month and unlocks features like multi-touch attribution, team access control, and AI-powered social inbox insights. Additional seats on this tier cost $75 per month.
3. Klipfolio
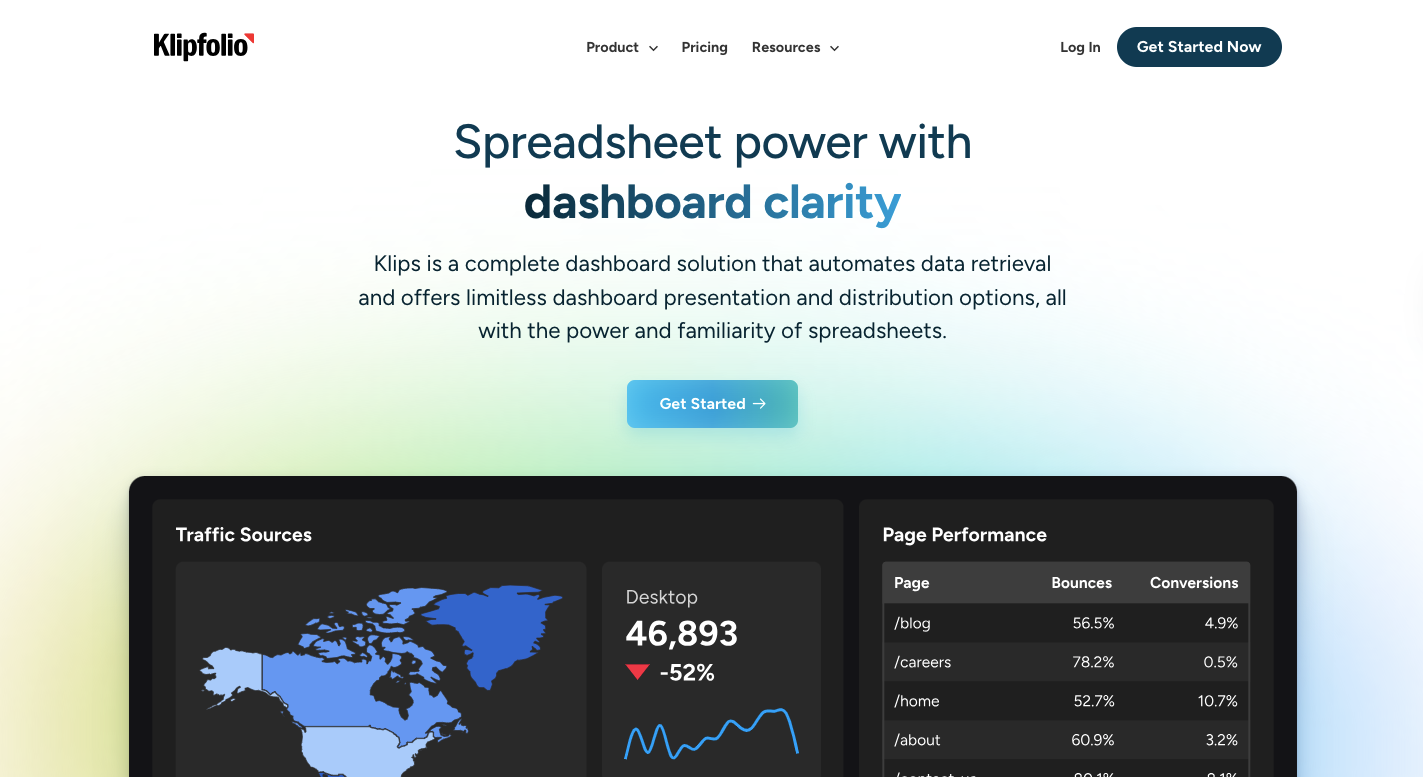
Image Source: klipfolio.com
Some platforms give you static dashboards. Klipfolio goes further by letting you build reporting systems that adapt to how your team thinks, works, and measures success.
The platform connects with over 100 sources, such as spreadsheets, CRMs, ad platforms, and tools like Google Analytics, and brings them into one place. From there, you can build live dashboards or share updates with clients on a schedule.
You don’t need a data team to get started, but it’s not completely plug-and-play either. There’s a steep learning curve if you’re new to building metrics from scratch. Yet once you’re set up, you’re in full control.
Klipfolio even includes natural language processing (NLP), so instead of filtering through menus, you can just type what you’re looking for. It also lets you bring together and consolidate data from multiple channels into one dashboard.
That means fewer clicks, fewer exports, and meaningful insights delivered when you need them.
Features
Klipfolio gives you the features to turn raw numbers into dashboards that actually make sense:
-
Dashboard creation – Build from scratch or start with pre-built layouts.
-
Modern data visualization – Use charts, graphs, and gauges to represent performance in clear, visual ways.
-
Real-time data – Dashboards refresh automatically or on a schedule you set.
-
Data refresh – Keep your reports current with updates that run as often as every 15 minutes.
-
Customization – Adjust everything from layout to branding and colors.
-
Sharing options – Send reports via email, share links, or embed dashboards where they’re needed.
-
Client management – Organize dashboards by client or department with access controls.
-
Templates – Start faster with dashboard presets made for common use cases.
-
Collaboration – Add comments or tag your team members directly in dashboards.
-
Drag-and-drop interface – Build dashboards and visual elements with a clean drag-and-drop interface.
Pricing
Klipfolio’s Business plans start at $140 per month with the Base plan, which includes core dashboard and reporting features. The Grow plan increases support for integrations and starts at $220 per month.
At $350 per month, the Team plan adds more collaborative features, and Team+ expands advanced options, refresh speeds, and user controls for $690 per month.
Recommended reading
Cognos Analytics vs Klipfolio: Which BI Platform Delivers More?
4. Whatagraph
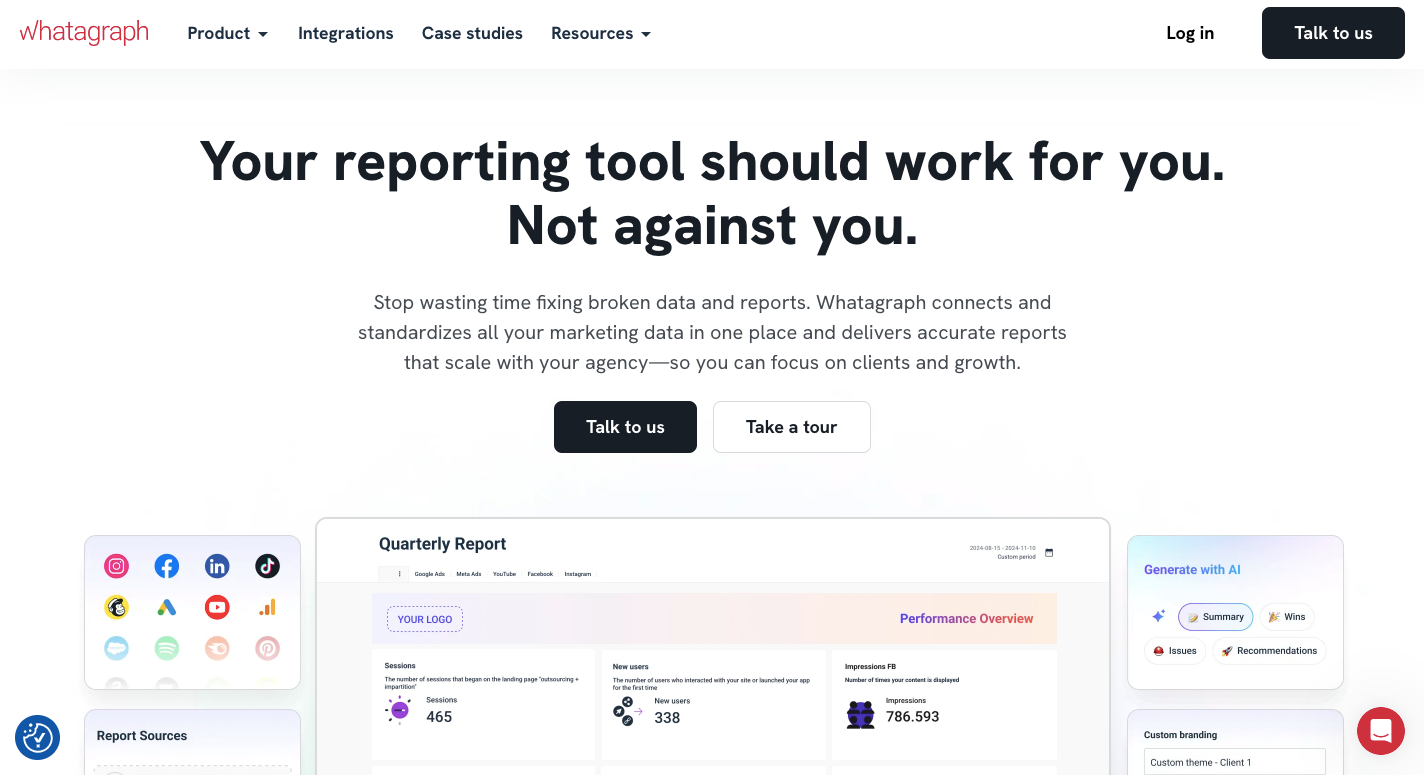
Image Source: whatagraph.com
For agencies that handle multiple marketing channels, Whatagraph is a marketing data platform that connects ad platforms, web analytics, and social tools. It then automates the delivery of clean, client-ready reports.
Metrics update every 30 minutes, so you’re always working with the latest data, not yesterday’s exports. You can combine metrics, highlight outcomes, and format results in branded, ready-to-send reports.
There’s built-in logic to analyze data and summarize campaign results. You’ll also get short AI-written takeaways that help surface patterns or point out changes. And when reports are consistent, the conversations get better.
The platform also has a user-friendly interface, but some teams mention minor layout limitations, while others flag occasional sync issues with ad accounts.
Besides that, just know that your reports are only as good as the underlying data.
Features
Whatagraph supports your multi-platform campaigns’ performance and gives you actionable insights with these:
-
Automated reporting – Set schedules and let reports run on their own.
-
Cross-channel data – Combine multiple platforms into one unified view.
-
Live dashboards – Share metrics with clients in real time.
-
Custom templates – Build reports with flexible layouts and branded elements.
-
Data blending – Combine numbers from different platforms to build better narratives.
-
AI-powered summaries – Turn key trends into plain-language insights.
-
White-labeling – Share polished reports under your own brand.
-
Drag-and-drop builder – Design custom reports with no code.
-
BigQuery and Sheets integrations – Use advanced setups for deeper data analytics.
Pricing
Whatagraph doesn’t publish pricing tiers, and rates vary depending on team size, number of connected accounts, and report volume.
5. Tableau
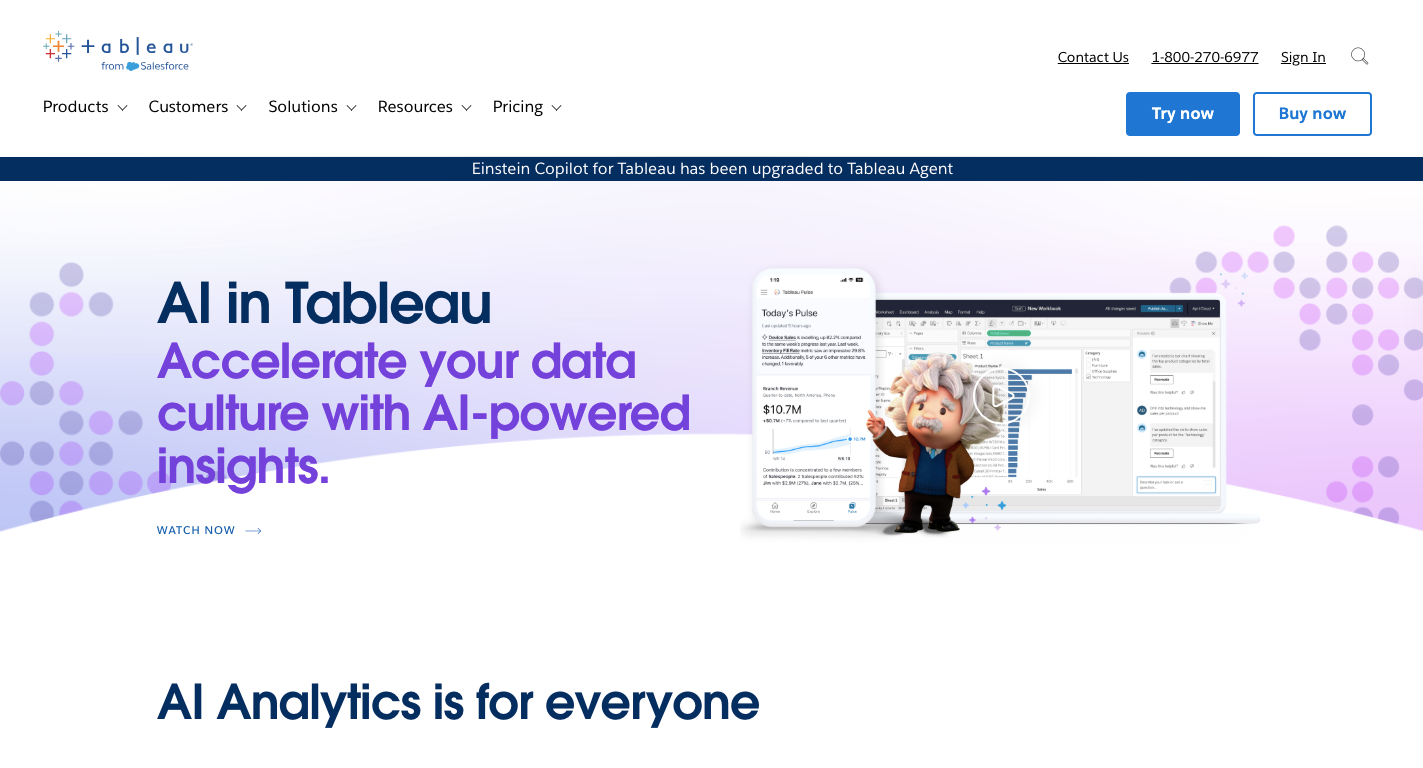
Image Source: tableau.com
Tableau helps you connect data across systems, from spreadsheets to big cloud warehouses. Analysts usually use it to visualize multi-layered metrics, but it’s just as usable without a technical background.
The platform doesn’t fully replace traditional reporting methods, but it improves on them. You can automate updates, use AI to spot patterns, and move from static PDFs to live dashboards that clients or execs can interact with.
You’ll also get tools like Tableau Pulse and Einstein Copilot that flag changes, suggest views, and explain shifts in plain language. Tableau Agent, an AI report generator, further facilitates data exploration by letting you ask questions and build reports through simple prompts.
That’s paired with automation, so you’re always seeing up-to-date results without waiting on manual work.
Features
Tableau comes with the following features for better complex data processing:
-
Drag-and-drop interface – Build dashboards without needing to code.
-
Real-time analysis – Stay updated with dashboards that reflect the latest data.
-
Data source compatibility – Connect with files, databases, APIs, and data warehouses.
-
Interactive dashboards – Let users drill down, filter, and compare data live.
-
Advanced analytics – Access forecasting, trend modeling, and statistics in one place.
-
Collaboration tools – Share dashboards, comment on insights, and manage access by role.
-
Visualization options – Use over 25 chart types to simplify communication.
-
Python/R integration – Run custom logic directly in dashboards using familiar code.
-
Mobile access – Track performance and reports from anywhere.
-
Augmented analytics – Uses AI and advanced tools to deliver guided insights.
Pricing
Tableau offers three pricing levels, depending on how your team works. Viewer, at $15 per user per month, is best for those who just need to view dashboards and get alerts.
Explorer, at $42, adds the ability to interact with reports and dive deeper into data. When you’re designing dashboards, prepping data, or managing integrations, there’s a Creator plan, which runs $75 per user per month.
6. Openkoda
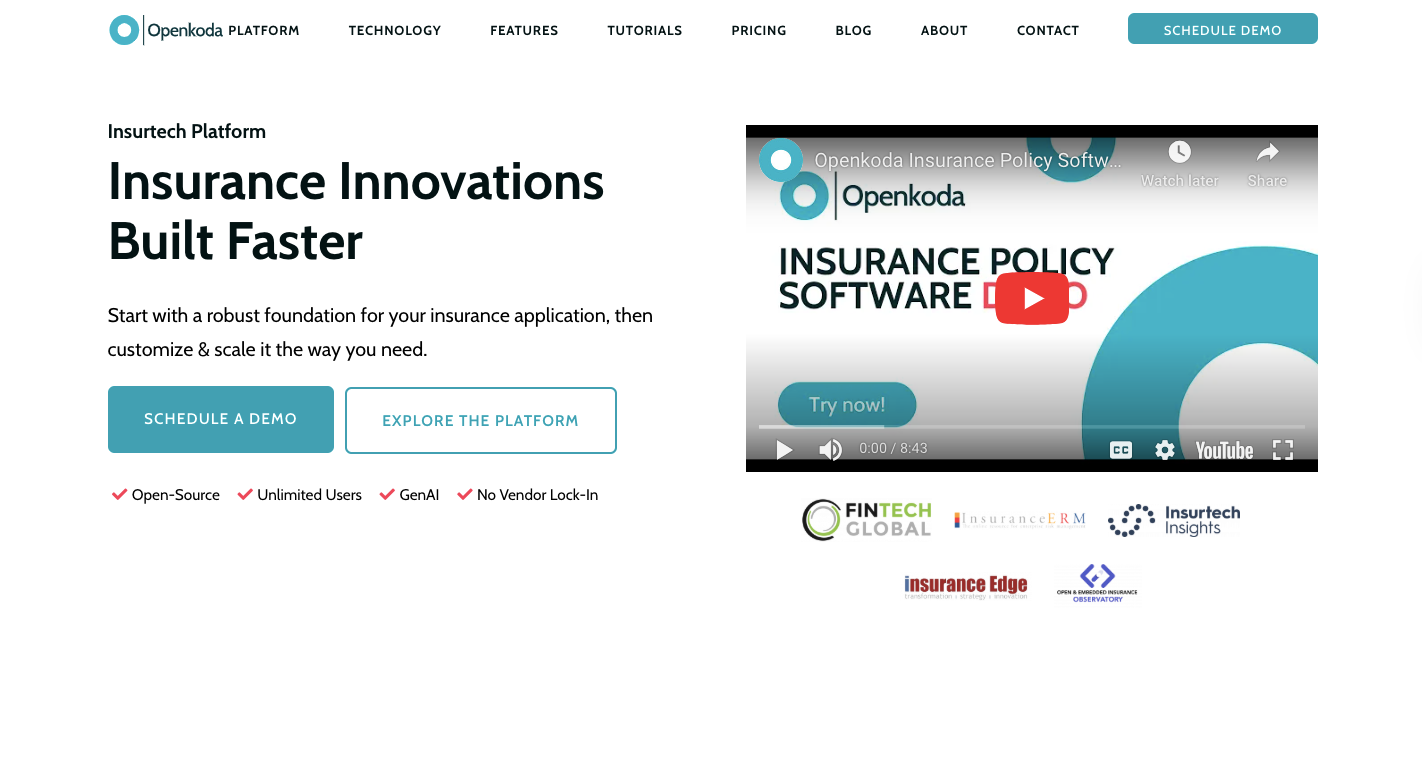
Image Source: openkoda.com
As a low-code, open-source platform, Openkoda gives you control over how you build, deploy, and run internal applications, including fully customizable dashboards and reporting layers.
For reporting, Openkoda AI Reporting strips away technical barriers and lets you ask for the reports you need in natural language. Type a request like “Show all open claims by risk level this month,” and the system generates the report, chart, or dashboard automatically.
You can also build and export custom dashboards, create reports for different clients or departments, and work across roles. And because you can easily connect multiple data sources, the platform’s flexibility goes well beyond insurance-specific workflows.
Openkoda includes AI-driven tools that help automate data analysis too, which reduces your manual work tied to everyday business reporting.
For companies focused on marketing analytics, risk assessments, or fraud detection, the platform’s advanced features offer long-term scalability and serious time savings.
Features
Openkoda combines open-source flexibility with enterprise-grade control. Key features include:
-
Pre-built templates – Use system-ready modules for claims, users, and policies.
-
Workflow automation – Trigger actions and reports without manual steps.
-
Custom dashboards and reports – Tailor data views for specific users or teams.
-
Data modeling tools – Structure how your platform stores and queries information.
-
Analytics and reporting – Access live dashboards with export options.
-
User authentication – Manage secure access through permission tiers.
-
Integration with third-party systems – Extend functionality without vendor lock-in.
-
Responsive design – Build interfaces that adapt across devices.
-
Cloud or on-prem deployment – Choose hosting that fits your infrastructure.
Pricing
Openkoda offers a free Core version for teams that want full access to its open-source foundation. For those who need hosted support or enterprise-level features, pricing starts at $4,000 per month for both Managed Cloud and Self-Hosted Enterprise options.
7. Akkio
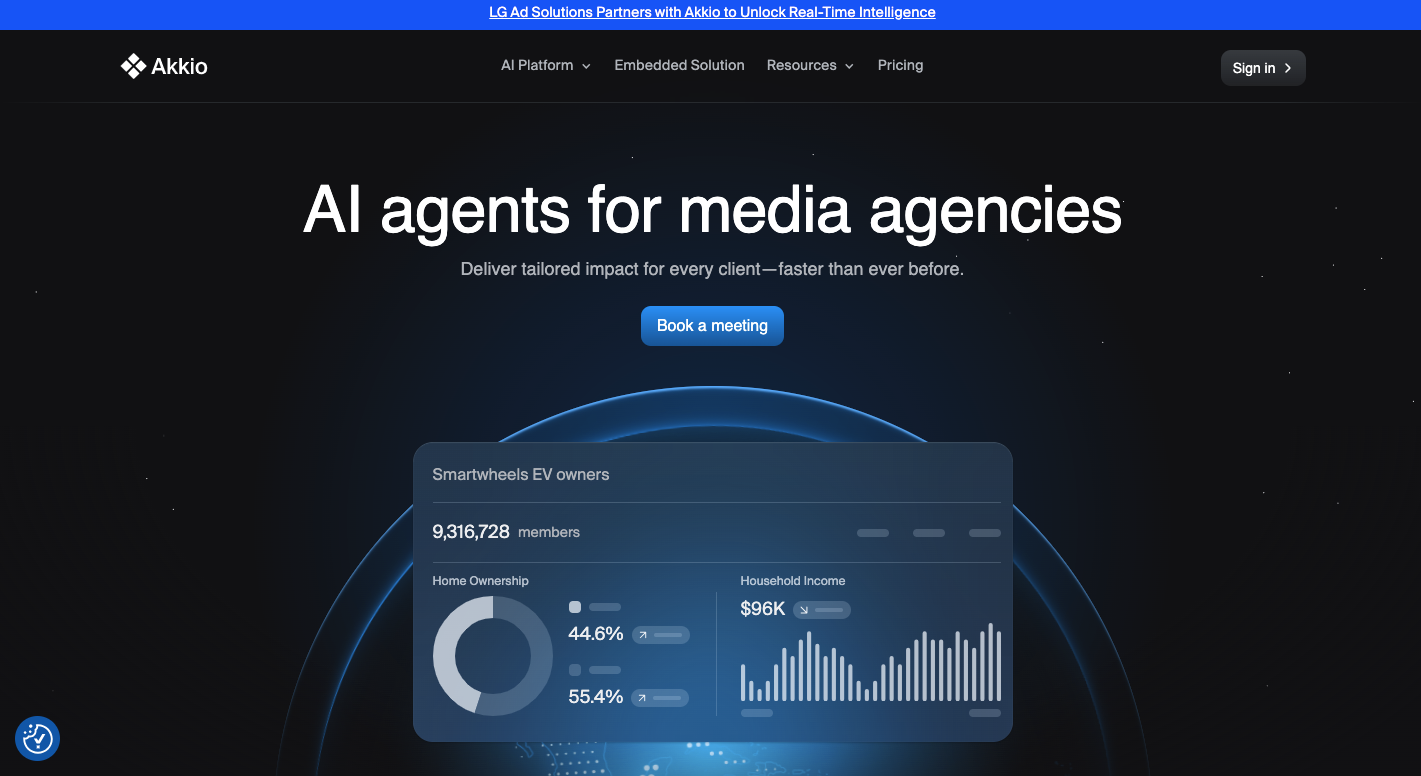
Image Source: akkio.com
Akkio helps you test ideas, visualize patterns, and launch machine learning models on live campaigns. You can create branded dashboards, track performance metrics, and use its AI to forecast trends.
Even better, you can import customer lists, campaign data, or CRM exports, then use them to identify opportunities for leads and predict future outcomes through historical data.
For some teams, it even helps simulate traditional data analysis methods like regression modeling, without having to build from scratch.
Built-in chat lets you explore data with natural language queries, pulling out summaries, comparisons, and KPIs instantly. Regardless of whether you’re analyzing churn risk, ad performance, or engagement trends, Akkio makes it easier to spot the key points needed.
Features
Akkio includes features that let you build, monitor, and share AI-powered reports without needing a technical background:
-
No-code AutoML – Build classification, regression, and forecasting models in minutes.
-
Predictive analytics – Spot trends before they appear in your reports.
-
Live visualizations – View real-time updates through dynamic charts and tables.
-
Natural language interface – Ask questions about your data and get back clear, visual answers.
-
Data connectors – Sync with cloud storage, databases, and external business systems.
-
Data cleaning tools – Standardize messy inputs to improve model accuracy.
-
White-label reporting – Add your own branding for seamless client reporting.
-
Custom LLMs – Build with your own language models for niche use cases.
-
Model monitoring – Get alerts when model performance changes over time.
-
Compliance controls – Full transparency logs and GDPR-aligned architecture.
-
Azure integration – Expand reach across Microsoft’s AI and cloud services.
Pricing
Akkio’s pricing depends on how your agency operates. Plans aren’t listed publicly, but every enterprise license includes access to all domain-specific AI agents, integrations, and reporting tools.
You also get 24/7 support, enhanced security, and the choice to deploy via SaaS or embed into your infrastructure.
8. Jenni AI
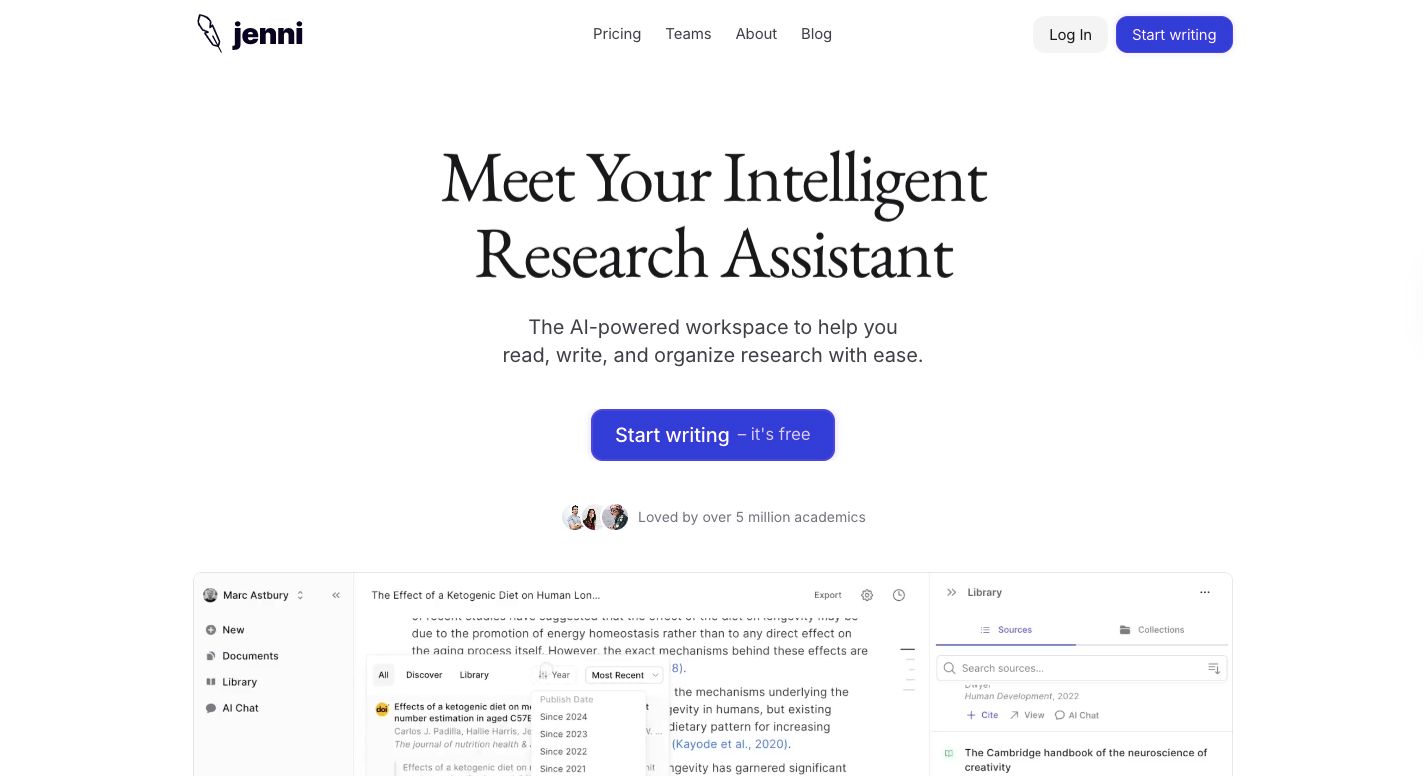
Image Source: jenni.ai
With an AI-powered writing assistant, Jenny AI takes the pressure off starting project reports, researching, and refining content, especially for students, researchers, or anyone who needs structured, source-backed writing.
The platform focuses on guiding your process instead of replacing it. You can upload PDFs, ask questions, and get summaries instantly, or use the AI autocomplete to keep your drafts moving.
And when it’s time to cite sources, it supports over 2,000 citation styles and builds your bibliography as you go.
Jenni also goes a step further for researchers who deal with dense reading. The PDF assistant can answer questions about uploaded articles and even summarize key findings.
By pulling together all these functions into one tool, you can generate comprehensive reports with minimal effort, without bouncing between multiple apps.
Features
Jenni AI offers:
-
AI autocomplete – Finish sentences or paragraphs with smart suggestions.
-
AskJenni – Your AI research assistant for on-the-spot document questions.
-
Outline builder – Generate section headers from your topic to organize ideas.
-
Paraphrasing tools – Reword or simplify sentences on command.
-
Citation management – Track and insert references as you write.
-
In-text citations – Add citations automatically in styles like APA, MLA, or Chicago.
-
Multilingual support – Write in English, Spanish, French, German, or Chinese.
-
PDF assistant – Chat with uploaded academic papers.
-
Plagiarism checker – Scan content for originality before submitting.
-
Export formats – Download in DOCX, LaTeX, or HTML for submission or collaboration.
Pricing
Jenni AI offers a free plan with a daily limit of 200 autocompletes, ten PDF uploads, and partial document export. The Unlimited plan, priced at $30 per month, gives you: unlimited usage, full exports, unlimited AI chat, and access to all new features as they roll out.
Move Beyond Static Dashboards to AI-Powered Reporting With TapClicks
Static dashboards tell you what happened. TapClicks tells you what to do next.
For agencies managing dozens of campaigns and client demands, it’s not enough to just display numbers. You need tools that interpret the data and surface marketing trends, and help you respond before it’s too late. TapClicks does exactly that.
Here’s how TapClicks helps:
-
Spots sudden shifts in campaign performance before they become problems
-
Summarizes multi-channel data into clear, actionable updates
-
Flags top and bottom performers weekly, so you can optimize faster
-
Connects budget pacing to campaign results, not just spend
-
Uses historical data to forecast likely outcomes across channels
-
Helps plan seasonal pivots and long-term strategy adjustments
-
Automates report generation and insight delivery across clients
-
Frees up your team from manual dashboards and redundant prep work
-
Enables custom agents that adapt to your clients’ workflows
FAQs About AI Reporting Tools
Is there an AI tool that can create reports?
Yes, there are several AI tools designed to make reports. These tools automate reporting workflows, summarize various data points, and help teams create reports faster and more accurately. They support integrations like Google Analytics, making them ideal for marketing teams, agencies, and business users who want to stay ahead of data trends.
How is AI used in reporting?
AI is used in reporting to generate summaries, identify anomalies, and provide deeper insights that a human analyst might catch only after a detailed review. Tools often include features like an AI summary widget, which highlights key metrics automatically.
Which AI is better for reports?
The best AI for reports depends on your needs. For example, TapClicks works well for marketing reporting. Some tools focus on visualizing how many reports you generate across clients, while others specialize in forecasting or deeper data exploration.
What are the four types of AI tools?
The four types of AI tools include predictive analytics, natural language generation, data visualization platforms, and reporting assistants. Each serves a different purpose, from transforming raw data to guiding business decisions.