
AI for Reporting: Unlock Real-Time Marketing Insights
Most marketers spend hours gathering numbers from different platforms. It slows updates and makes it harder to explain what’s happening across campaigns.
AI for reporting reduces that load. It turns complex data into short summaries, organized highlights, and helpful explanations. You don’t have to sift through dashboards or rebuild the same reports each week.
This guide explains how AI for reporting works. It also shows how AI reporting tools help teams gain faster updates and sharper visibility into performance.
AI for Reporting Explained
AI for reporting uses automated systems to review marketing data and explain what changed across your channels. It replaces traditional reporting methods that rely on spreadsheets.
AI reporting tools pull information from multiple data sources. They highlight key performance indicators (KPIs) and pinpoint trends without forcing you to sort through complex data sets.
An AI report generator can also respond to natural language queries. You can ask a direct question and receive structured reports that outline key insights or data trends you want to check.
Modern AI reporting capabilities support client reporting, monthly reports, and custom reports. They help teams share meaningful insights faster and with fewer reporting workflows to manage.
How AI Reporting Tools Handle Your Data
AI for reporting uses automated systems to review marketing data, connect related data points, and explain shifts in performance.
It removes repetitive steps in the reporting process and gives you a faster way to understand what’s happening across channels.
Here's a breakdown of the core elements:
-
Machine learning (ML) algorithms: Help optimize marketing campaigns. They compare historical data with current results and help teams predict future outcomes with more detail than traditional data analysis methods.
-
Natural language processing (NLP): Turns written questions into queries that the system can read. You can ask for performance metrics or key trends, and it returns summaries that match your request without manual checks.
-
Data integration: Pulls information from multiple data sources and merges it into one dashboard. You don't have to sort through raw data or move between platforms during data analysis.
-
AI-generated insights: Highlight key points in a marketing report. It links various data points, interprets results, and produces AI-generated reports you can share with clients or internal teams.
Together, these components connect to produce reports that are easier to review and share.
Examples of AI at Work in Marketing Reporting
AI for reporting can help teams understand shifts in performance without long manual steps. It reviews campaign activity, compares time periods, and supports smoother data analytics across your channels.
Here’s a breakdown of common ways marketers use these tools.
Campaign Performance Reviews
AI-powered analytics sort performance metrics from different platforms and point to shifts that affect results. You might see a paid search campaign lose clicks while a social campaign gains more traffic.
If the cost per click rises on one platform, the system identifies when the increase started and which data points changed.
This helps you adjust your marketing strategy with information that reflects what actually happened.
Budget Pacing Checks
ML algorithms compare current spend with historical data and flag pacing issues before they spread. If a campaign uses its budget too fast, the system shows where the spike began.
If the spend falls behind target, it highlights the placement that slowed down. This supports data-driven decisions without sorting through separate reports.
Audience and Segment Insights
AI-powered insights outline how different groups interact with your ads or content. One group may watch more videos while another responds to static images.
These patterns help you refine creative choices and avoid changes that don’t match actual behavior. You get deeper insights into how each audience segment reacts to your campaigns.
Period Comparisons
AI reporting tools compare one period with another and show what changed between them. You may see that conversions dipped after a drop in traffic from a specific source.
You might also confirm that a spike came from a new placement instead of a random fluctuation. This replaces manual spreadsheet work and gives you accurate reports you can review quickly.
How TapClicks Uses AI to Support Marketing Reports
TapClicks brings several AI features into one place. This helps you review results, create reports, and spot changes in performance without switching between tools.
Here’s a breakdown of how TapClicks supports the full reporting process.
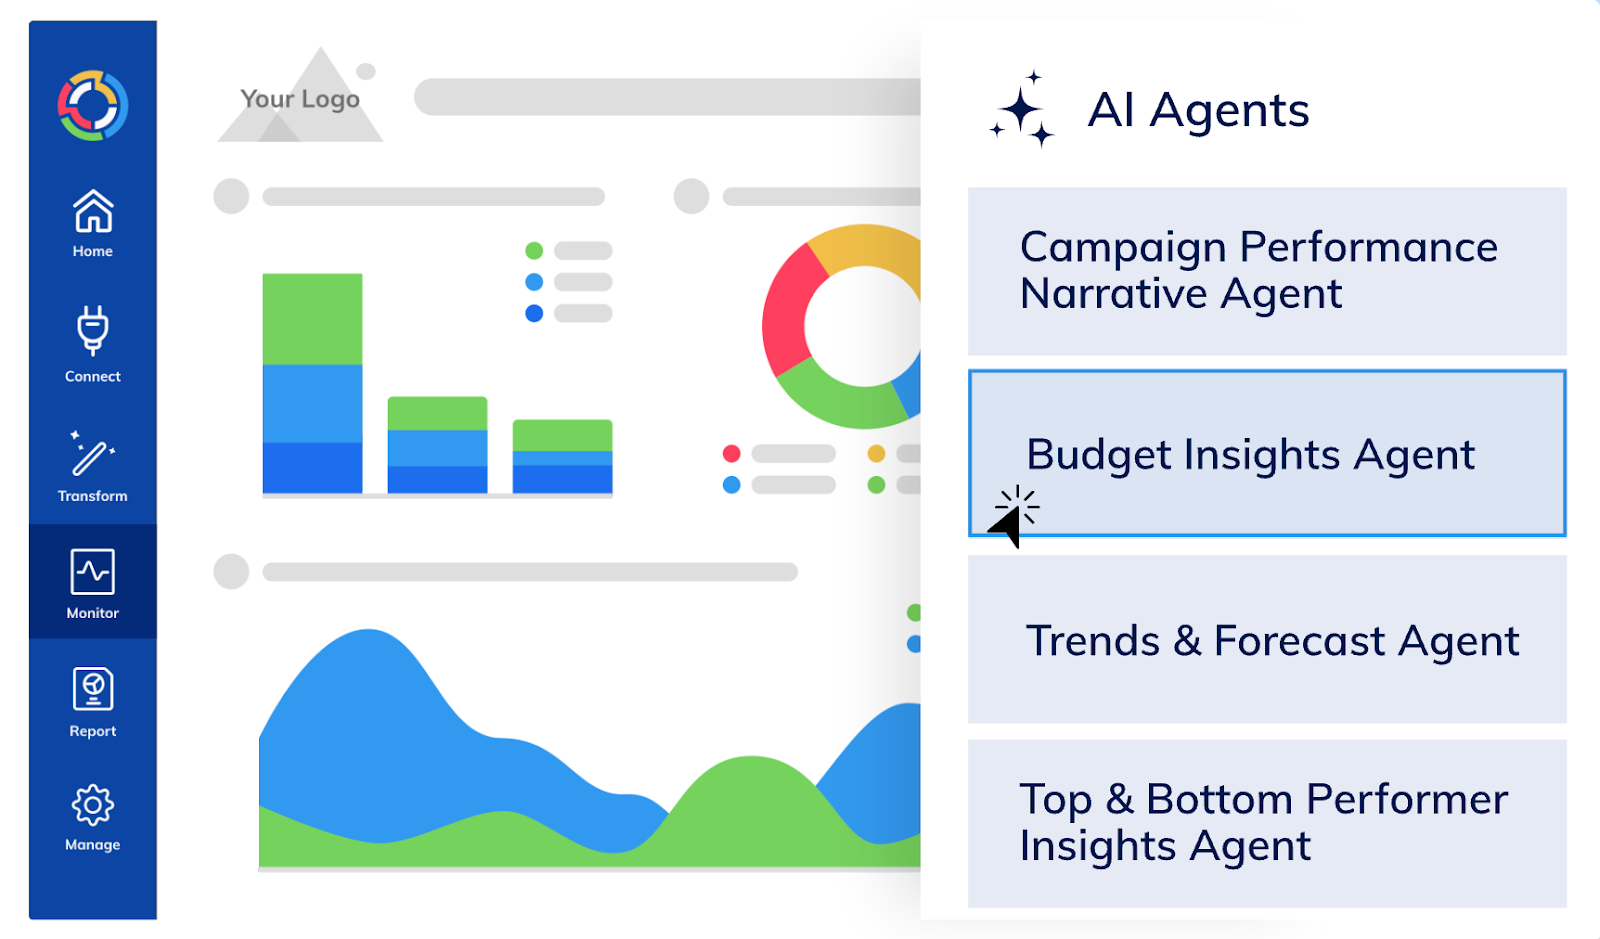
Surface Insights Automatically
AI Insights Agents review your campaign data and highlight wins, losses, pacing issues, and movements in important metrics. They scan your analytics dashboards and point to the exact data points that changed.
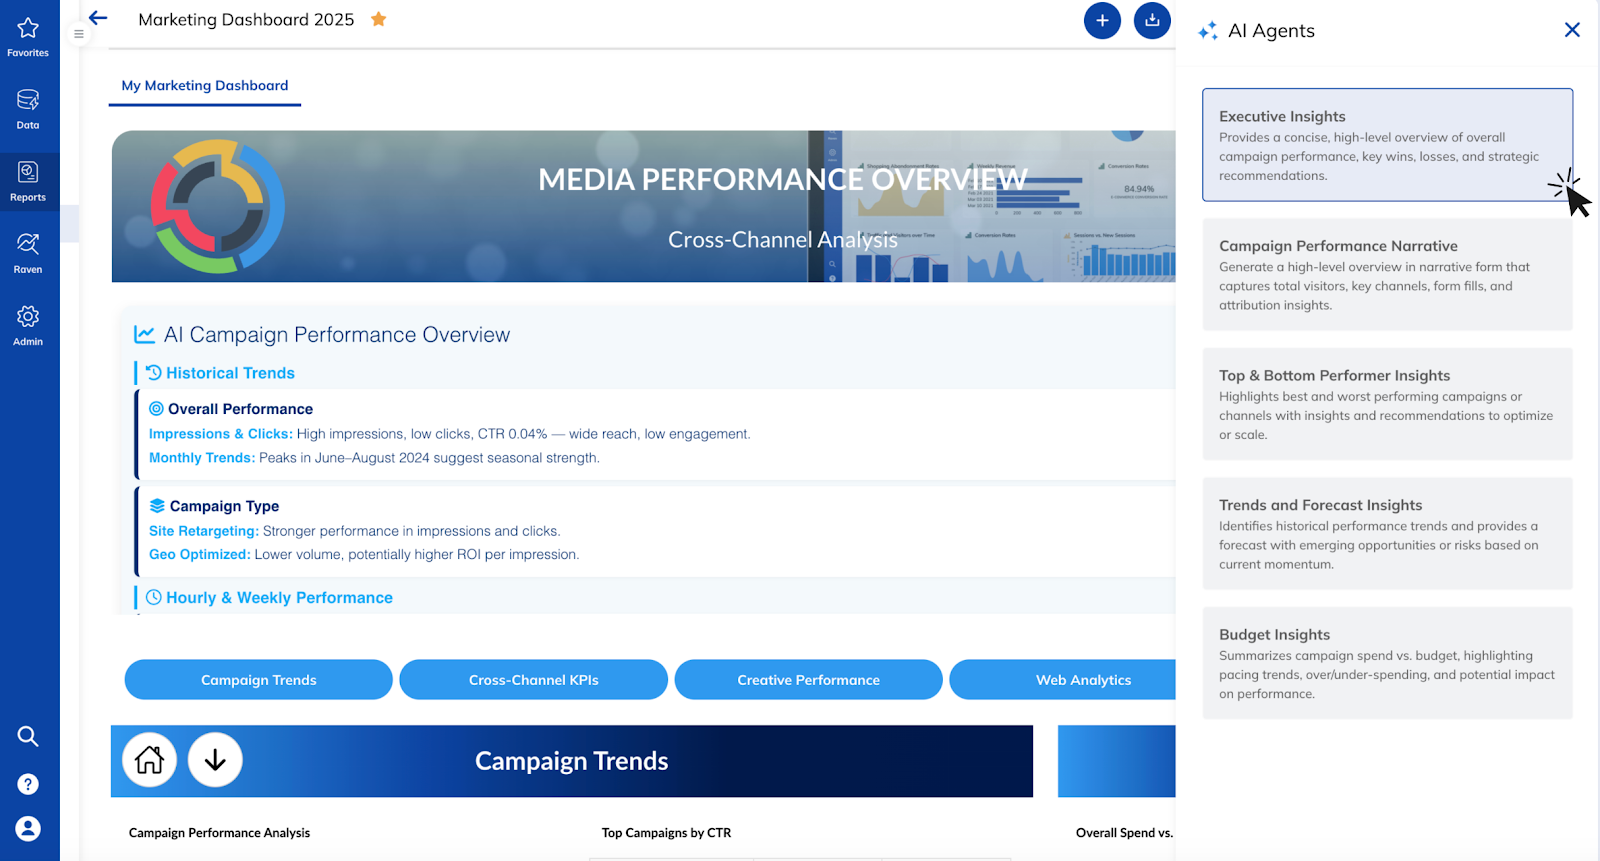
You see the cause of a drop or increase without searching through separate reports. The summaries also include actionable insights that show what you should check next.
This helps business users understand marketing trends and make data-driven decision-making part of their routine.
SmartEmail adds automated reporting for teams that want updates in their inbox. It sends scheduled emails with short explanations of recent changes.
You get the context you need before internal meetings or client calls.
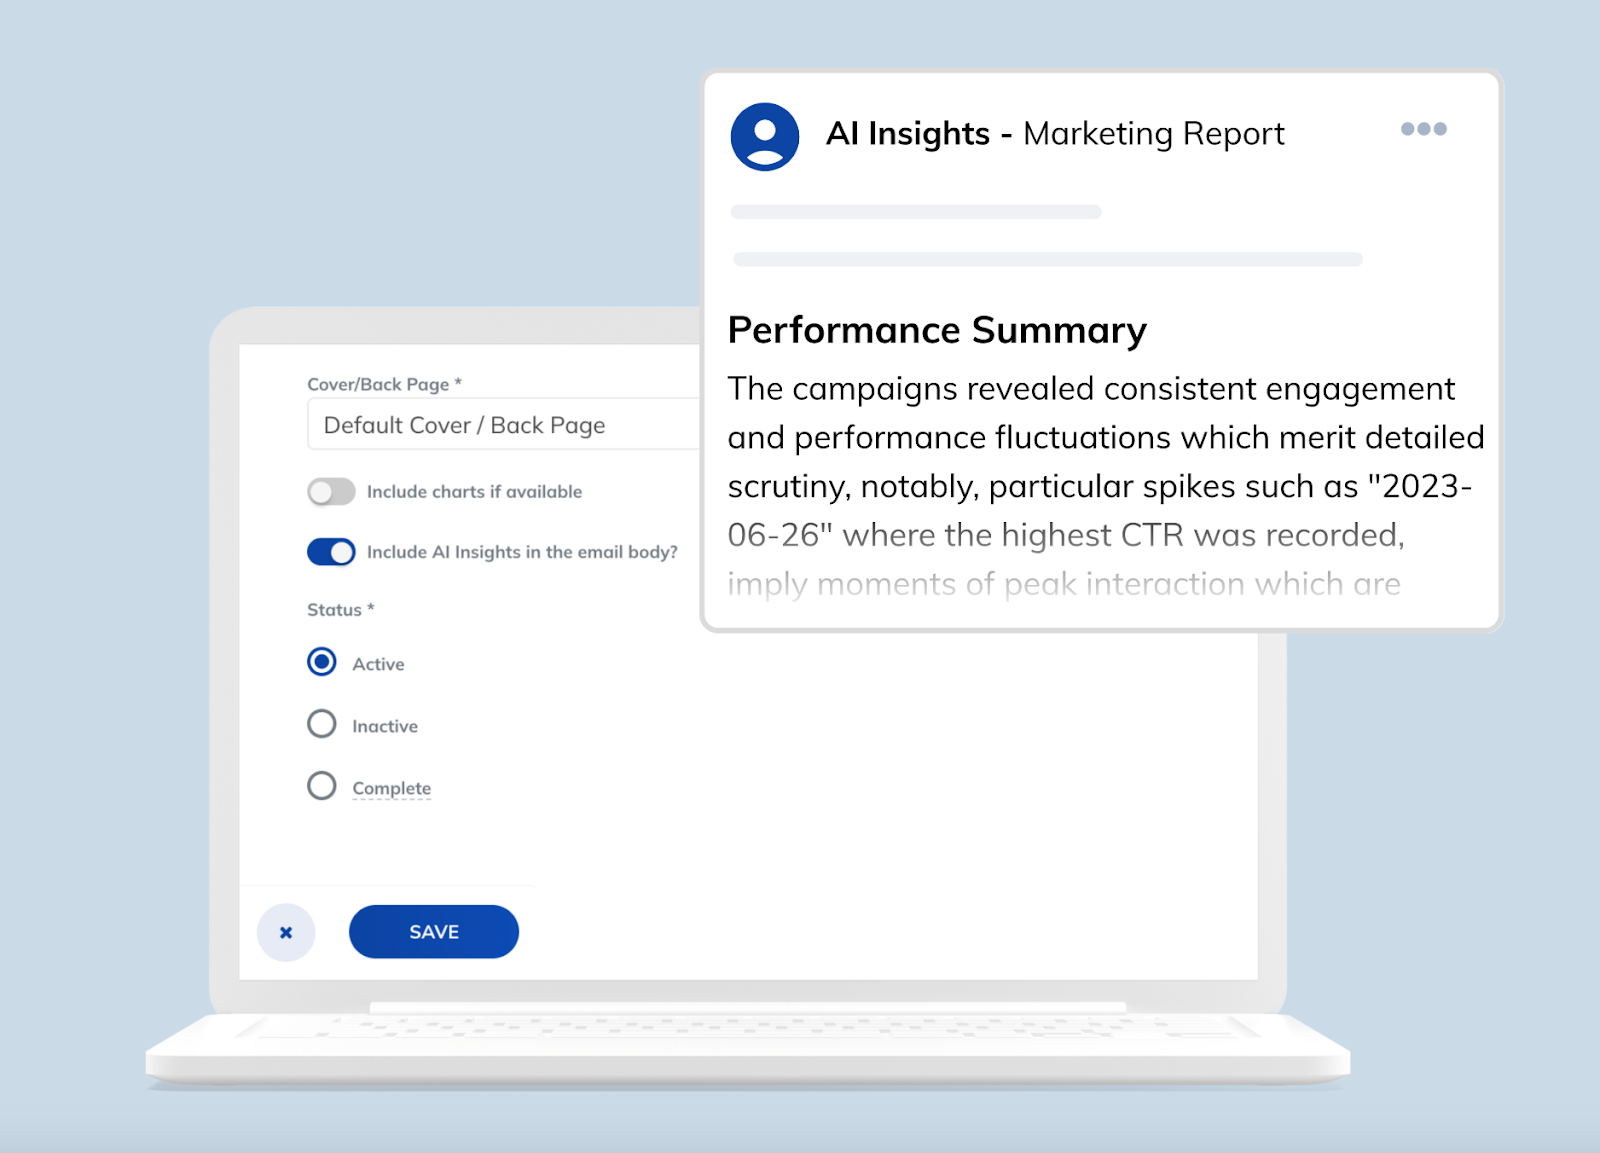
Turn Data Into Ready-to-Share Reports
SmartSlides turns selected data into professional-looking reports. You choose the data and a marketing analytics report template.
The system produces a deck with data visualization, performance metrics, and narrative explanations.
You can export the deck to PowerPoint or PDF. This supports quarterly business reviews (QBRs), weekly recaps, and client-ready reports that need consistent formatting across several accounts.
SmartEmail also supports this workflow. You can forward the update when someone needs a quick summary.
Customize How the Platform Thinks and Calculates
The Build Your Own Agent feature lets you set up an agent with your own prompt logic. You can create one that checks Google Analytics traffic or one that focuses on a specific client’s paid media results.
You publish it without code, and it becomes part of your TapClicks workspace.
The Data Transformation Agent helps you build new metrics with natural language prompts. You can ask for the cost per lead or another calculation you need for a meaningful report.
TapClicks creates the metric and adds it across dashboards, SmartSlides, and SmartEmail updates. It also standardizes fields so your data processing stays consistent across every report.
Benefits of Using AI for Report Generation
AI for reporting reduces the manual steps required to pull, review, and structure performance data. Here’s a breakdown of the core benefits and what they help you accomplish.
-
Faster access to insights: AI reporting tools scan your data and identify shifts in conversions, clicks, or spend. You see the exact data points behind the change without waiting for a recurring report.
-
Consistent reporting: AI-generated reports apply the same formulas and naming conventions. This prevents differences that occur when several team members prepare updates separately.
-
Higher accuracy: Manual reports often contain copy errors or mismatched filters. AI tools automate data analysis and pull the correct fields each time, which reduces those issues.
-
More time for analysis: You spend fewer hours on data exploration and cleanup. AI systems handle comparisons and summaries. You can focus on patterns identified through predictive marketing analytics or other advanced tools.
These benefits help teams review performance data with more precision while avoiding repetitive work.
Limitations and Challenges of AI Reporting
AI for reporting introduces automation into the reporting process, but it also creates limits that teams should understand.
The challenges below can affect how marketers interpret results.
-
Data dependency: AI systems use your existing data fields. If those fields include gaps, outdated values, or inconsistent naming, the system will produce summaries that reflect those issues. This affects performance reviews that depend on accurate inputs.
-
Missing context: Artificial intelligence identifies patterns in metrics, but it doesn’t detect outside events. A spike from a press mention or a dip caused by a site outage won’t be recognized unless a human reviews the situation.
-
Risk of over-reliance: Automation can make teams skip basic checks. A broken connector or a shift in platform labeling can change results without being noticed. However, a quick manual review helps confirm that the reported trend is accurate.
-
Learning curve: Some reports need precise instructions. Users may need time to understand how prompts work or how the system reads specific fields. This becomes more noticeable when teams handle complex reporting tasks that require exact logic.
These challenges show where AI reporting needs human oversight, especially when interpreting results or verifying unexpected changes.
Turn AI Reports Into a Competitive Edge With TapClicks
AI for reporting works best when a platform helps you analyze data and interpret changes without adding unnecessary steps.
TapClicks supports this by giving marketers a single system to review performance, prepare reports, and communicate valuable insights.
The platform also supports teams that want a user-friendly interface that keeps their reporting process easy to follow.
TapClicks helps you confirm why metrics move, trace the source of a shift, and share results in a format that fits clients or internal stakeholders.
This structure helps teams respond to performance changes with information that reflects real-time activity.
If you want reporting that supports clear interpretation and practical workflows, TapClicks can show you how it fits your marketing operations.
Book a demo to see how TapClicks works with your data and supports your reporting goals!
FAQs About AI for Reporting
Can AI be used for reporting?
Yes. AI can handle parts of the reporting process by transforming raw data into summaries that explain what changed. It also supports complex data analysis that would take much longer to review manually.
Which AI is best for reports?
The best option depends on the type of reports you need. Platforms like TapClicks work well for marketing teams since they connect your data sources and produce insights you can view or share in just a few clicks.
Can I use AI to write my report?
Yes. AI reporting tools can produce generated content such as summaries, emails, or slide decks. The system reviews your data and outlines the key points for you.
You should still check the final report to confirm that the wording and focus match your goals.
What is the 30% rule in AI?
The 30% rule suggests that AI should handle about 30% of a task. This covers repetitive steps such as comparisons, summaries, or metric checks.
Humans manage the remaining 70%, which includes decisions, interpretation, and strategic thinking.