
Why Your Omnichannel Marketing Analytics Tool Should Have These 3 Features

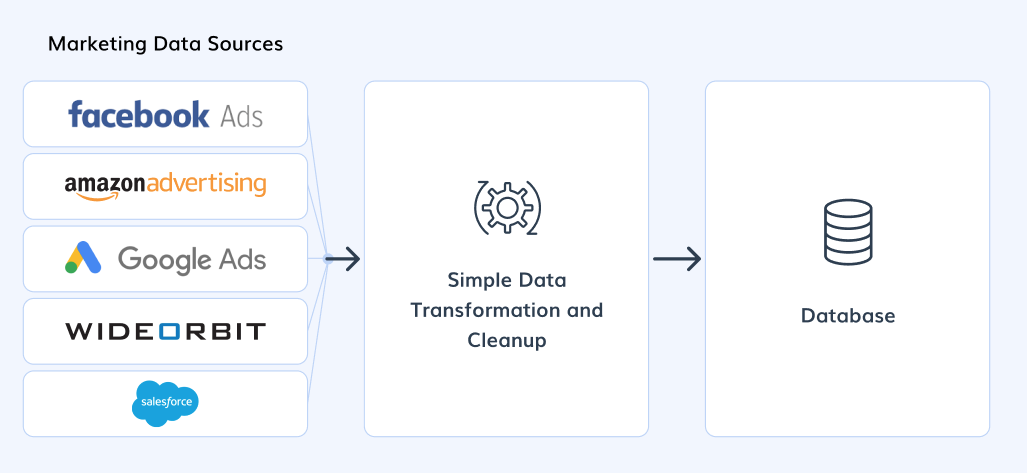
Gathering analytics across every omnichannel campaign that delivers insightful information for improving marketing strategy is a challenge for marketing teams with retail brands. This is because most omnichannel analytics tools only do part of the work marketers need they typically don't fulfill the entire marketing lifecycle, from collecting data from every data source, storing it in an accessible central hub and providing automatic analytics reports or distributing data to any destination.
This means marketers typically use several different methods and tools to produce their analytics which is labor-intensive and time-consuming. Plus, they usually have to wait for their data team to help them do this.
In this post, we'll explain three essential features we believe an effective omnichannel analytics tool should have. Then we'll show you how our solution, TapClicks, helps with all of them and generates meaningful analytics for all your omnichannel campaigns, by:
- Aggregating data from all your data sources and storing it in your own omnichannel data warehouse that can be easily accessed by marketers
- Doing advanced calculations and analytics on all your omnichannel campaigns so you don't have to do anything manually or use separate tools
- Automating powerful visualizations of your omnichannel campaigns via dashboards, PowerPoint-style reports or exporting to a third party BI or data analysis platform (e.g. Google Sheets or Tableau)
Before we discuss the essential features, we'll consider what omnichannel analytics is, explain its importance and outline the common challenges of other solutions.
If you think TapClicks could work as an omnichannel marketing analytics solution for your organization, you can try it free for 14-days or schedule a demo to learn more.
What Is Omnichannel Marketing Analytics?
Omnichannel marketing analytics is a term commonly used to describe the data gathered from each touchpoint of the customer journey across every sales and marketing campaign and channel. The data is aggregated from multiple sources (e.g. CRM, Amazon, in-store POS systems) and used to gain insight into consumer behavior, help optimize sales and increase profitability.
To help brands optimize the omnichannel experience, there are tools available that analyze customer engagement, customer satisfaction and the entire customer journey. A common use case for these is in omnichannel retail channels. For example, retail brands may have customer experience data from their eCommerce website such as Shopify, mobile apps, in-store POS systems, and even various marketplaces (e.g. eBay, Amazon).
Analytics of all of this customer data can help brands understand the true driving forces of sales and how the channels are interlinked in a larger, multi-channel customer journey (e.g. customer researches online, buys in-store, repeat buys online, etc.). This understanding can then help brands deliver more personalized experiences to customers and maximize customer retention.
A critical part of this omnichannel approach for analytics is the gathering of customer data from all different channels. Then, you need to store that data in one place, do complex calculations, manipulate it and distribute meaningful visualizations to stakeholders or even to another platform.
Unfortunately, most omnichannel analytics solutions only help with parts of this process, not the whole thing, which creates challenges.
The Challenges for Marketers with Most Omnichannel Analytics Tools
Many retail brands and marketers use several disparate tools to collect, store, analyze and report on their omnichannel marketing data. Most teams also do a lot of the analysis work manually by using spreadsheets.
The first challenge is that most omnichannel analytics tools don't integrate with all your data sources, meaning you need to gather the data from those data platforms manually, with custom-built APIs or scripts, or with another tool. This makes the process unnecessarily complex and time-consuming.
The other common challenge of many omnichannel marketing analytics solutions is that in addition to a set of tools for pulling data from each data source, you'll need a separate tool to store your data, and act as a data warehouse or data lake. These warehouses are typically databases that require data engineers to access. So, when a marketing team or non-technical employee wants to get data from any channel to do analysis, they'll need to ask the data team to do that and wait in line alongside any other requests from elsewhere in the business. This is slow and frustrating for marketing and business teams.
Let's look more closely at what omnichannel solutions many retail brands and marketers use:
Native Ecommerce Platforms
Ecommerce platforms such as Shopify, Salesforce Commerce Cloud and WooCommerce are an important element of the omnichannel experience for most retail brands and marketers. But you need to be able to draw the data from these platforms and visualize it alongside all your other data.
Shopify does have some analytics on its native dashboard (e.g. standard charts and sales data) but this is stored in a silo. Even if you have several Shopify stores, you can't aggregate data from different Shopify accounts and you can't integrate it with digital marketing platforms (e.g. Facebook Ads, X [Twitter] ) or your other omnichannel data sources (e.g. mobile apps, in-store data).
Business Intelligence (BI) Tools
General BI tools (e.g. Tableau) provide sophisticated analytics and visualizations. However, they can be complex to use and do not have the ability to pull data from all your sales and marketing data sources. To get around this, you would need to collect data from these other sources manually or ask your data team to do that for you every week or month. This is labor-intensive and time-consuming.
ETL (Extract, Transform, Load) Tools
ETL tools such as Supermetrics or Improvado are data connector tools. They pull data from your omnichannel data sources, standardize or transform it and deliver it to another destination such as a data warehouse.
They do not usually offer dashboards or reporting so your omnichannel analytics function ends there. To do your data analytics you would have to connect to another tool such as a BI tool or a dashboard platform such as Google Data Studio.
When enterprise-level agencies or retail brand marketing teams deal with dozens or hundreds of multi-channel campaigns, using these disparate tools is simply not practical and almost certainly not scalable.
Our platform TapClicks was built to address the disadvantages of using multiple tools by providing an all-in-one platform which aggregates data from all your data sources, stores it forever and allows you to create advanced analytics and reports on all your omnichannel campaigns.
We'll explain how next.
#1: TapClicks Aggregates Omnichannel Data from All Your Data Sources and Stores It in Your Own Data Warehouse
Retail brands and marketers who have retail clients deal with a large number of different sources of data ranging from customer data (e.g. subscribers, website, eCommerce and POS data) to all the different marketing data sources from the campaigns running within various channels (e.g. social media, radio and TV campaigns).
Managing that volume of disparate data is complex. To create meaningful omnichannel analytics your tool needs to be able to integrate with each data source and pull data from them automatically.
Connect to Any Omnichannel Data Source with TapClicks Smart Connector
TapClicks was designed to be able to connect to essentially any data source. To date we have built connections with over 6,000 data sources including proprietary and offline data sources.
Unlike tools where you are limited to certain pre-built API connections, our Smart Connector'' gives you the flexibility to build a connection with any omnichannel data source you may have.
Here's a short demo video on how to create a Smart Connector in TapClicks:
TapClicks Has Pre-built Integrations to Hundreds of Omnichannel Data Sources
In addition, we also have hundreds of pre-built API-based data integrations. These include all the marketing platforms you would expect (e.g. Facebook Ads, X [Twitter] Ads) and also eCommerce sites such as Shopify and Amazon.

Once you've set up your data connectors, your data will be pulled through immediately and automatically in near real-time, every day or whenever you choose to refresh it. You can also include 12 months of historical data for many data sources that can be incorporated into your omnichannel analytics from the get go.
Besides having the ability to connect to all your data sources and be pulling that data automatically on an ongoing basis, you don't need to worry about your developers managing the API connections, because the TapClicks team will take care of that for you.
Store Data in Your Own Marketer-Friendly Omnichannel Data Warehouse within TapClicks
Unlike data pipeline (ETL) tools that move your data from source to a separate data warehouse, once TapClicks starts pulling your data from all your data sources it is automatically stored in your own fully managed TapClicks data warehouse.
Your omnichannel data will be stored safely forever and can be accessed by any marketer with no data engineering skills required.
The TapClicks platform is your central hub, automatically pulling and storing all your data, ready for you to do your omnichannel marketing analytics and reporting or even push that data out to other locations.
There is no need for any third-party tools or manual work to be involved and every step of the process can be done by marketers.
#2: Do Advanced Calculations and Set-Up Metrics for Your Omnichannel Analytics within TapClicks
Retail brand marketers need the ability to do advanced calculations and customize metrics to produce insightful analytics on their omnichannel data. This means deciding which metrics you want to include in your analytics and also what you want to call them.
Retail businesses and agencies spend a huge amount of time downloading their data from different channels and then organizing it so that it provides the information that's needed. While there are some tools (e.g. ETL tools) that will help with transforming or normalizing data (making data sets consistent by removing columns, for example, or mapping unstructured data), they don't have the functionality to do the complex calculations needed by marketers to create deeper analytics from multiple sources.
TapClicks helps with this entire process from transforming or normalizing your data so that it's standardized to allowing you to define data metrics and do calculations that can be used over and over, automatically. For example, for repetitive tasks such as adding up the sales of a product, you can set up a product metric once and the calculations will be done for you automatically whenever you need them. Let's look at this more closely.
Product Metric Example
Let's say you want to add up the sales of different products from different sales sources, for example, from a POS system or an eCommerce site (e.g. Shopify, WooCommerce). This needs to be done monthly for an executive report. If you were to do the work manually, you'd use a spreadsheet and each month you'd manually add up all the data, something like this:
- All product A sales on all those channels
- All product B sales on all those channels
In addition, the different channels (Shopify and WooCommerce, vs. POS) probably format the data differently, perhaps using different units or formats and that has to be cleaned up every month.
With TapClicks, you can automate all of this. You can create a metric called "Total product A sales" and define the formula by telling it what to include and from which source(s). Then, you do the same for Total product B sales, and so on. If the data from any of these channels needs to be formatted differently or cleaned up, you can create an automated calculation to do that every time.
As a result, with TapClicks, you never have to manually add this up again. The new metric you created, "Total product A sales" will always do the calculation for you across all your channels. And you can use this metric wherever you want within the TapClicks platform in a dashboard, a graph, or in a PowerPoint slide.
You simply define the metric once and it can be used over and over across all campaigns and clients.
Cross-Channel Metrics Example
With TapClicks, you can also combine cross-channel metrics. In addition to adding up and combining sales at a product level, you can view and combine the data from entire retail channels, for example your POS systems, in-store sales or eCommerce channels, and break it down whichever way you want.

Defining Umbrella Metrics with TapClicks That You Can Use across All Channels
You can also define metrics across different campaigns that can be used across as many elements of TapClicks you want a graph, dashboard, report, campaign, brand or client.
Let's say you've been running Facebook Ads campaigns in some regions where there are stores, a Twitter Ad campaign nationally, and a nationwide radio ad campaign. You want to see how those campaigns perform individually, by region and together. First, you want to know what kind of engagement you've had as a result of those campaigns and you also want to find out how sales have been impacted by them. But how do you define engagement?
With TapClicks, you simply create a new umbrella metric called total engagement and then click on each metric that you want to include in your new aggregate term (e.g. likes, views, clicks) across the various marketing platforms (e.g. Facebook Ads, Twitter), and it's done.
You now have a new metric called total engagement which can be used in any future report or calculation.


This is in contrast to manually having to calculate total engagement every week or month when a report needs to be built that involves that metric. Avoiding these repetitive manual calculations is a large employee-hours time saver for brands and agencies using TapClicks.
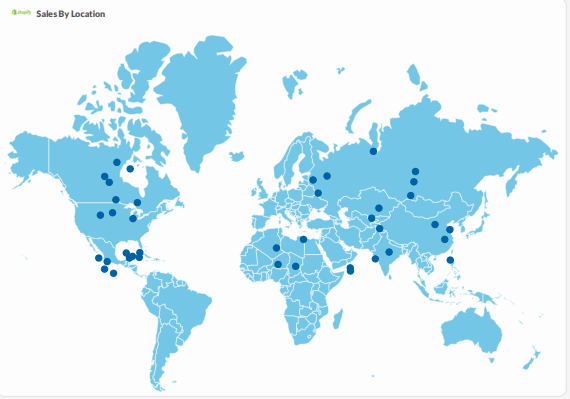
Analyze Omnichannel Results by Location, Region, and More
Most retail brands operate in many locations so analyzing performance of your omnichannel activity at multiple geographic levels (e.g. single location, regional, state and national) is important. This is a complex task given the number of marketing campaigns you're running for some or all of those locations and the hundreds or thousands of product lines you offer. And if you're an agency with dozens of retail clients, the task becomes almost impossible using different tools or manual methods for your analytics
With TapClicks, as well as viewing your data via product, campaign or channel (or any combination of those), you can also break it down by location and save location-specific metrics for future use (just like the metric definitions we discussed above).
The benefit of TapClicks is that it is the only out-of-the-box software tool that lets you easily and automatically zoom in and out and analyze your omnichannel performance metrics from individual location level, to the overall level, and every other segment in between (see example below).
The TapClicks bubble chart allows you to hover over each location bubble where it will give you detailed information on the total sales for that particular country or city.
Check out our full article on the benefits of TapClicks for multi-location businesses here.
#3: Automate Powerful Visualizations of Your Omnichannel Campaigns
Many marketers rely on data teams to create their omnichannel analytics for them, either by doing this manually or by using tools (e.g. BI tools) to help them.
With TapClicks, because all your omnichannel data is in one place and you've set up and defined your product and campaign metrics (#2 above), you can easily create your omnichannel analytics right within the TapClicks platform. This is done simply by filtering your data, in two ways:
Visualize Your Omnichannel Analytics within TapClicks Dashboards
Omnichannel data can be viewed via powerful dashboards in near real-time (updated daily). Most of our users choose to use our readymade dashboard templates as a starting point and these can be configured to include whichever widgets (metrics) you want.
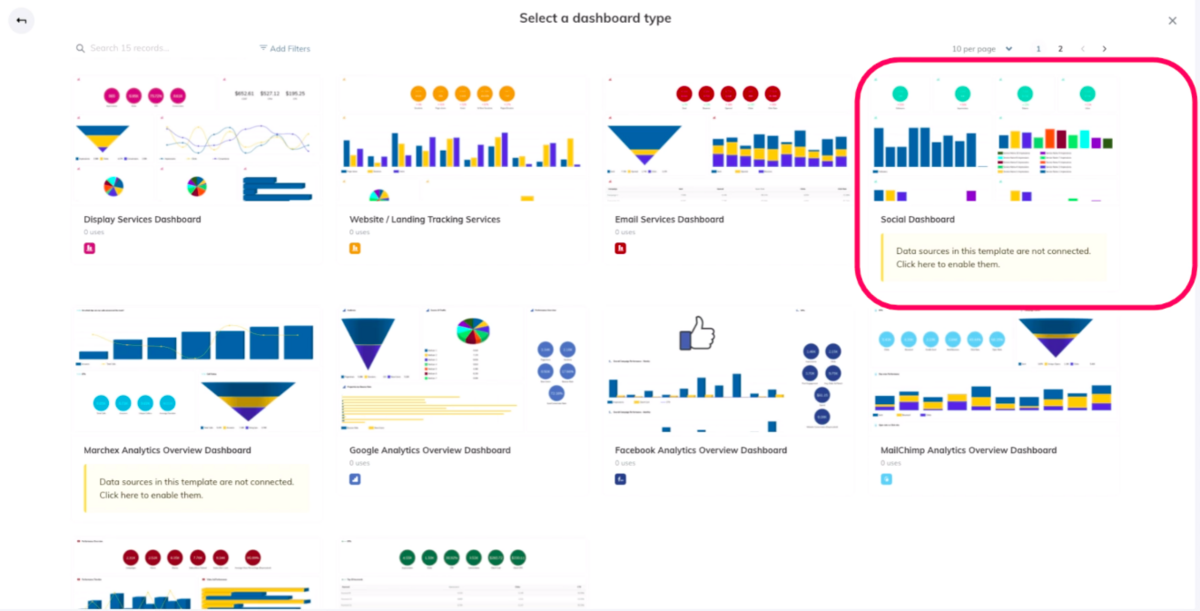
Unlike some analytics tools (e.g. BI tools), our dashboards are white-labeled so you can add your own branding and customize metrics for each marketing platform, sales source or retail location.
For example, below, we can see data for Facebook Ads for one particular location. Here we've branded the dashboard with their logo and colors for a hypothetical agency we created called Lucid.

Here, we've zoomed out to look at spend for three California locations.
This is possible because it was all configured at the start, so the data is pulled in automatically. You can view omnichannel data from as many retail locations as you wish by simply clicking to add the locations you want to include.

Apply Changes to Dashboard Templates Once Only
Once you've set up your dashboards to include whichever metrics and calculations you want, it's really easy to make changes and have those changes apply to all your dashboards.
For example, say you have 25 retail clients who use Shopify. You want to add a new metric to your Shopify dashboard. Instead of going into each of the 25 clients' individual Shopify dashboards and adding that metric manually, you can add it once to your Shopify template and the change will automatically be applied to all your Shopify dashboards. This is hugely efficient and time saving.
It's worth noting that you can make a change to just one dashboard, if you prefer.
View Your Omnichannel Analytics within PowerPoint-Style Reports
Not all omnichannel analytics tools have the capability of scheduling the distribution of reports to stakeholders. With TapClicks, the second way of viewing your omnichannel analytics is by using our ReportStudio solution where your omnichannel data can automatically populate PowerPoint-style reports and be scheduled for distribution to your chosen audience whenever you want (e.g. daily, weekly, etc.).
Here is a short video on how to schedule reports with TapClicks:
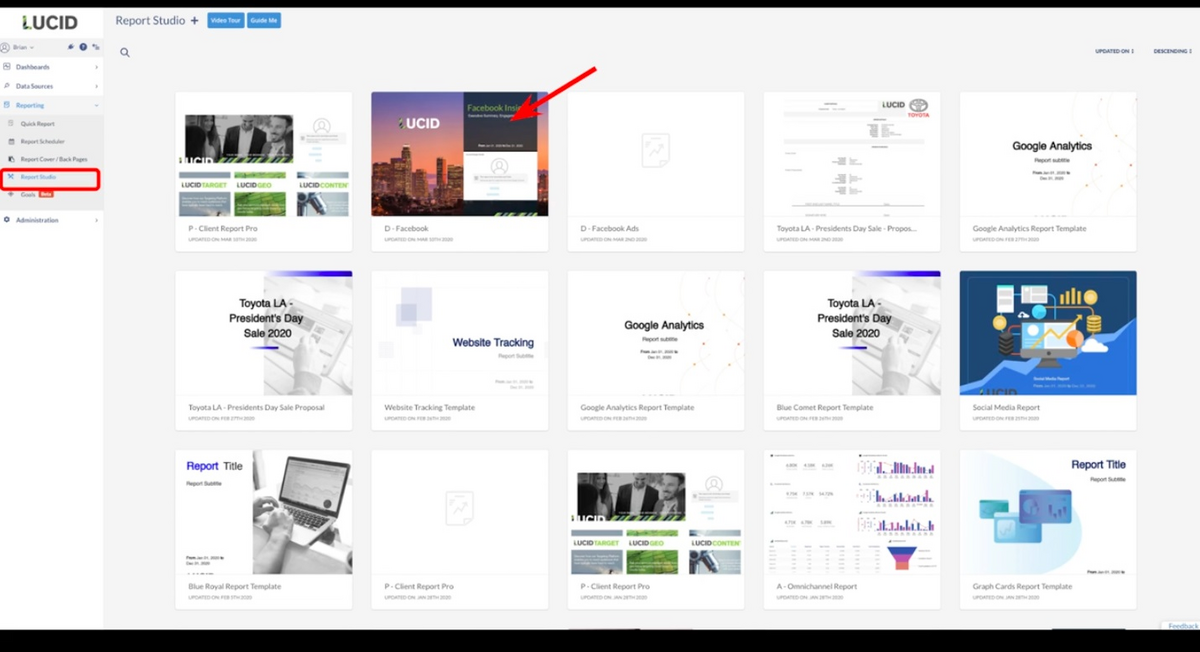
As with all elements of the TapClicks solution, you can use the metrics you already defined (#2 above) and these will be pulled across automatically to be used in whatever plots and graphs you want and updated with the latest data. You can set up and create reports for all your omnichannel campaigns and channels once only and it's done forever.
You can read more about omnichannel reporting here.
TapClicks Delivers Your Omnichannel Data to Other Platforms
If you use TapClicks to aggregate and store your data but you prefer to use another analytics or reporting tool, you can also push data out from the TapClicks platform to any other destination.
For example, if you use Tableau, you can push data from TapClicks to Tableau and likewise with Google Sheets.
These are just a few examples. With ReportStudio, you can schedule and automate when the data is sent out.
Use TapClicks for Your Omnichannel Marketing Analytics
For marketers, creating omnichannel analytics with tools that only do part of the job in the entire marketing lifecycle is a challenge. And if you have many brands or retail clients that require analytics, the work involved is complex and labor-intensive.
Using an end-to-end solution such as TapClicks allows you to gather data from all your omnichannel data sources, store it in your own data warehouse forever and create and define metrics once only so that they can be used in powerful omnichannel analytics and reports for your clients and stakeholders. All these tasks are marketer-friendly (no coding skills required) and can be scheduled to run automatically so you have more time to spend on your omnichannel marketing strategy.
If you think TapClicks could work as an omnichannel marketing analytics solution for your organization, you can try it free for 14-days or schedule a demo to learn more.