
Why The Best (and Most Interesting) Marketing Insights Come from Multiple Data Sources

Broadly speaking, a marketing insight is a piece of useful information about what activities are generating traffic, leads, and sales for the business that will, in turn, influence decision making. Marketing insights are typically gained from many sets of business data. For example, this could include how a particular campaign is performing, how sales revenue is driven, and whether messaging is reaching the correct customers.
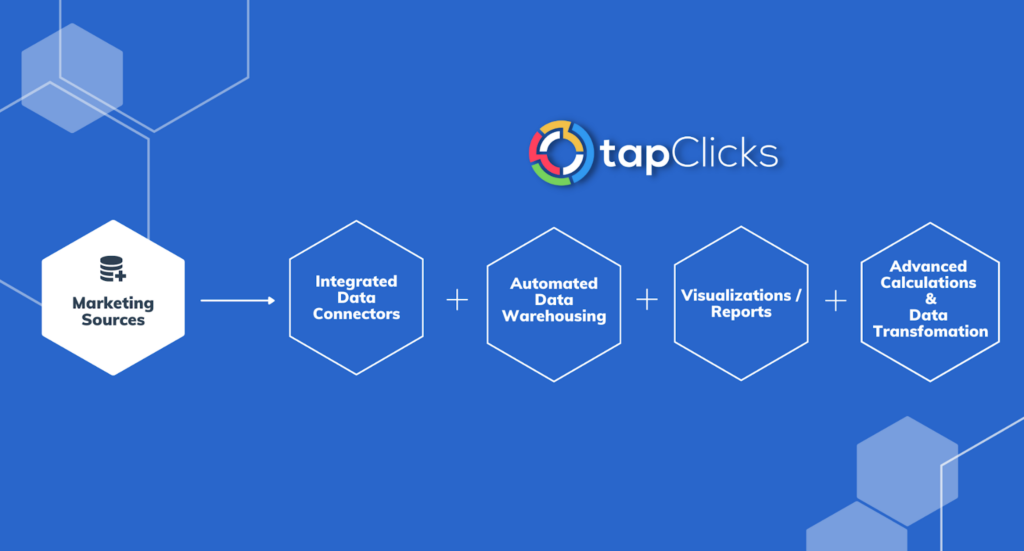
In this post, we'll explain the essential processes marketers need to maximize marketing insights. Then we'll show you how our software, TapClicks, helps generate marketing insights of real value from multiple data sources by:
- Gathering data from all your marketing sources as well as almost any other source.
- Storing your data forever in your own data warehouse where it can be accessed by marketers with no coding experience and used for marketing insights whenever you like.
- Analyzing your data into unique marketing insights by allowing you to do advanced calculations just once on any data metric that will be there for you to use indefinitely.
- Automating powerful visualizations that show your marketing insights from multiple sources via dashboards or PowerPoint-style reports.
If you think TapClicks could work as a marketing insights solution for your organization, you can try it free for 14-days or schedule a demo to learn more.
The Processes Marketers Need to Maximize Marketing Insights
Since the role of marketing is to drive revenue, almost all marketing insights can be traced back to these two questions:
- What activities are driving revenue for their clients/brands?
- What is the cost of that revenue?
But here is a key realization we've had after helping hundreds of brands and agencies analyze countless marketing data points: Answering these questions for a single channel is easy, answering them for multiple channels is more challenging.
For example, if an eCommerce brand wants to know how much revenue is being driven by Facebook Ads, it can just look up this information in Facebook and see conversions and cost per conversion. Perhaps they may want to corroborate Facebook's numbers with, say, numbers in Google Analytics, but it's a simple exercise regardless.
But what if you wanted to know how much revenue is being driven by a radio ad campaign, broadcast TV, or OTT ads? Radio ads don't have clicks that lead to web visits so it's not easy to track or understand the response or the revenue gained. Because of this, you have to correlate their data with other marketing data sources, like how online sales performed in a region where radio ads were run or how click costs of digital campaigns changed when the radio ads were on versus off. All of a sudden, the same two questions above become more challenging to answer because you're dealing with multiple channels.
And, what if you wanted to learn how different campaigns influence each other's performance? What if you wanted to see if programmatic display ads perform better in regions where you're also running social media ads or TV ads? This is an important question but non-trivial to answer because they require correlating data sets.
For example, you may learn that if you run a radio ad campaign in a certain region, it reduces the cost of your Facebook Ads in that area from $12 to $7. That's a valuable marketing insight.
Marketing insights gained from correlating data from multiple sources will give you the most valuable information on your marketing efforts so you can make business decisions that really impact your bottom line.
To be able to regularly generate these insights, marketing teams need the 4 essential processes we outlined earlier:
- Gather data from all marketing sources.
- Store it permanently in a place where marketers can easily access it without needing to call on data engineers.
- Easily analyze the data.
- Visualize and generate reports.
Below, we'll explain how TapClicks helps with each of these 4 processes.
Process #1: Gather Data from All Your Marketing Sources
The first essential step to generating non-trivial marketing insights that come from correlating data across multiple sources is having easy access to all marketing data in one place.
If you don't, it's time-consuming and logistically complicated for rank and file marketing employees to regularly correlate marketing performance data across multiple sources, and it won't be done often enough to regularly generate these insights. They'll have to download data from a data source and put it in a spreadsheet for each digital marketing campaign or data set, then organize and normalize the data so it's all consistent.
This is extremely time-consuming. Plus, the more friction your team has in doing marketing data analysis, the less of it they'll do, and the less marketing insights they'll generate.
Organizations who want to routinely generate good marketing insights need software or tools that pull data from multiple marketing platforms and data sources into one place.
How TapClicks Helps
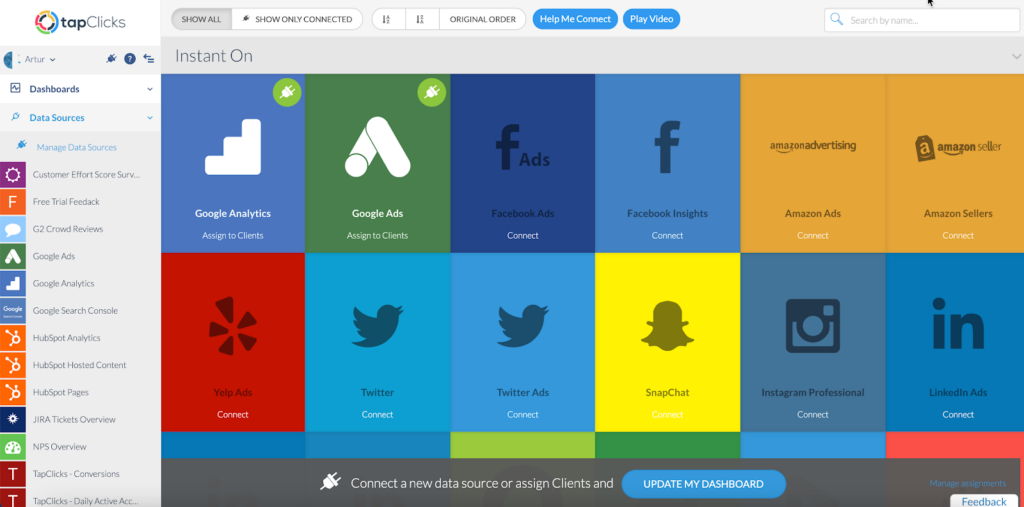
With TapClicks, you can connect to all of your sales and marketing data sources and pull that data into a single location so your marketing team always knows they can find the data they need inside of TapClicks.
To date, we have connected to over 6,000 data sources via our Smart Connector tool, including proprietary and offline data sources (e.g., customer insight or customer loyalty information). With this tool, TapClicks users can essentially build their own connection (or our team can help build one) to any data source (including home built or even offline data sources) and be able to access it for insight marketing.
Here's a short video showing how to create a Smart Connector:
In addition, TapClicks also has hundreds of pre-built API-based data connections that can be instantly turned on to the most popular marketing platforms you would expect, such as Facebook Ads and Twitter Ads as well as broadcast platforms such as Wide Orbit and Marketron.
Once you've set up your connections, TapClicks will extract data automatically every day or whenever you choose to refresh it. In many cases, we can extract 12 months of historical data, too, so you can incorporate this into your insight marketing analytics, resulting in deeper insights from the get-go.
Another benefit of using TapClicks to gather your data is that we manage the API connections for you, rather than your development team having to build API connections and manage them with each platform individually. You don't need to worry about any connections breaking because the TapClicks team will take care of it for you.
Removing the need for your marketing team to spend hundreds of hours each month gathering data and number crunching it in spreadsheets saves a massive amount of time which can be better spent on producing valuable marketing insights that influence your marketing strategy and business initiatives.
Process #2: Store Your Data Forever in Your Own Data Warehouse Which Requires No Coding Experience
It's one thing to connect to data sources and pull data, but if all that data is stored in different places or in a SQL database that only data engineers can access, it's not helpful for your marketing employees to be able to quickly dig into that data and correlate different marketing campaign performance and insights.
To get around this and to minimize the inevitable wait times in getting hold of data from busy data teams, a central data warehouse that's accessible to marketers with no data engineering skills is the second essential process needed for creating marketing insights.
How TapClicks Helps
With TapClicks, all the data sources you have connected to (#1 above) are pulled into your own fully-managed TapClicks data warehouse. No coding or data engineering skills are required, so the data can be accessed at any time which is critical for marketers.
The data is stored in your TapClicks data warehouse forever, ready to be drawn on whenever needed for marketing analytics and insights.
You can read more about our TapClicks marketing data warehouse in this article.
Storing your data where it can be accessed by marketers with no coding experience and used for marketing insights whenever you like cuts through many unnecessary and time-consuming processes we outlined earlier (e.g., downloading data sets from different platforms, using multiple spreadsheets, etc.).
Process #3: Create Unique Marketing Insights by Doing Advanced Calculations on Multiple Data Sources
The third essential step to creating deep, non-trivial marketing insights is the ability to do advanced calculations and customize metrics from multiple data sources.
While there are some tools (e.g., ETL Extract, Transform, Load tools) that will help transform or normalize data (e.g., making data sets consistent by removing columns or mapping unstructured data), they do not have the functionality to do the complex calculations needed by marketers to create marketing insights from multiple data sources.
As we mentioned in #1 (above), most marketing teams do this by juggling several complicated spreadsheets and manually calculating the metrics needed for their insights. This is hugely time-consuming and because of the complexity of the work, it is less likely to be done meaning that fewer valuable marketing insights will be generated.
How TapClicks Helps
With TapClicks, you have all the data sources you need being pulled into your TapClicks warehouse (#1 and #2 above), and you can set up custom metrics and calculations to create deep insights from your marketing data. And the beauty of TapClicks is that you can create or define a new metric just once and use it for any data analytics or reports thereafter.
Example: Combining Metrics for Marketing Insights across Platforms
Marketers often deal with metrics from different platforms that have unique names that mean the same thing (for example a social media agency may track follows on Twitter or Facebook and subscribes on YouTube as engagement).
Reporting on that every month is tedious every month each metric has to be added up and tracked on a spreadsheet.
With TapClicks, you can decide what you're going to call a particular umbrella metric across a variety of platforms and the TapClicks software will categorize it for you so you can view and compare the data together.
For example, you could create a new term inside TapClicks called Total Social Engagement and define it as the sum of post reactions on Facebook, views on YouTube, or click-throughs on LinkedIn(see below).


Once you've defined the custom metric, you can set up which social media data you want to be included and it will be used for everything dashboards, reports, campaigns, and clients. This saves a huge amount of time and gives you meaningful marketing insights automatically with very little work involved.
Example: Marketing Insights across Multiple Locations
If you run a business with multiple locations, or if you have clients who have several locations, creating marketing insights at a granular level is challenging the same manual and tedious processes we've talked about in this post apply here, too.
But with TapClicks, if you want to analyze social media campaigns at different location levels, you can easily combine stats at local, regional, or national levels.
For example, if you were running social media campaigns for a car dealership, you might want to look at social media spend for one specific dealership. Or you may want to group together, say, three dealerships in a certain area (see below). Any of this can be done with TapClicks.
You can also view your performance data for the entire car dealership:

TapClicks has a default mapping function which means you can report on social media campaigns for an individual location right up to an overall company level as well as every other segment in between. You can hone into whatever location you want to view data for by hovering over that area on a map zooming in and out of cities, countries, or even globally.
Widgets can be configured so you can view the data as you wish (e.g., CTR by month), shown below, and you can then view this by location where the data will update dynamically.

Categorizing by target audience (or any other metric) by simply using the filters within TapClicks opens up a whole world of deep marketing insights that can be easily created by marketers.
Process #4: Automate Powerful Visualizations & Reports for Your Marketing Insights
Many marketers who don't have data teams spend time manually combining insights from individual platforms to create visualizations and reports. Or, they may use a separate BI (business intelligence) tool to do this for them. Either way, marketers are either reliant on other tools or departments to do the work for them or they have to spend dozens of hundreds of hours doing it themselves every week or month.
How TapClicks Helps
Once you've set up your metrics and calculations (#3 above), you can view multiple data sources in powerful visualizations by filtering in two ways:
Visualize Your Marketing Insights within Dashboards
Marketers can view their marketing insights via dashboards in near real-time (typically updated daily). Because the TapClicks dashboards have been designed to be scalable, single dashboards of visualizations can be used as templates and applied across dozens of hundreds of dashboards, campaigns, and clients.
Marketers can also create one dashboard for a specific type of marketing insight report and filter the data to each client. The benefit of this is that you can make a change to just one report and the change will apply to all clients instantly.
Here's a video that shows you how to create a dashboard:
View Your Marketing Insights within PowerPoint-Style Reports
With TapClicks, sharing your marketing insights with stakeholders and clients is simple. Our reporting solution, ReportStudio, automatically populates PowerPoint-style reports. These can be scheduled to be sent out to your chosen audience whenever you want (e.g., daily, weekly, monthly, etc.).
Here's a short video on how to schedule reports with TapClicks:
You can also distribute data to any other third-party platform, for example, Tableau or Google Sheets.
Want to Try TapClicks as Your Marketing Insight Platform?
With TapClicks, you can easily fulfill all 4 essential processes that marketers need to follow in order to create meaningful and valuable marketing insights from multiple data sources.
TapClicks offers a flexible and scalable solution for enterprise-level marketers who want to create marketing insights for dozens or hundreds of stakeholders or clients.
If you think TapClicks could work as a marketing insights solution for your organization, you can try it free for 14-days or schedule a demo to learn more.