
Marketing Agency Reporting Tools: What to Consider (+ 6 Tools)
Marketing Agency Reporting Tools: What to Consider (+ 6 Tools)
Marketing agencies manage large amounts of marketing data across multiple marketing channels, including Google Analytics, Google Ads, LinkedIn Ads, and social media platforms. Tracking key metrics and optimizing marketing campaigns requires marketing reporting tools that automate data collection, visualize campaign performance, and simplify client reporting.
But without the right reporting software, agencies waste time on manual reporting, struggle with fragmented data sources, and risk errors that affect decision-making.
In this article, we’ll cover the four factors to consider when choosing marketing reporting software. We’ll also list some of the best tools that can help with your marketing reports.
What Are Marketing Agency Reporting Tools?
Managing data from different marketing channels without a structured system can result in inefficiencies, errors, and delays in decision-making.
Marketing agency reporting software solves this problem by automating data collection, consolidating insights, and presenting clear cross channel reports for agencies and their clients. These tools allow agencies to measure marketing efforts accurately and improve campaign strategies with real-time insights.
A well-designed marketing agency reporting software can integrate with various platforms to pull data, apply data visualization, and generate structured reports.
Instead of relying on manual reporting, agencies can use an automated marketing reporting tool to create reports based on pre-set templates, custom metrics, and specific client needs. Agencies can then track key metrics like conversion rates, ad spend, and audience engagement while eliminating time-consuming data entry tasks.
Recommended Reading
Five Benefits of Digital Marketing Reporting Tools
4 Factors to Consider When Choosing a Marketing Agency Reporting Tool
Selecting the right marketing agency reporting software is important for tracking marketing performance, optimizing marketing efforts, and providing clients with accurate insights.
With many options available, agencies must evaluate key factors to find the best reporting solution that fits their needs. Below are four useful factors when choosing a marketing reporting platform.
1. Direct Integration with Marketing Platforms for Automated Data Import
For a marketing agency, the first step in creating weekly or monthly reports for clients involves importing data from various marketing platforms used to run campaigns.
Most modern marketing reporting tools offer some level of integration with major platforms, but many connect only to a limited set, primarily focusing on common digital ad platforms like Google Ads, Facebook Ads, and Bing Ads.
But if you're a marketing agency handling enterprise-level accounts, chances are you have campaigns running on obscure and non-social media platforms like Radio Ads, TV Ads, and Podcast Ads (we'll list a few more examples below).
When a reporting tool lacks integration with these platforms, you must manually import data from each source into spreadsheets, perform calculations, create graphs, and compile reportable insights—a process that is both time-consuming and inefficient.
We once spoke to a marketing manager who said he was spending 27 hours a week just pulling in data from his marketing campaigns.
If only a part of your campaign data is automatically pulled in and a part is not, then the fundamental problem of saving time and reducing your marketing efforts through an automated marketing reporting tool doesn't get solved.
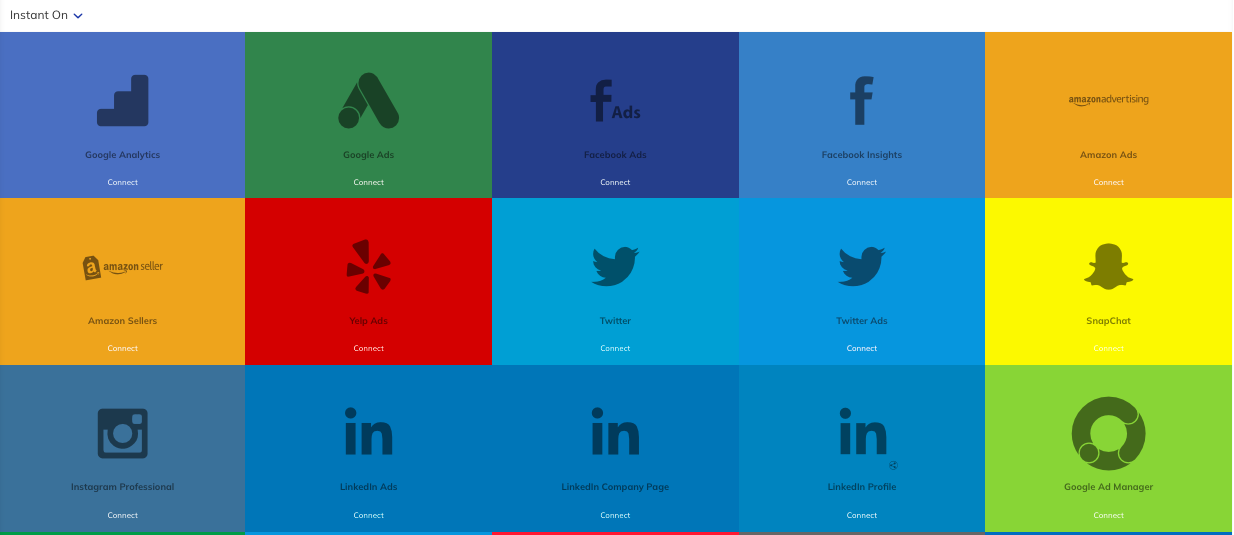
Direct Data Integrations with 250+ Marketing and Ad Platforms Save Hundreds of Hours of Manual Work
TapClicks offers direct integrations with 250+ marketing and advertising platforms, providing more connectivity than many competitors. These instant-on connectors allow agencies to pull real-time data from various marketing sources within hours, eliminating the need for manual imports.
Many connectors also retrieve historical data, so you can immediately start analyzing past results.
Below is a list of common digital marketing and advertising platforms TapClicks has instant-on connectors with:
-
Facebook Ads
-
Google Analytics
-
Google Ads (Adwords)
-
Instagram Business
-
LinkedIn Ads
-
Pinterest Ads
-
Quora Ads
-
HubSpot
-
Twitter Ads
-
Google Analytics
-
Microsoft Ads
Other less-common digital media platforms:
-
QuickBooks Online
-
Dropbox
-
Microsoft Azure SQL
-
Craigslist
-
Hulu
-
Adobe
-
Genius Monkey
-
FTP
-
TripAdvisor
-
Choozle
-
Marchex
-
Marketo
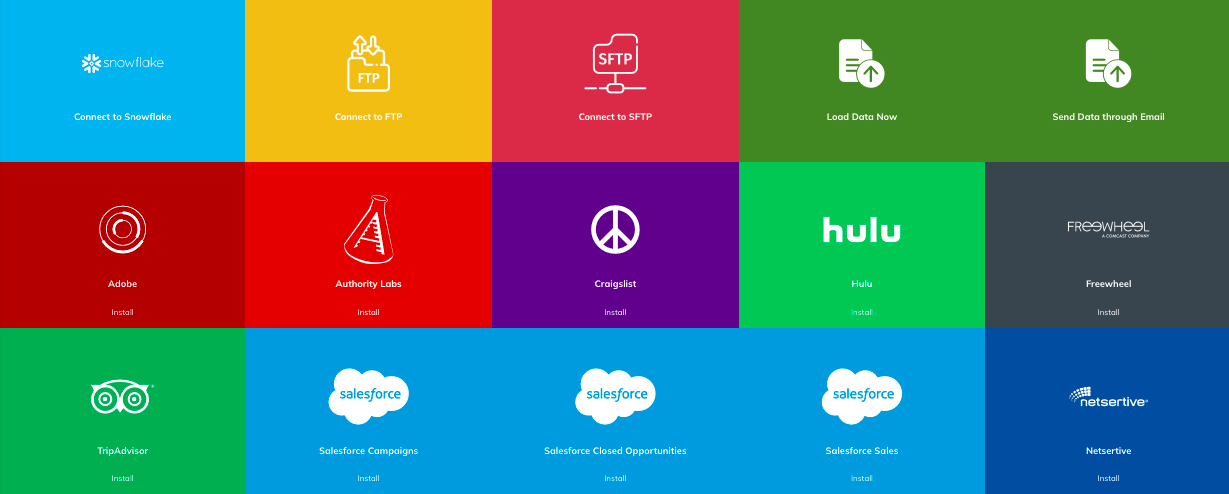
Connecting to all of these platforms is simple and can be done without any coding experience or API expertise.
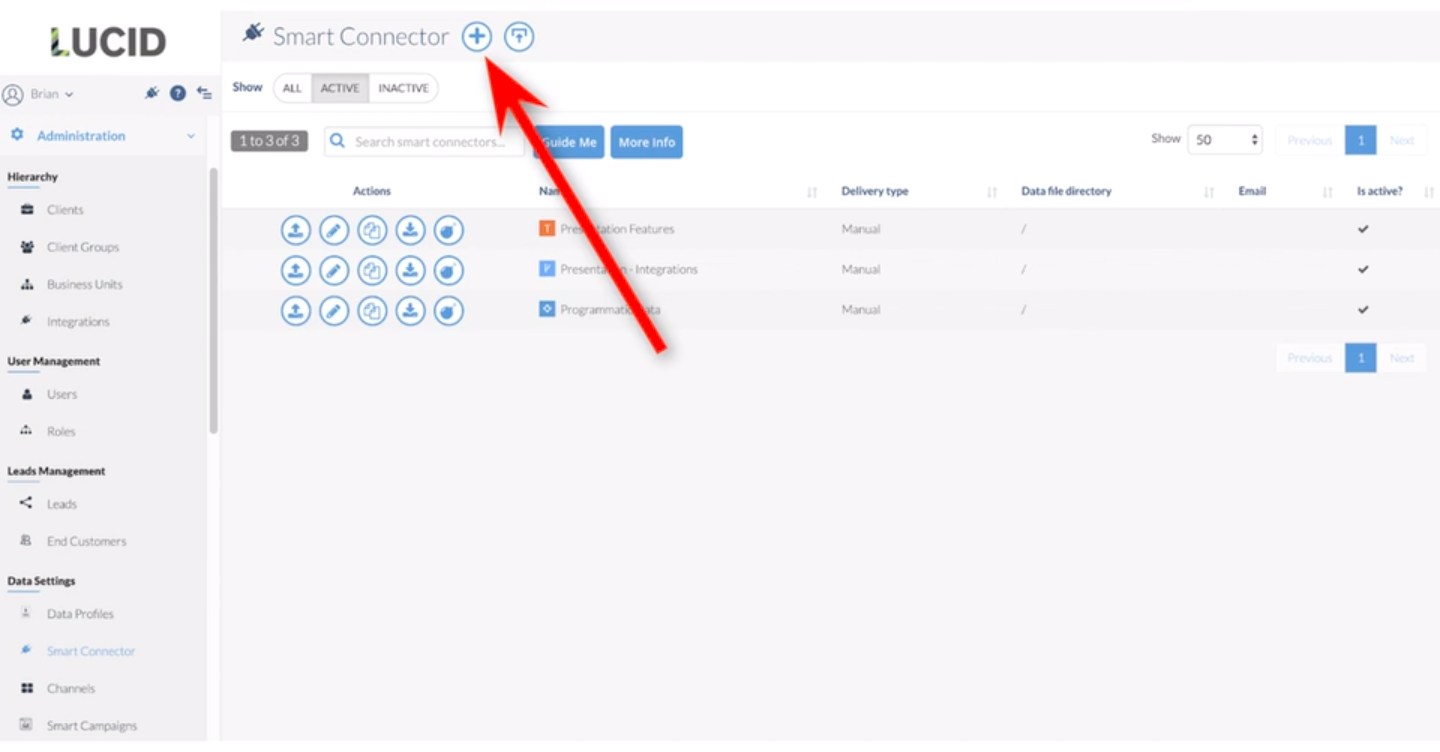
Custom API Connections for Platforms Without Native Integrations
While TapClicks provides native integrations with hundreds of digital marketing platforms, some agencies may need to connect to local, proprietary, or non-native data sources. In such cases, TapClicks offers a Smart Connector, a custom API connection, called a Smart Connector, designed to pull data from virtually any platform.
With it, agencies can integrate unique data sources into their marketing reporting software, ensuring that all relevant marketing performance metrics are included in their automated reports.
Additionally, the TapClicks development team manages and updates these API connectors to stay in sync with the latest versions of any marketing platform's API.
If a platform like Instagram updates its API, you don’t have to worry about broken connections or contacting the platform’s support team. TapClicks ensures that integrations remain fully functional without any disruption to marketing reporting.
This review from Capterra perfectly sums it up:
Recommended Watch
1 How to Create a Smart Connector
2. Automated Data Calculations to Extract Key Marketing Metrics
Marketing managers spend a lot of time converting raw marketing data into custom reports for clients. Turning granular campaign data into meaningful marketing performance insights often requires extensive data calculations across multiple marketing channels.
Without automation, agencies must manually analyze trends, compare platforms, and calculate key metrics like cost per engagement, conversion rates, and customer acquisition costs.
Clients frequently request reports that include:
-
Performance comparisons across platforms like Instagram Ads, LinkedIn Ads, Pinterest Ads, TV, Podcasts, and Radio to determine which channels deliver the best results.
-
Total cost metrics, including cost per engagement, customer acquisition cost, and cost per conversion across all marketing campaigns.
-
Website analytics, such as total visits, backlink analysis, impressions, clicks, and conversion rates, using data from SEO, PPC, email marketing, and ad campaigns.
-
Social media engagement, tracking average comments, shares, and interactions across multiple platforms.
-
Conversion tactic analysis, evaluating the impact of different CTAs, headlines, and page designs across hundreds of landing pages.
Manually generating these client reports takes hours, especially when clients request weekly or monthly updates. TapClicks eliminates this workload by automating data calculations, allowing agencies to define custom metrics once and reuse them for future reports.
Example #1
If you need to report monthly on total engagement across Facebook, Twitter, YouTube, and Instagram, you typically have to pull engagement metrics separately for each platform, sum the totals manually, and repeat the process every month.
With TapClicks, you can create a new metric called Total Engagement, defining it as the sum of likes, retweets, views, and comments across all platforms.
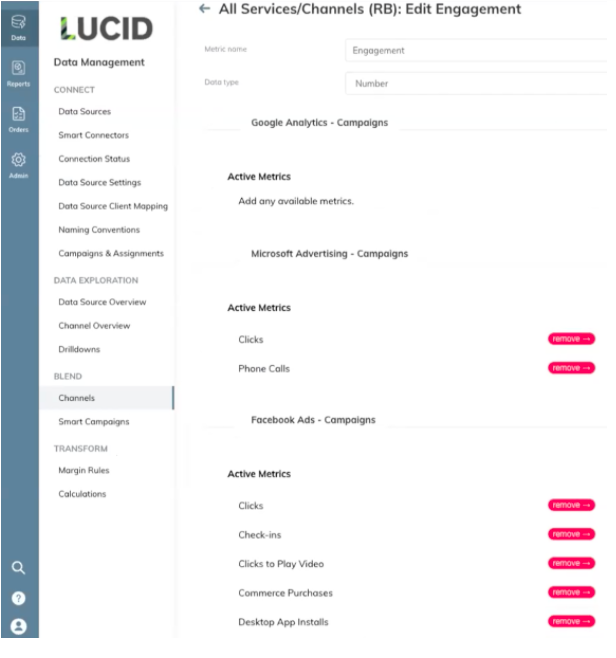
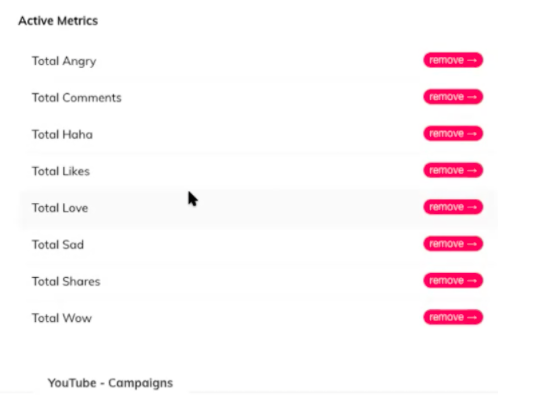
Once the Total Engagement metric is defined, it remains available for use in any report, PowerPoint presentation, dashboard, or calculation. You no longer need to manually sum engagement metrics each time, as the data updates automatically for every report.
Automating Advanced Calculations: Custom Metrics and Conditional Logic
While automating engagement metrics is beneficial, agencies often need more advanced calculations using if/then statements based on specific campaign names. TapClicks allows marketers to set up these calculations with ease, ensuring accurate data aggregation across different campaigns.
For example, a tire manufacturing company running 266 Facebook ads across five locations may need a structured way to group and analyze results efficiently.
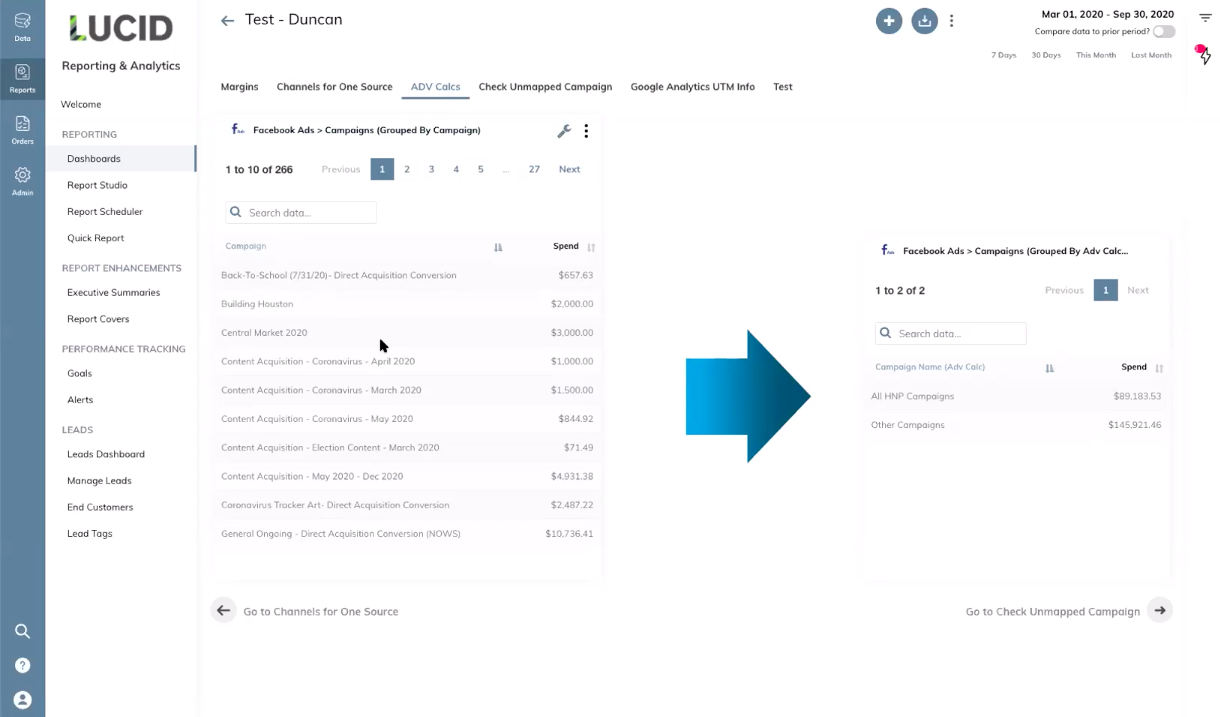
Additionally, tracking total ad spend for a specific product category within multiple campaigns can be challenging. For instance, if the company wants to calculate total ad spend for campaigns containing "HNP" in their names, the process typically requires manually identifying each relevant campaign and summing the spend.
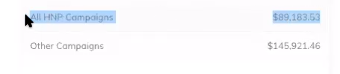
With TapClicks, this calculation is fully automated. By defining a custom metric called "All HNP Campaigns," the system scans campaign names for the "HNP" keyword and aggregates the ad spend automatically.
Instead of manually sorting through 266 campaigns, the agency can instantly filter and analyze the 191 relevant campaigns containing "HNP," saving time and improving accuracy.
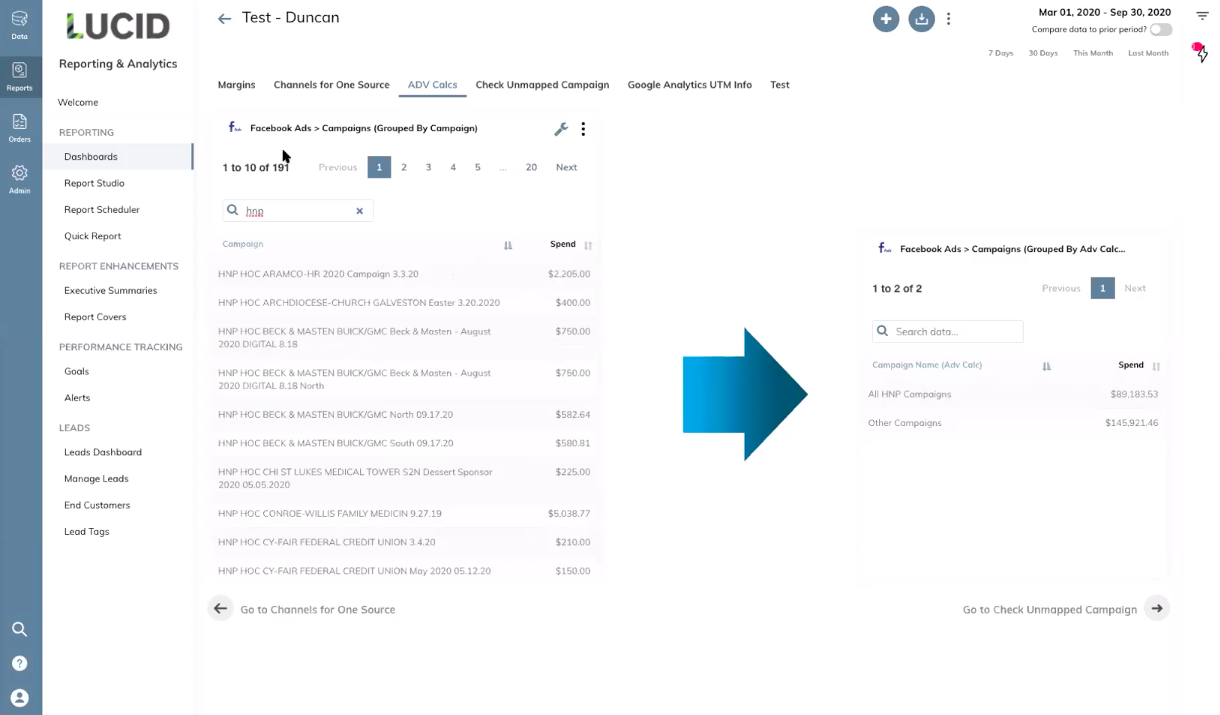
With advanced calculations, the total ad spend for all HNP campaigns is now displayed in a single line.
Example #2
One of TapClicks' clients faced an attribution challenge while running ads for their laptop products. Their campaigns included Reddit ads and other platforms, but they needed a way to track how those ads contributed to laptop sales on Amazon.
Using TapClicks’ advanced calculations with If/Else statements, they configured the system to scan Amazon sales data for the word "Reddit."
When a match was found, TapClicks automatically summed the ad spend and sales data related to Reddit campaigns. This allowed the client to determine that they had spent $3,000 on Reddit ads and directly measure the revenue generated from that investment.
With TapClicks, agencies can create almost any custom calculation needed to analyze marketing data across platforms. Once configured, these calculations can be reused in client reports without additional manual effort.
3. Customizable Dashboard Templates for Scalable Data Visualization
After automating data collection and key calculations, the next step is presenting insights in a structured, visual format. A marketing agency reporting software should allow agencies to create dashboards that help clients easily interpret marketing performance across PPC, email marketing, SEO, and other marketing efforts.
Most marketing reporting tools offer basic graphing, visualization, and dashboard features, but larger agencies managing multiple clients need scalable reporting solutions. The best marketing reporting platforms should allow agencies to make changes across dozens or even hundreds of dashboards without manually updating each one.
Without this functionality, agencies face unnecessary manual work. If an agency using Google Data Studio manages 100 different clients, it must create 100 separate dashboards. If the agency decides to add a new metric, such as:
-
Total TV ad spend over time
-
Web traffic trends are reported differently
-
New engagement tracking metrics for social media platforms
-
Additional insights into paid ad performance across multiple marketing channels
They would need to manually update every client dashboard, creating a time-consuming and inefficient process.
A marketing reporting software solution with customizable templates eliminates this issue. Agencies can update one template and apply changes instantly across all client dashboards, saving time and maintaining consistency in client reporting.
Automated Dashboard Updates with TapClicks Templates
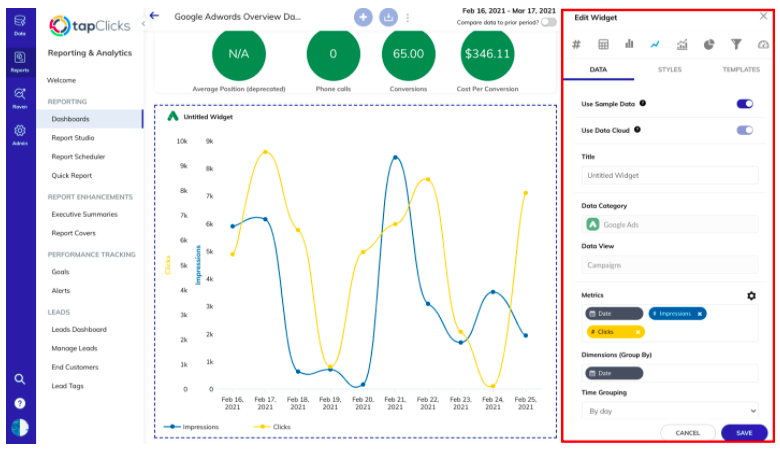
In TapClicks, every element within a dashboard functions as a template, allowing for seamless updates across multiple client dashboards.
If a change is made to a single element within the template dashboard, it automatically applies to all connected dashboards. For example, if an agency wants to add a new graph for TV ad spend, they only need to update the template dashboard, and all associated dashboards will reflect the change instantly.
TapClicks allows agencies to template not just individual visuals or widgets but also entire dashboards. This means agencies can:
-
Apply updates across all client dashboards at once
-
Maintain flexibility by allowing custom elements for individual clients
-
Ensure consistency in reporting while reducing manual updates
With this automated reporting solution, agencies save time and avoid the repetitive work of adjusting each marketing dashboard manually.
Agencies using TapClicks can also choose from predefined dashboards and customize them to fit specific client reporting needs. This flexibility allows marketing teams to quickly set up marketing performance tracking while tailoring reports to highlight key metrics relevant to each client.
Case Study of How TapClicks Helped ImageMark Save Over 48 Hours a Month with Automated Dashboards
ImageMark is a full-service marketing agency based in North Carolina.
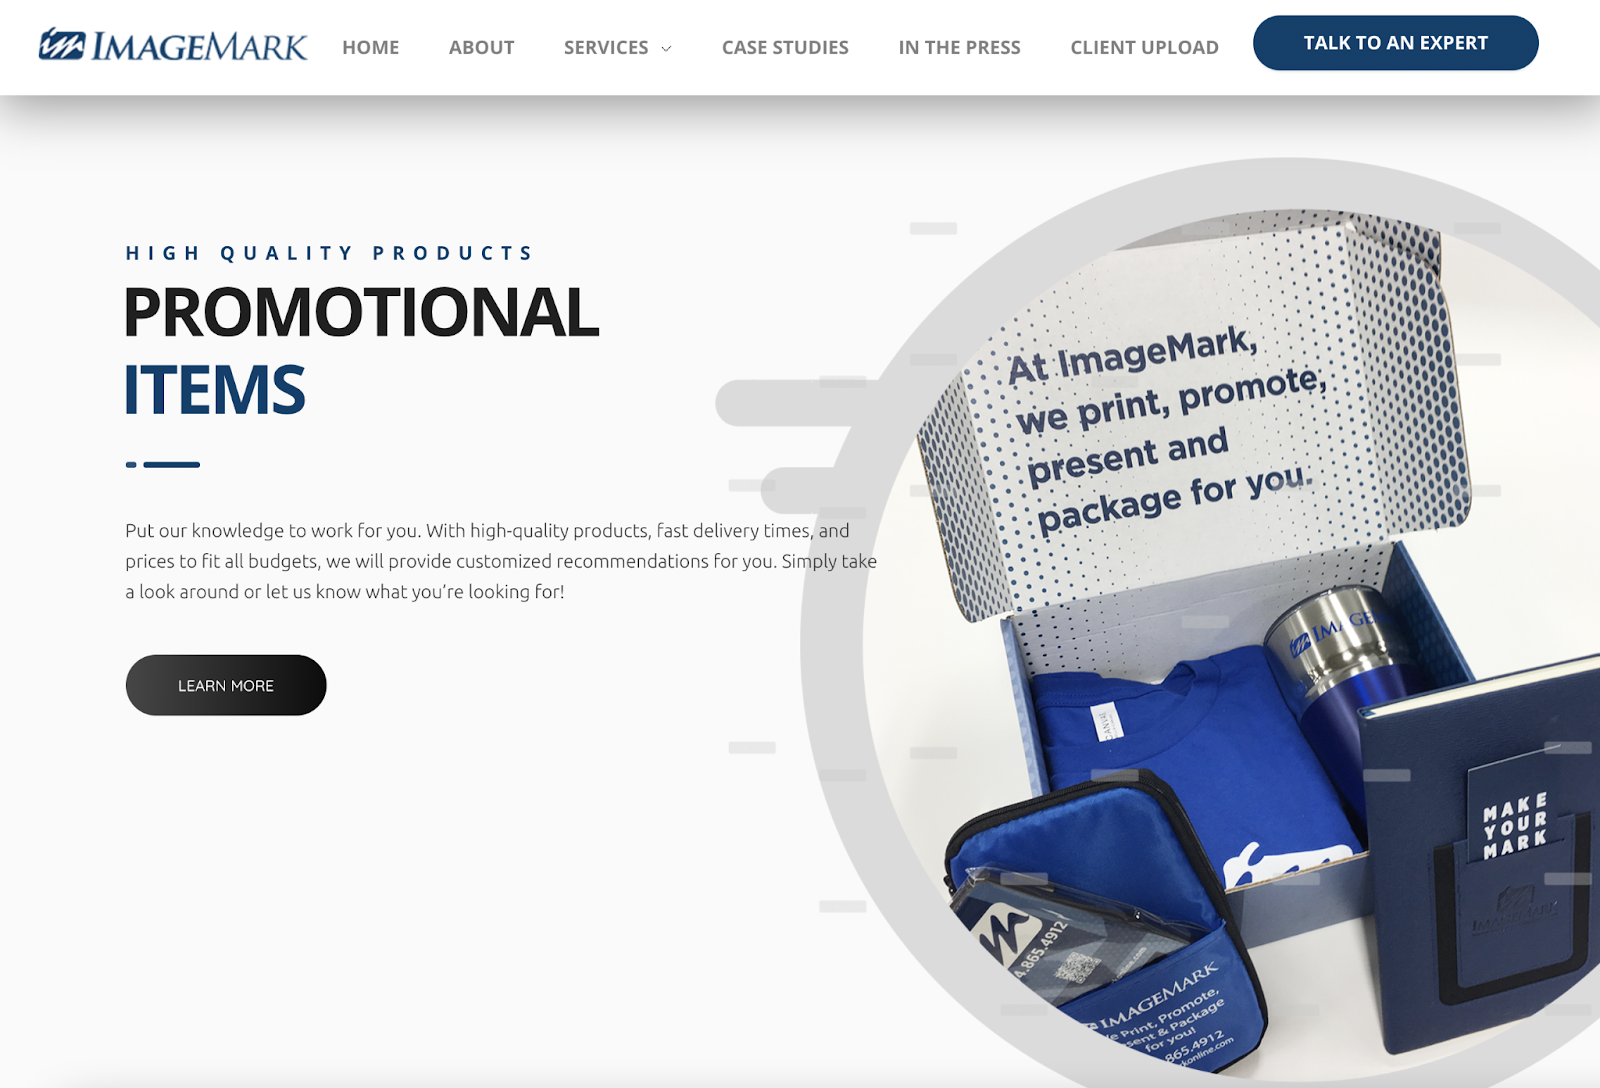
Before switching to TapClicks, Chris Downing, Digital Marketing Manager at ImageMark, relied on Canva for data visualization in reports. The process was slow, manual, and inefficient for managing multiple clients.
Exploring different marketing reporting tools, he encountered the same issue—each client required a separate custom dashboard for monthly analytics. This setup meant spending two to three hours per report per client, adding up to over 48 hours per month for 16 clients. The workload made it difficult to improve marketing performance and focus on marketing efforts.
TapClicks introduced a custom, scalable dashboard, connecting all client data in one place. Adjusting views for individual clients became effortless, allowing access to real-time analytics and quick generation of custom reports without repetitive manual tasks.
The new system eliminated unnecessary frustrations and freed up time for deeper insights and strategy improvements.
Recommended Reading
TapClicks Saves Imagemark Over 48 Hours a Month on Reporting
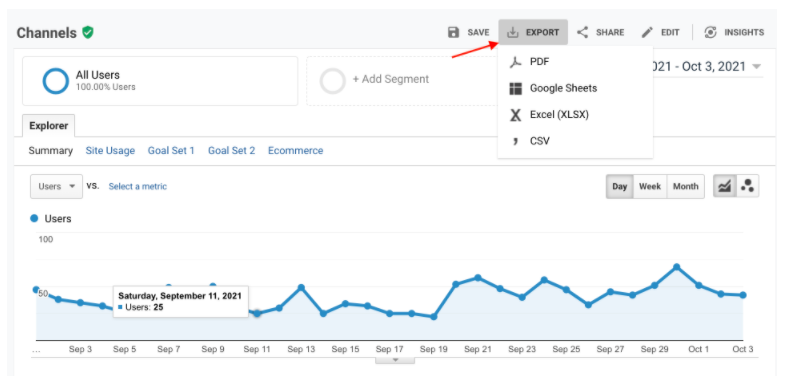
4. Automated Presentation and PDF Reports to Avoid Manual PowerPoint Creation
Dashboards provide agencies with quick access to marketing performance data, reducing the time spent pulling data from various marketing campaigns. However, many clients prefer receiving PDF, PPT, or Keynote reports as email attachments for easier review and reference.
Creating these reports manually is a repetitive and time-consuming process. Many agencies take screenshots of dashboards or manually generated graphs and insert them into presentations one by one.
Account managers often repeat this process every month or even more frequently, leading to hundreds of hours wasted on assembling digital marketing strategy reports instead of focusing on analysis and optimization.
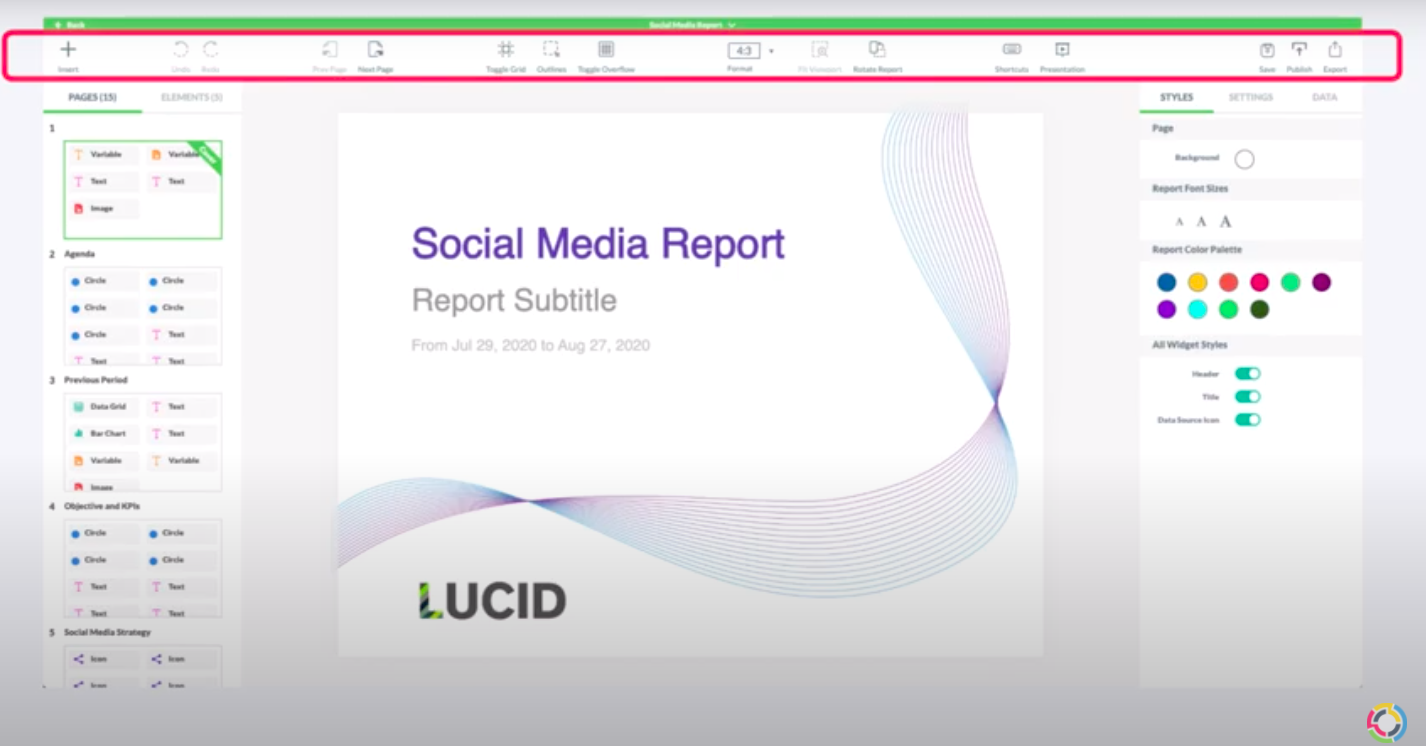
To solve this problem, TapClicks introduced Report Studio, a built-in presentation builder designed to generate automated reports in PowerPoint or PDF formats. This feature allows agencies to create monthly reporting slides using customizable templates, so there’s no need for manual screenshot uploads.
Drag and drop functionality makes it easy to add metrics, graphs, and widgets, which automatically update whenever the presentation is opened, saved, or exported.
With Report Studio, agencies can generate custom reports instantly while ensuring the latest marketing performance data is always reflected. This feature helps teams save dozens or even hundreds of hours per month, allowing them to focus on strategy rather than manual report creation.
Stop Wasting Hours on Manual Reports—Let TapClicks Do the Work!
Automated Report Generation and Scheduled Client Delivery
TapClicks automatically generates presentations with each widget, graph, or number updated in real time. The reports are then emailed as attachments directly to clients.
All you have to do is schedule these reports (you can even white label them) as monthly, weekly, or bi-weekly and have them sent to your agency's clients as an attachment automatically.
One Capterra reviewer said this about the report scheduler feature:
Recommended Watch
How to use Report Studio - TapClicks
6 Best Marketing Agency Reporting Tools To Consider
Below is a list of the 6 best marketing reporting tools that help agencies optimize marketing efforts and streamline the reporting process.
1. TapClicks
TapClicks is a comprehensive marketing intelligence platform designed for agencies that handle large-scale, multi-channel marketing campaigns. It offers instant-on connectors with over 250+ marketing platforms, making it one of the most integrated marketing reporting solutions available.
Key Features:
-
10,000+ data connections with platforms like Google Analytics 4, TikTok Ads, and Amazon Ads.
-
Automated reporting and analytics with real-time insights.
-
Customizable dashboards to track key marketing performance metrics.
-
Smart Connector imports offline and third-party data.
-
TapWorkflow improves project management and team collaboration, keeping tasks organized and workflows more efficient.
Pricing Plans:
-
TapDataLite: Starting at $99 per month. Ideal for small companies, the package includes 64 connectors and SmartConnector™ Basic.
-
TapData+: Starts at $349 per month, designed for growing businesses, it offers an expanded set of connectors (250+) and advanced features.
-
TapData Max: Starts at $649 per month and is tailored for enterprises, this package provides the most comprehensive set of tools and integrations.
Book a demo and start a free trial to get your custom-built dashboards.
2. Google Data Studio (Looker Studio)
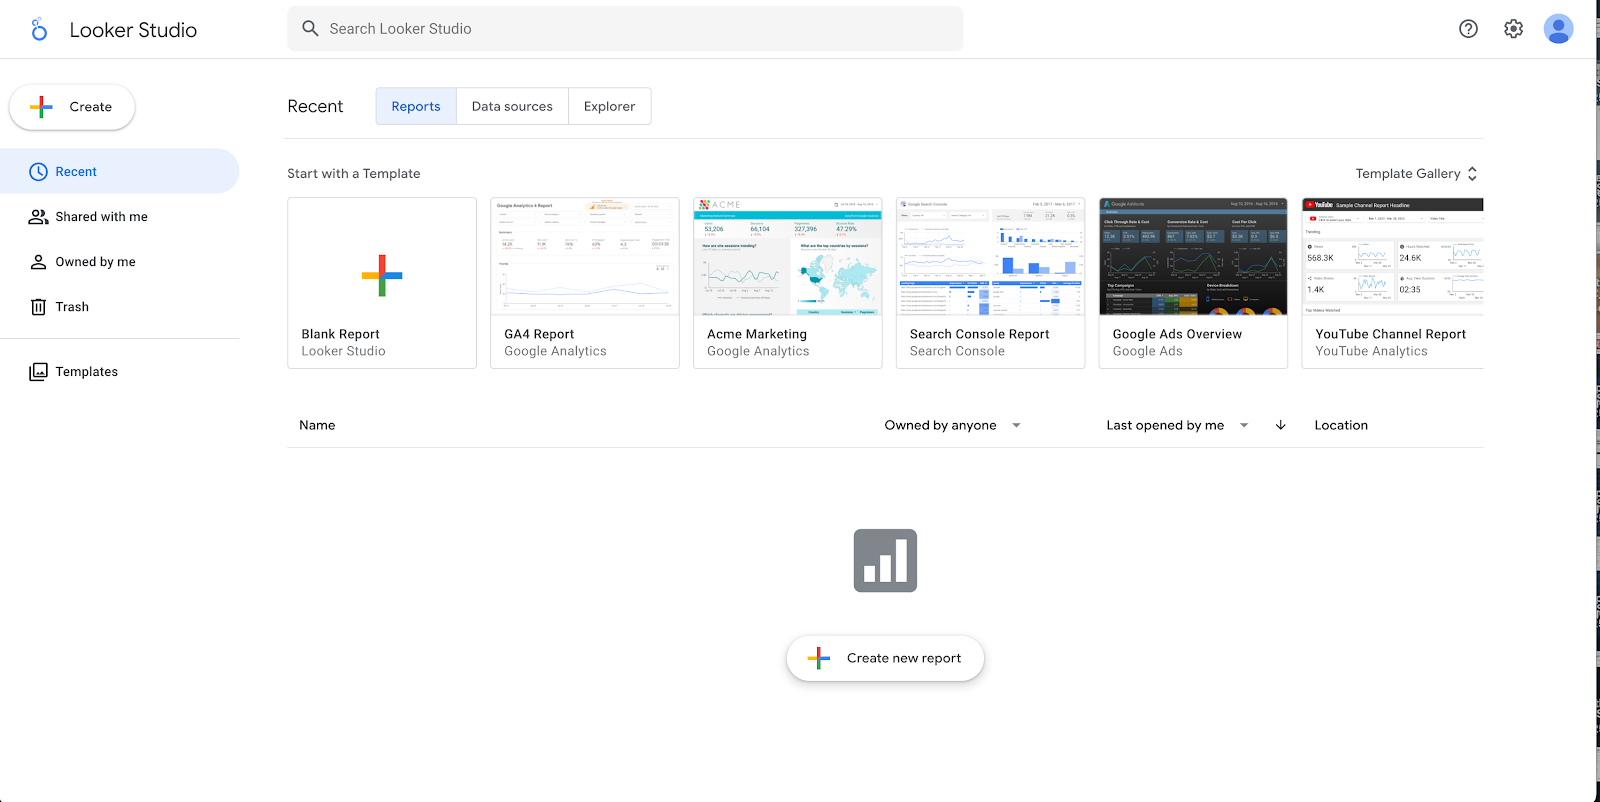
Source: lookerstudio.google.com
Google Data Studio, now called Looker Studio, is a free marketing reporting platform that connects with Google Analytics, Google Search Console, Google Ads, and third-party marketing tools. It allows agencies to create fully customizable reports with interactive data visualizations.
Key Features:
-
Free and highly customizable reporting dashboards
-
Seamless integration with Google’s marketing ecosystem
-
Drag-and-drop report builder for quick dashboard creation
-
Advanced data blending for combining multiple data sources
Pricing Plans:
-
Free: Offers unlimited report creation and data source connections within the Google ecosystem and select third-party platforms.
3. AgencyAnalytics
Source: Agencyanalytics.com
AgencyAnalytics is a reporting platform specifically built for agencies focused on SEO, PPC, and social media management. It provides pre-built marketing reports that integrate with over 70+ tools, including Google Analytics, Facebook Ads, and rank-tracking software.
Key Features:
-
SEO reporting suite with rank tracking, backlink monitoring, and site audits.
-
PPC dashboards for tracking Google Ads, Facebook Ads, and Bing Ads.
-
Automated reports are delivered to clients at scheduled intervals.
Pricing Plans:
-
Launch Plan: Priced at $79 per month, includes 5 clients, unlimited reports, report scheduling, access to over 80 integrations, a client access portal, and basic branding.
-
Grow Plan: Priced at $239 per month, includes 10 client accounts and offers features like AI Summary, Ask AI, metric alerts, goal and budget tracking, ad spend markup, full branding, and client messaging.
-
Perform Plan: For $479 per month, which accommodates 15 clients and includes all features from the Grow Plan, plus benchmark comparisons, trend forecasting, anomaly detection, data aggregation, and priority support and training.
4. Whatagraph
Source: Whatagraph
Whatagraph is a comprehensive marketing intelligence platform designed to connect, standardize, and report on multi-source marketing data in a single location. It empowers agencies and in-house teams to deliver accurate, customizable reports at scale, providing actionable insights for growth.
Key Features:
-
Connect with over 50 marketing platforms, including Google Analytics, Facebook Ads, and Twitter, ensuring seamless data consolidation.
-
Offers white-labeled reports with custom logos, domains, and color schemes, enabling agencies to maintain consistent branding.
-
Facilitates automated data flow to warehouses like BigQuery, streamlining data management processes.
Pricing Plans:
Pricing information is not available on their website.
5. DashThis
Source: Dashthis.com
DashThis is an intuitive marketing reporting tool that simplifies the process of creating and sharing dashboards for agencies and marketers. It pulls data from multiple sources into customizable dashboards to automate reporting tasks.
Key Features:
-
Integrates with 34+ marketing platforms, including Google Analytics 4, Facebook Ads, and TikTok Ads.
-
Drag-and-drop customizable dashboards with white-label branding.
-
Automated reporting with scheduled email dispatch and real-time data updates.
-
Unlimited users and data sources across all pricing plans.
Pricing Plans:
-
Individual Plan: $49/month for 3 dashboards.
-
Professional Plan: $159/month for 10 dashboards.
-
Business Plan: $309/month for 25 dashboards.
-
Standard Plan: $479/month for 50 dashboards.
-
Enterprise Plan: Custom pricing for 100+ dashboards.
6. Improvado
Source: Improvado.io
Improvado is a comprehensive marketing analytics platform that centralizes and streamlines data from over 500 marketing and sales sources. Marketing teams can automate reporting, gain actionable insights, and optimize return on ad spend (ROAS) with its powerful features.
Key Features:
-
Generates real-time, customizable reports, reducing manual data handling and providing up-to-date insights.
-
Transforms raw data into analysis-ready formats.
-
Uses AI to deliver actionable recommendations.
Pricing Plans:
-
Growth Plan: Designed for expanding firms requiring deeper insights and reporting capabilities.
-
Advanced Plan: Suited for large companies needing robust integrations and support.
-
Enterprise Plan: Ideal for industry leaders with complex requirements, offering unlimited features.
Ready to Try TapClicks Marketing Agency Reporting Tool?
Marketing agencies spend a lot of time gathering marketing data, performing calculations, and building client reports. Without automation, tracking key metrics across multiple marketing channels can take hours.
TapClicks solves these challenges with marketing agency reporting software that automates data collection, advanced calculations, and report generation.
If you’re managing multiple clients and large-scale marketing campaigns, TapClicks can help simplify your data and reporting processes. You can explore TapClicks’ features and experience its benefits firsthand.
FAQs About Marketing Agency Reporting Tools
What are marketing agency reporting tools?
Marketing agency reporting tools help agencies collect, analyze, and visualize marketing performance data from multiple marketing channels like Google Ads, social media platforms, and email marketing tools. They automate data collection, report generation, and client updates.
Why should agencies use automated reporting tools?
Manual client reporting takes time and increases the risk of errors. Automated marketing reporting tools eliminate manual data entry, provide real-time insights, and schedule PDF or PowerPoint reports for clients.
What makes TapClicks different from other reporting platforms?
TapClicks offers 250+ direct integrations, Smart Connectors for custom data sources, automated dashboards, and Report Studio for scheduling and sending reports. Its white-label reporting allows agencies to customize reports with their branding.
Can TapClicks generate PowerPoint and PDF reports automatically?
Yes, TapClicks Report Studio allows agencies to drag and drop widgets, graphs, and metrics into presentations that update automatically. Reports can be scheduled weekly, bi-weekly, or monthly and sent directly to clients.