
Many Companies Have Data Teams, But the Smartest Companies Are Making Data Analysis Accessible to All Employees

The last several years have seen the rise of the in-house data team. Nowadays it feels like most enterprise-level businesses have data teams to handle a large swath of sales, marketing, operations and other data analyses for the company. These teams typically include data analysts, data engineers and data scientists whose job it is to gather and analyze data across the business and distribute it to relevant departments and stakeholders.
Having a data team is certainly an advantage over businesses that don't have one, but handling all data analysis via a data team has its limitations. Namely, it restricts this crucial function to a limited set of employees. This slows down data analysis. Thousands of employees, who could make better decisions with data analysis, are restricted to waiting for a shared resource (the data team) to get this analysis.
In contrast, organizations that acquire tools and processes that democratize data analysis and let any employee do data analysis themselves will be able to get insights faster and make better, more nimble business decisions. Here's a simple example for marketers if your competitors know which marketing channels are giving them the best ROI, they'll focus on those channels and scale back on the under-performing ones. If you don't have this knowledge, or you don't have it as fast as your competitors, your marketing will lag behind theirs.
In this post, we'll discuss the problem with managing and analyzing disparate data and the limitations of data teams and most data tools. Then, we'll explain how our tool, TapClicks, can act as your data partner and simplify the process for marketers by handling the entire data management lifecycle and providing the essential business insights you need.
If you think TapClicks could work as a data management and reporting solution for your organization, you can try it free for 14-days or schedule a demo to learn more.
The Challenges of Analyzing Large Amounts of Marketing Performance Data
1. Disparate Data
The fundamental challenge with managing and analyzing a large amount of data is that it needs to be gathered from several different sources. In sales and marketing, specifically, even for a single brand, data is typically dispersed across dozens of marketing and sales platforms.
For example, a company looking to calculate their cost of revenue, you would need to look at the data from the marketing platforms where they ran ad and other marketing campaigns, then gather revenue information from their point of sale (POS) or CRM system and collect cost information through the departments like sales that produced the revenue. Simply gathering all of this data is complicated and tedious.
2. Non-Standard Formats
Second, data from different platforms typically don't use the same labels or follow the same schemas, so if you're collecting large amounts of it and storing it in one database, it needs to be normalized so that similar columns and fields are mapped correctly and the entire dataset can be analyzed together
For example, Facebook calls ad spend simply ad spend while Google Ads calls it ad cost. In our hypothetical of a company looking to calculate their cost of revenue, adding up all digital ad costs (including Facebook and Google) requires knowing that those two fields from those two separate platforms are effectively the same and can be added together. Other examples include what different platforms label revenue (e.g. sales vs revenue) or leads (conversions, contacts, etc.). When you're dealing with data from many sources, normalizing data is time-consuming and tedious work that needs to be done every week or month.
3. The Need for Advanced Calculations
After normalizing or transforming data sets (#2 above), the core task of data analysis, of course, means doing complex calculations on the data. These are the tasks that are typically left for data teams (data analysts, data engineers, data scientists). They include tasks like comparing data sets and zooming in and out of regional variances or considering campaigns by brand or groups of brands. A marketing example could be the need to look at the overall click-through rate by adding up clicks across many campaigns and dividing that by the total impressions. You could calculate the cost per click across a region or particular product line by adding up the total spend and dividing it by the total clicks.
As we explain below, although some of these tasks legitimately may require data teams, often, if the non-data employees who need to make business decisions based on this data (e.g. sales and marketing departments) could do some of these analyses themselves, they'd be able to:
- Get business insights a lot faster (because they don't have to wait for access to a shared resource, like a data team)
- Do a lot more data analysis, as a result of the above
4. Different Destinations
Finally, depending on what data is being analyzed and who for, the data may need to go to different destinations and this may be at different stages of its lifecycle. For example, the data team may want the raw data to be stored in a data lake or the customer service team may want access to it from the particular software they use (e.g. Gainsight).
And, once the data has been collected, normalized and calculated, it needs to be distributed to potentially several different places ranging from individual departments to stakeholders, platforms, other software tools, etc.
How Marketing Teams Handle Large Data Sets
Many marketing teams and agencies do all this work manually (by relying heavily on spreadsheets) and/or using various software tools to help with some aspects of the work. And this needs to be done every week or month or whenever the reporting period falls.
This is extremely inefficient and time-consuming and it's why astute organizations are hiring data teams and using a stack of data tools to help them.
The Limitations of Data Teams and Most Data Tools
Data Teams
Data teams comprise data scientists, engineers and analysts. Their role is to take care of all the elements of data handling we outlined above for the entire business. Their talent pool is specialized and includes querying language skills (e.g. SQL, R, Python) which are often needed for the software tools that are being used.
Typically, the data team is a shared resource so all departments rely on the team to supply them with the data and analysis they need. This means that service can be slow. There can easily be a backlog of requests, especially for enterprise organizations with thousands of employees. So, people inevitably don't get their data when they need it and long wait times are the norm.
While data teams are a valuable investment and are certainly a necessity for producing advanced data analytics, if there were some aspects of their work which could be done by non-data team employees (e.g. the marketing team), it would speed up analysis and decision making times. This requires having the tools necessary to do the above steps (gathering, normalizing, analyzing and loading data) without database programming or specialized technical skills.
Data Tools
Data teams use several software tools in order to gather, transform and analyze data and they may use some manual, tedious processes such as spreadsheets too.
The problem with using different data tools is that each one only does some of the work so the process is unnecessarily complex.
Software tools used by data teams typically include:
ETL Tools
ETL (Extract, Transform, Load) tools act as connectors that pull data from disparate data sources, normalize or transform it and then load it, typically into a data warehouse.
The limitation is that ETL tools often don't connect to all your data sources meaning that data teams need to use separate tools to do this or extract the data manually from those platforms not compatible with the ETL tool. This takes extra time and negates the whole purpose of having an ETL tool.

In addition, while ETL tools (and also ETLT tools) can do a good job of transforming data, they do not do advanced calculations, analysis or reporting. These tasks would have to be done separately, by a business intelligence (BI) tool, for example.
You can read more about ETL or data pipeline tools in this article.
BI Tools
Business intelligence (BI) tools are used to provide the visualization and analytics functions. As mentioned above, they usually need to be used in conjunction with an ETL tool.
Most BI tools are highly customizable but can be complex to use. This is why they are used by data teams and not by marketers directly.
BI tools are not usually set up to handle a high level of scalability. So, if you need to manage data from many different regions, clients or campaigns, the process will be even more difficult and time consuming.
Other Tools for Marketers
For agencies or marketing departments who may or may not have access to a data team, there are various marketing reporting and dashboard software tools available that bring the ETL and BI functionality into one tool.
These include many lightweight tools such as Klipfolio Powermetrics and AgencyAnalytics and have varying levels of data source integrations. Some of the tools also have limitations in the number of campaigns or clients you can run as well as limits on customization and how dashboard templates scale.
Finding the right tool that can help you, whether you have a data team or not, is really important.
TapClicks was designed specifically to be an automated central hub that can be used by any employee, not just the data team, and handles all your marketing performance data, from collection to distribution. We'll explain how, next.
How TapClicks Handles the Entire Marketing Data Management Lifecycle and Provides You with the Essential Business Insights You Need
The TapClicks platform was designed to fulfill the four functions of data analysis for marketing performance data (gather, normalize, calculate, load) in a way that lets non-technical marketing employees manage the process themselves.
This democratizes sales and marketing data analysis and empowers your marketing team to:
- Always have access to all relevant sales and marketing data, from all sources, in a central location (their TapClicks database) so they never have to go hunting for the data they need.
- Extract and analyze that data (or export it to any other location or analysis tool) without needing a data analyst.
Here's how TapClicks takes care of all the drawbacks we outlined above.
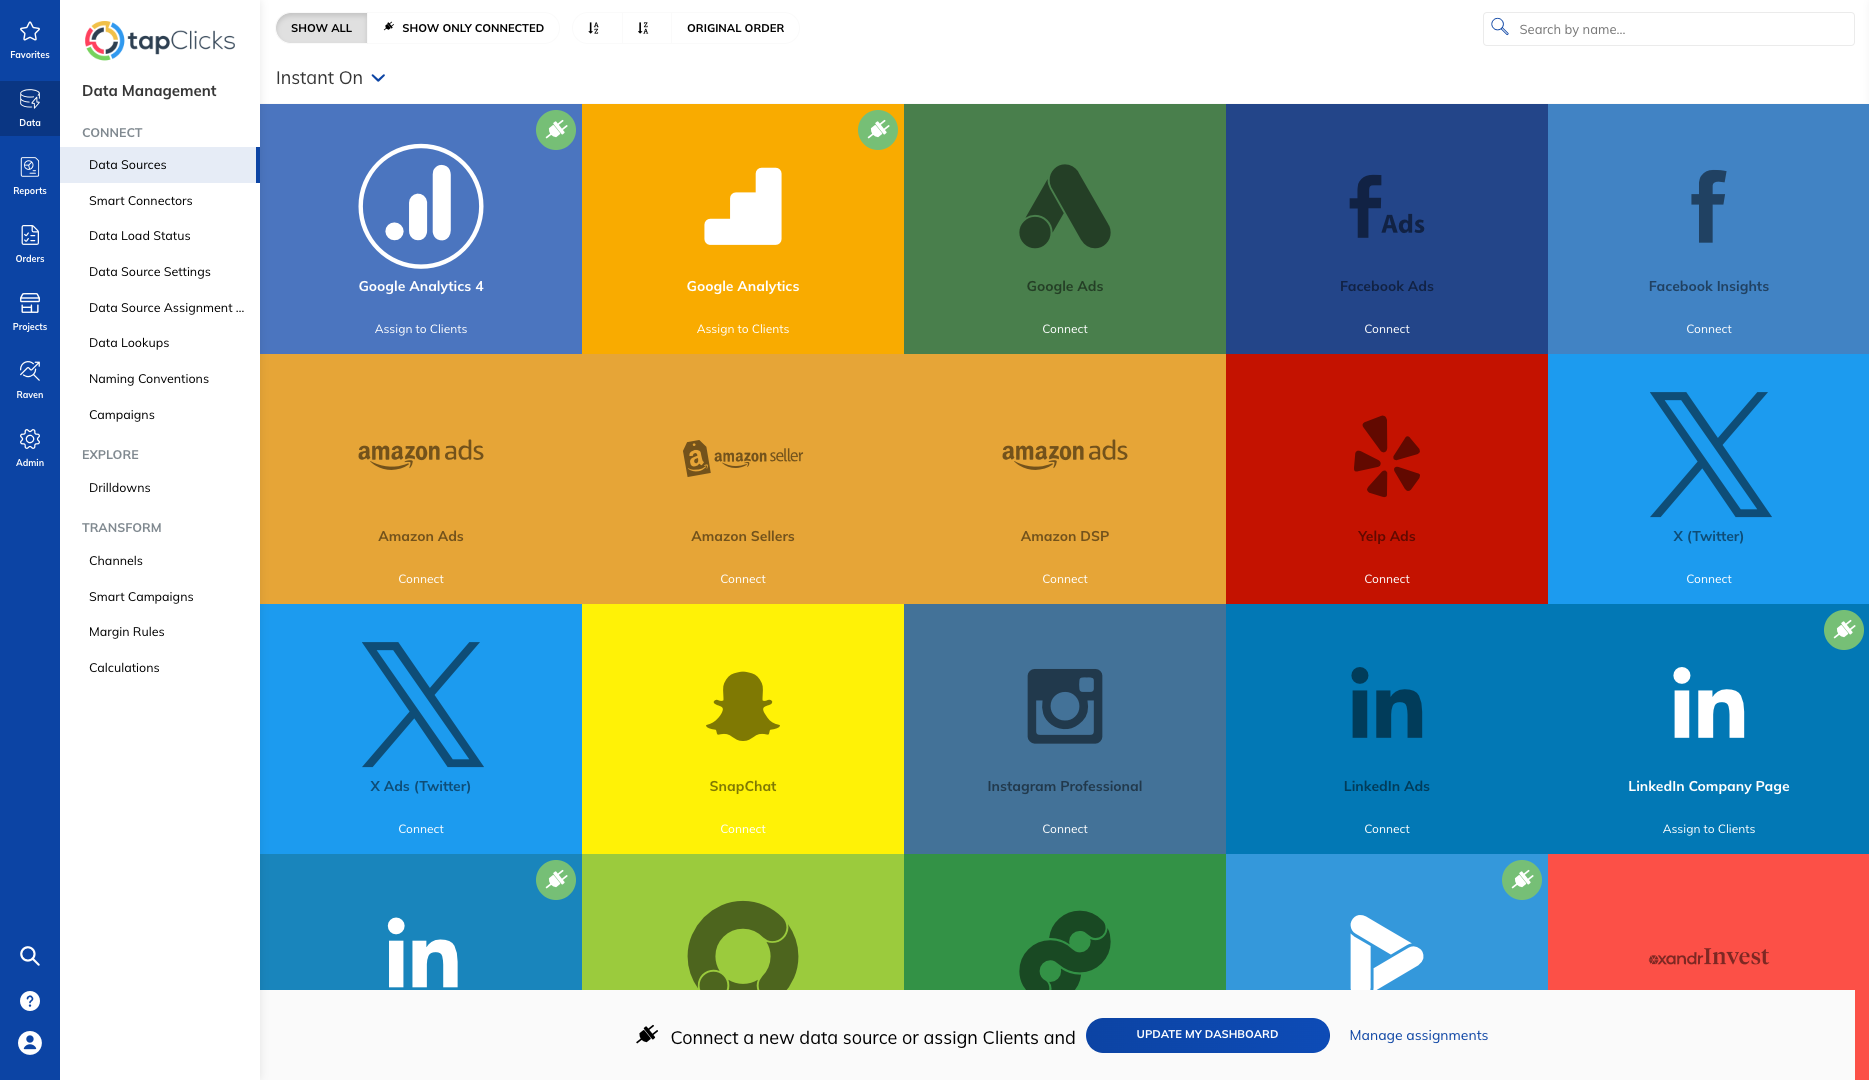
TapClicks Connects to All Your Marketing Data Sources
Unlike many other tools that only connect to a limited number of data sources, TapClicks comes with the ability to connect to essentially any sales or marketing data source. This is via our Smart Connector which lets users build a connection to any data source they have. To date we and our customers have built connections to thousands of data sources, and sales and marketing platforms.
We also have hundreds of pre-built API-based data integrations including all the marketing platforms you would expect (e.g. Facebook Ads, X [Twitter] Ads, etc.) as well as many lesser-known platforms (e.g. Genius Monkey and Tiger Pistol). These can be set up almost instantly.
Once you have connected to your data sources, your data will be pulled into your TapClicks data warehouse immediately and will be extracted automatically every day or whenever you choose to refresh it. And, in some cases, we can extract 12 months of historical data too.
As well as being able to connect to any data source you want, the benefit of using TapClicks is that our team manages the API connections for you. So, if a connection breaks, there is no need to worry as the TapClicks team will take care of it.
In this way, TapClicks becomes your data warehouse for all marketing performance data. Data is automatically pulled into the warehouse daily from all relevant sources and stored there permanently. No custom database or custom-built API connections needed. And as we'll explain next, this data can either be analyzed in TapClicks or exported to any other tool for analysis like BI tools, visualization tools, or even spreadsheet programs like Google Sheets.
TapClicks Normalizes Your Data and Allows You to Do Advanced Calculations and Analytics
While certain tools (e.g. ETL tools) can normalize data, as we explained above, you would need another tool such as a BI tool to do calculations and need a data team to extract and analyze the data for you.
With TapClicks, however, data teams, marketers or any non-technical employee can easily extract and analyze any data in their TapClicks marketing data warehouse. Users can set up or define advanced calculations one time and have those calculations executed at any time in the future.
Combine and Customize Metrics
Marketers often deal with metrics from different platforms with unique names which effectively mean the same thing. For example, an agency may track follows on X (Twitter) or Facebook and subscribes on YouTube as simply engagement and want to report that to clients.
With TapClicks, you can define an umbrella term once and it will remain available and updated with the latest data for all future reports you want to create.
For example, you could create a new term inside TapClicks called Total Social Engagement and define it as the sum of post-reactions on Facebook, views on YouTube, or click-throughs on LinkedIn (see below).


Once that custom metric is defined, it will be available in TapClicks forever, with updated data, so you never have to manually add up those engagement metrics again in order to report on them.
This is a huge time saver.
Set Up Repetitive Calculations
You can also automate more advanced calculations in TapClicks.
For example, if you are a tire manufacturer and you want to view your data by brand, but you have multiple ad campaigns running for different brands, you can set up advanced calculations that find the specific brand names in the campaign names and aggregate stats across all of these into single metrics for that specific brand.
In our example below, we can see that there are 266 Facebook Ad campaigns, all pulling in data from our data sources.
We've decided to name a certain segment of those campaigns HNP Campaigns' (see arrow on the right-hand side).

This means we can now pull data for just those HNP campaigns into any report or dashboard we want to create.
In this example, there are 191 of them and it pulls the data for all of those campaigns into one line (see arrow on the right-hand side).
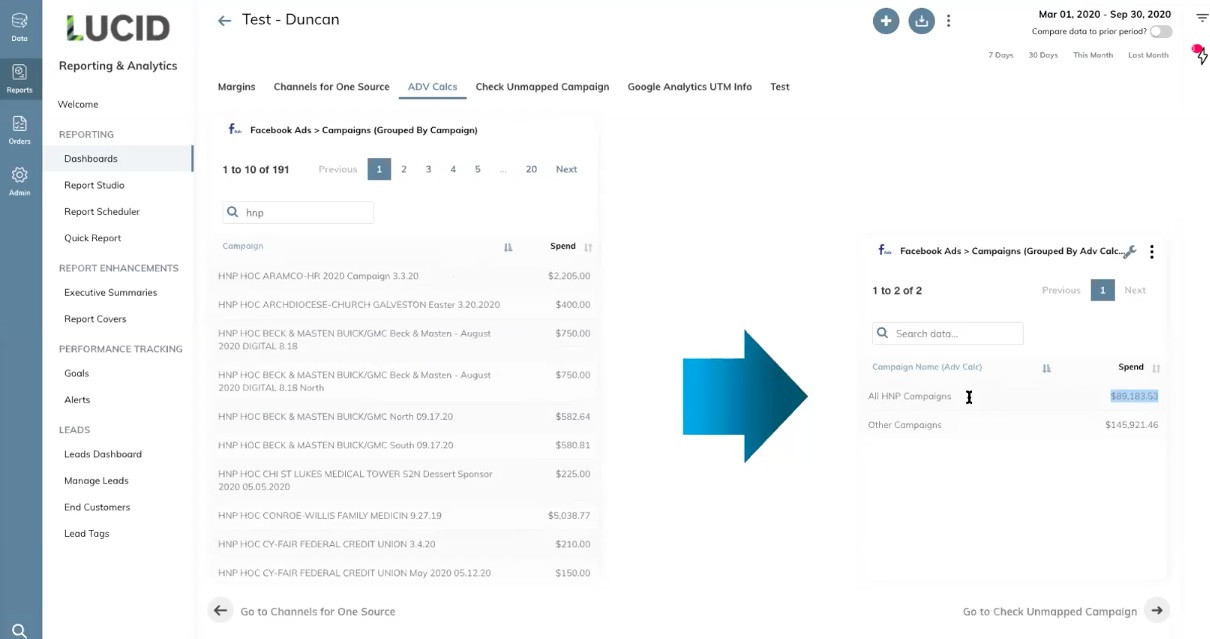
You can use this function to group and view data by all types of location or by any segment you like product, campaign type, or group, and zoom in and out as you need to. The possibilities are endless and, while your data team could use the TapClicks platform, these calculations can also be executed by the marketing team without any coding knowledge.
Create and Distribute Powerful Reports to Stakeholders from within the TapClicks Platform
If you rely on your data team to create your reports for you, you may be waiting for a long time to get what you need and you almost certainly won't be able to fulfill any last minute requests.
With TapClicks, you can create powerful visualizations and reports right within the platform, in two ways.
1. Live Dashboard Visualizations
You can create dashboards so you can view campaign data in near real-time.
TapClicks dashboard tools are designed to be scalable, meaning single dashboards or visualizations can easily be turned into templates and applied across dozens or hundreds of dashboards.
Instead of data teams producing all this on the marketing team's behalf, marketing departments or agencies can create one dashboard for a specific type of report and filter the data for each client, themselves. The benefit of this is that you can make a change to this report in one place and have it instantly apply to all clients.
Here's a short video on how to create a dashboard in TapClicks:
2. Up-to-Date PowerPoint-Style Reports
Our reporting solution, ReportStudio, automatically populates PowerPoint-style reports. These can be scheduled to be sent out to your chosen audience whenever you want (e.g. daily, weekly, monthly, etc.).
So, instead of waiting for the data team to produce the reports for you, you can easily do it yourself from within the TapClicks platform.
Here's a short video on how to schedule reports in TapClicks ReportStudio:
Want to Democratize Your Data Analysis with TapClicks?
TapClicks offers a flexible solution which can be used by skilled data teams as well as marketers (and other employees) with no data engineering skills. By providing an end-to-end solution for the entire marketing lifecycle from data collection through to report distribution, TapClicks is simple to use and scalable too.
If you think TapClicks could work as a data management and reporting solution for your organization, you can try it free for 14-days or schedule a demo to learn more.