
8 Data Pipeline Tools (Plus an In-Depth Analysis of Our Own Tool for Marketers)
8 Data Pipeline Tools (Plus an In-Depth Analysis of Our Own Tool for Marketers)

Data pipeline tools are a category of software that allow large volumes of data to be moved from several disparate data sources to a central destination, often a data warehouse. Data is typically normalized or transformed so that it's in a consistent format and schema in the data warehouse and can be used for analysis and reports.
There are many types of data pipeline tools available, some of which we discuss in this piece.
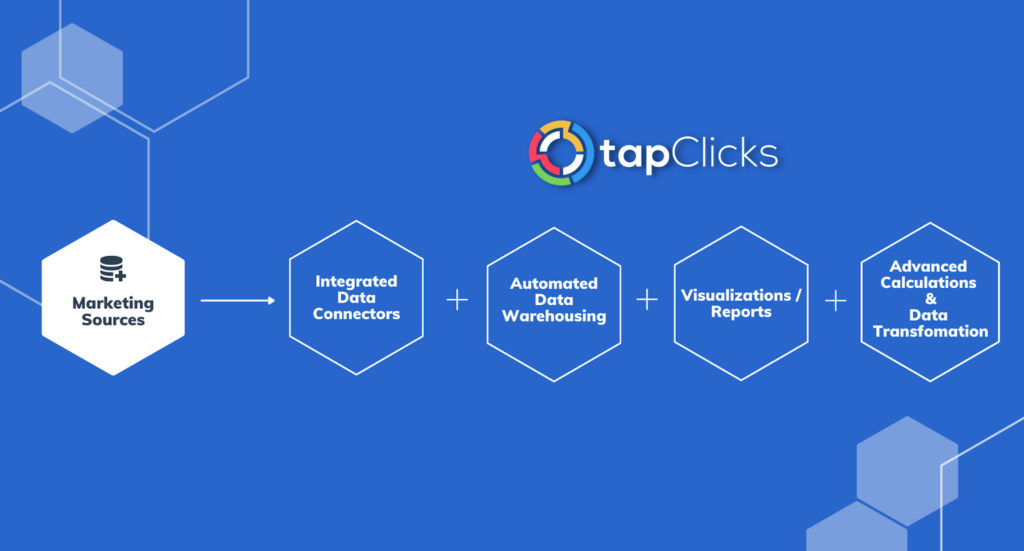
We start below with a deep discussion of our data pipeline tool, TapClicks, which helps consolidate, store, and analyze data in the sales and marketing space. Specifically, we discuss the 4 features that you should look for in a marketing data pipeline tool and explain how TapClicks goes about fulfilling:
- Gathering data from all your marketing sources as well as any other data source.
- Storing all your data in a fully managed data warehouse that any marketer can access (with no coding required).
- Setting up transformations and complex calculations just once within the TapClicks platform.
- Creating powerful visualizations and reports for clients with automated and scheduled distribution.
Then, if you're not looking specifically at sales and marketing data, we give an overview of 8 general purpose data pipeline tools (click here to skip to this section).
If you think TapClicks could work as a data pipeline solution for your organization, you can try it free for 14-days or schedule a demo to learn more.
How TapClicks Consolidates, Stores, and Analyzes Sales and Marketing Data in One Place
Benefit #1: TapClicks Gathers Data from All Your Marketing Data Sources
A core feature (perhaps the most critical feature) of data pipeline tools is that they help consolidate data from multiple different sources to a single database or destination (a data warehouse) of some kind.
The problem in the marketing data pipeline space is that most data pipeline tools connect to a limited number of data sources. For example, if you use an ETL (extract, transform, load) or an ELT (extract, load, transform) tool, it's likely it will only connect to some of your marketing data sources. This means that you would need to collect data manually from your other data sources which is tedious and time-consuming.
In contrast, TapClicks was designed to connect to virtually any marketing data source as well as many other data sources relevant to marketers (e.g. AWS and CRM).
We did this by building a Smart Connector tool into TapClicks which allows you to build a connection to essentially any data source you want (or our team can help build one for you). This is different from other tools where you are limited to pre-built API-based connections.
To date, TapClicks users have built connections to thousands of data sources via our Smart Connector tool, including home-built databases and offline data sources. This robustness of connectors changes the use of a marketing data pipeline tool from it handles some of our data to being the go-to source for consolidating all of an organization's marketing data.
TapClicks also has hundreds of pre-built API-based data integrations that can be turned on instantly, including all the marketing sources you would expect (e.g. Twitter Ads, Facebook Ads, etc.) as well as many lesser known platforms (e.g. Genius Monkey and Tiger Pistol).
As soon as you've set up your data connectors, your data will be immediately pulled through. TapClicks will then extract your data automatically every day (or whenever you choose to refresh it). In many cases, we can extract 12 months of historical data, too.
TapClicks manages API connections, so you don't need to worry about your developers or data scientists managing a connection if it breaks; the TapClicks team will take care of it for you.

The ability to automatically pull raw data from all your marketing sources (and other data sources) means you don't need to use data engineers, third party tools, or do the work manually saving your team a significant amount of time.
Benefit #2: TapClicks Is Your Fully Managed and Accessible Marketing Data Warehouse
Most data pipeline tools push your data out to a data warehouse (e.g. Snowflake) or data lake. Not only is it inconvenient to have a separate data storage facility, it is also separate to a marketer's analysis and reporting toolset. The process is therefore complex, requiring additional third-party tools (e.g. business intelligence tools) and the expertise of data scientists or engineers whenever marketers require data.
TapClicks not only collects your data (#1 above), but it brings all that data into your own fully managed TapClicks data warehouse. This acts as a central hub for all your source data.
You can read more about our TapClicks marketing data warehouse in this article.
TapClicks provides a marketer-friendly data warehouse that stores your data safely forever and does not require any data science or programming language knowledge (e.g. SQL, Java or Python).
Next, we'll explain how you can do data transformations and much more from within the TapClicks platform.
Benefit #3: Set Up Transformations and Complex Calculations Just Once within the TapClicks Platform
One of the functions of a data pipeline tool, specifically an ETL tool (or an ELT tool) is to transform data sets, ensuring that labels and schemas are consistent and that unstructured data is mapped and organized.
Many data pipeline tools transform data efficiently, but they don't have the ability to do complex calculations, visualizations, and analysis that marketers need to create reports. These functions are not included in the ETL process but are done manually by the marketing team or by one (or more) third party tools.

TapClicks not only transforms data just like an ETL tool, but it allows you to set up or define complex calculations just once and have those calculations automatically executed at any time thereafter.
Here are a couple of examples:
Customize and Combine Metrics
Marketers often deal with metrics from different marketing platforms that have unique names but the same meaning. For example, a social media agency may track followers on Twitter or Facebook and subscribers on YouTube simply as engagement and want to report that to clients.
Reporting on a Total Engagement metric like that is tedious every month, likes and follows have to be added up by the team and tracked in a spreadsheet.
But with TapClicks, you can define an umbrella term once and it will remain available and updated with the latest data for all future reports you want to create.
For example, you could create a new term inside TapClicks called Total Social Engagement and define it as the sum of post-reactions on Facebook, views on YouTube, or click-throughs on LinkedIn (see below).


Once that custom metric is defined, it will be available in TapClicks forever, with updated data, so you never have to manually add those engagement metrics yourself again to report on it. In any dashboard or report you build in the future, you can just drop in the metric Total Social Engagement (or a graph of this metric over time) and TapClicks will automatically calculate it based on how you defined it and have the number or graph ready for you.
This is a huge time-saver and goes way beyond the scope of most data pipeline tools.
Easily Set Up Repetitive Calculations
In addition to defining custom metrics, you can also automate more complex data calculations in TapClicks.
For example, if your client is a tire manufacturer and you want to view their data by brand, but you have multiple ad campaigns running for each brand, it's challenging to set up different data streams to give you the information you need. With TapClicks, you can set up advanced calculations that find the specific brand names within campaigns and aggregate stats across all of these campaigns into single metrics for that specific brand.
In our example below, we can see that there are 266 Facebook Ad campaigns, all pulling in data from our data sources.
We've decided to name a certain segment of those campaigns HNP Campaigns' (see arrow on the right-hand side).
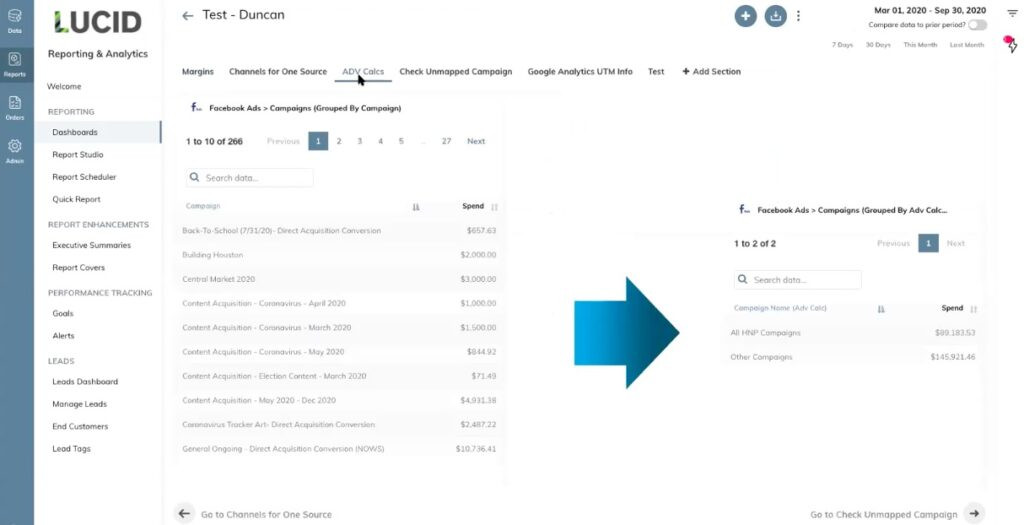
This means we can now pull data for just those HNP campaigns into any report or dashboard we want to create.
In this example, there are 191 of them and it pulls the data for all of those campaigns into one line (see arrow on the right-hand side).
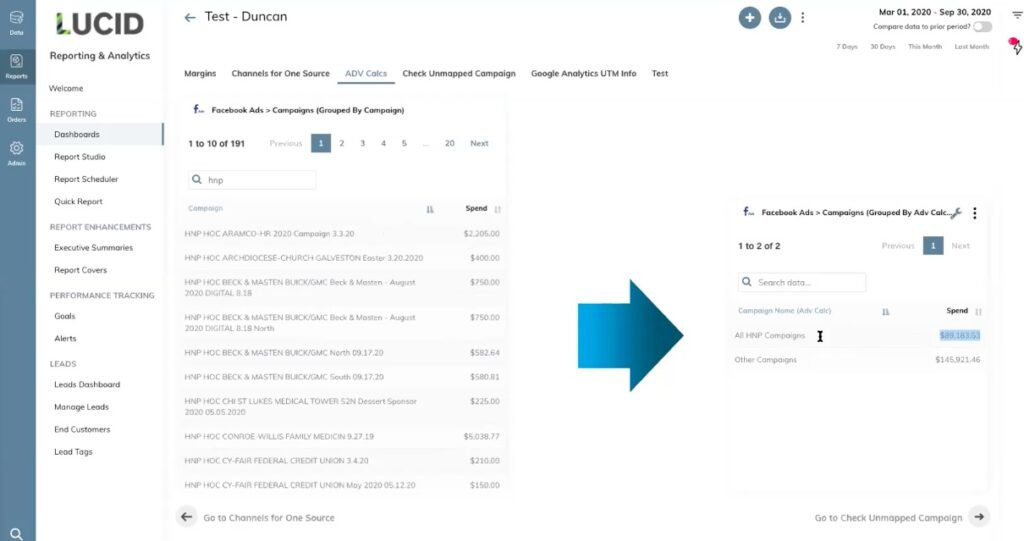
You can use this function to group and view data by all types of location or by any segment you like product, campaign type, or group, and zoom in and out as you need to.
You can also calculate the overall click-through rate by adding up clicks across many campaigns and dividing by total impressions. You could calculate cost per click for campaigns across a region or specific product lines by adding up total spend and dividing by total clicks. The possibilities are endless and are not something that could be achieved by a general data pipeline tool that only cleans up or transforms data fields.
And, as with everything in the TapClicks platform, you only have to set up these calculations once. Then, every week or every month, these metrics are automatically updated and ready for you to report on.
Benefit #4: TapClicks Creates Powerful Visualizations and Reports with Automated and Scheduled Distribution
The main drawback of general data pipeline tools for marketers is that, while they do allow you to streamline your data flow and data management, they don't allow you to do data analytics or reporting. You have to use a separate tool or tools (e.g. a business intelligence tool) to do this for you.
However, TapClicks allows you to create powerful visualizations and reports in two ways and you can push your data out to other platforms or cloud data warehouses, too (e.g. Salesforce or AmazonRedshift).
Dashboard Visualizations
You can create dashboards to view campaign data in near real-time (typically updated daily). TapClicks dashboard tools are designed to be scalable, meaning single dashboards or visualizations can easily be turned into templates and applied across dozens or hundreds of dashboards.
Marketing agencies can also create one dashboard for a specific type of report and filter the data for each client. This has the advantage of letting you make a change to this report in one place and having it instantly apply to all clients.
Here's a video that shows you how to create a dashboard:
PowerPoint-Style Reports That Are Always Up-to-Date
Our reporting solution, ReportStudio, automatically populates PowerPoint-style reports with your latest near real-time data. These can be scheduled to be sent out to your chosen audience whenever you want (e.g. daily, weekly, monthly, etc.).
Here's a short video on how to schedule reports with TapClicks:
TapClicks Delivers Data to Any Other Platform
If you prefer to analyze and visualize data in a third-party tool, you can also push data from TapClicks to any other destination.
For example, if you use Tableau for analysis and visualization, you can push data from TapClicks there, likewise with Google Sheets.
You can read more about TapClicks integration with Google Sheets in this piece.
These are just a few examples. With ReportStudio, you can schedule and automate when the data is sent out.
Want to Try TapClicks as Your Marketing Data Pipeline Tool?
TapClicks extends the scope of a regular data pipeline tool by handling the entire marketing data lifecycle in one central ecosystem. By automating the process from data collection, storage, and data analytics to report distribution, marketers can simplify and scale their data management and reporting capabilities for dozens or hundreds of clients.
If you think TapClicks could work as a data pipeline solution for your organization, you can try it free for 14-days or schedule a demo to learn more.
8 General Purpose Data Pipeline Tools
If you're not looking for a data pipeline tool for sales and marketing data specifically, here's a round-up of 8 general data pipeline tools that loosely fall into 4 main categories:
#1 Open-Source Data Pipeline Tools
An open-source data pipeline tool is one where the technology is open to public use and is often low-cost or even free. This means it needs to be customized for individual use cases so it will require developer knowledge and time.
Apache Airflow

Apache Airflow is a platform that programmatically creates, schedules and monitors workflows. It has a modular data pipeline architecture defined in Python (so it does require coding knowledge) allowing for dynamic pipeline generation.
Apache Kafka
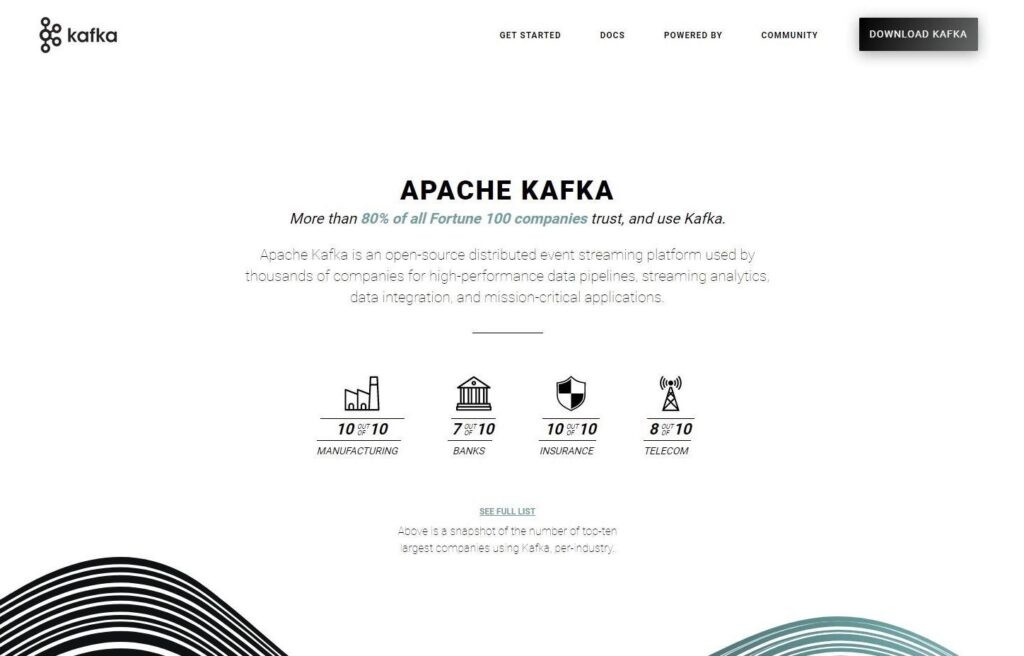
Apache Kafka is used to build real-time streaming data pipelines and streaming applications such as events, analytics, and data integration. It is a powerful and scalable open-source tool that can connect to hundreds of sources.
#2 Batch Data Pipeline Tools
A batch data pipeline tool moves large volumes of data by allowing you to load data in batches or clusters at intervals, rather than in real-time, which might inhibit business operation.
IBM DataStage

IBM DataStage is a multi-cloud AI-powered data integration tool that helps you design, develop, and run jobs that move and transform data. At its core, the DataStage tool supports extract, transform, and load (ETL) and extract, load, and transform (ELT) patterns.
Informatica PowerCenter

Informatica PowerCenter offers cloud-based ETL and ELT for integrating data across multiple clouds. It allows you to connect source and target data with thousands of connectors and run large-scale integrations with Spark processing in a serverless environment.
#3 Real-Time Data Pipeline Tools
Real-time data pipeline tools process data live, or in real-time. They are used by businesses needing information instantly.
Confluent

Confluent works with Apache Kafka (see #1 above) to offer a more complete, cloud-native platform which moves your customer data dynamically. It allows you to capture and process customer interactions as they happen, in real-time.
Hevo
Hevo is a no-code data pipeline service that connects to over 100 data sources. It allows you to move your data from any source to your data warehouse such as Redshift, BigQuery, and Snowflake in real time.
#4 On-Premise Data Pipeline Tools
On-premise data pipeline tools are built to fit in with existing data processing facilities (e.g. a database or data lake) at the same location. It is fully customized and offers a high level of security while being a more expensive option.
Talend

Talend offers an on-premise as well as cloud-based data pipeline system.
Powered by the Talend Trust Score, the solution handles every stage of the data lifecycle including data integration, data integrity, governance, and API integration and supports virtually any cloud data warehouse and public cloud infrastructure provider.
Oracle Data Integrator

Oracle Data Integrator offers an on-premise and cloud-based service which delivers extract, load and transform (ELT) capability for big data, high performance batch loads or trickle-feed integration processes.
You can read more about the different types of data pipeline tools in this article.
If you think TapClicks could work as a data pipeline solution for your organization, you can try it free for 14-days or schedule a demo to learn more.