
Agency Client Retention: Why Owning Your Data and Differentiating Your Reporting is Key

Most advice on what agencies can do to retain clients is pretty basic and obvious, for example, Communication is so important or, Set Goals and Expectations and many other vague terms. These truisms aren't that useful almost anyone managing an agency knows them already.
Having worked closely with hundreds of agencies for over a decade of running TapClicks, we've learned that there is one critical thing you should be doing in order to retain clients: report your results to clients in a proactive and effective way which gives them proof that you're doing a great job. While that sounds simple, pulling that off requires having access to all the client result data and having the means to analyze it to extract key takeaways.
We're going to get a lot more specific in this article. Specifically, we've created this article around 4 common agency-client cliches or truisms that are touted in the industry. These truisms are often obvious, lack context, and aren't actionable. So, we are countering each of the 4 truisms with a detailed, data and analytics approach that is an actionable way to fulfill the intent of the advice.
- Generic Truism: Prove Your Success with Regular Reporting
Our Approach: Create unique industry benchmarks with your data which sets you apart from the rest, including segmentation and other best practice or best performance data that's exclusive to your agency. - Generic Truism: Set Goals and Expectations
Our Approach: Automatically track and measure your results so that you and your clients have an accurate and up-to-date picture of your performance. - Generic Truism: Show your Value
Our Approach: Automate your reporting so you can spend more time working strategically on your campaigns. - Generic Truism: Communication is Key
Our Approach: Optimize communication with your clients by sending out information that's tailored to their needs.
Want to see how easy it is to use the TapClicks analytics tool or learn how it can help your agency retain clients? Try our free 14-day trial.
Why Is Reporting Key to Keeping Clients?
First, we need to explain why we believe reporting is critical to your client retention rate. The simple answer is that clients hire marketing agencies to get actual business results: measurable growth in leads, sales, impressions, web traffic, and more. So, while the cliche tips around communication and nurturing client relationships have their place, we strongly believe they come far below delivering on your primary promise: getting the client results. If you can do that, the client will excuse any other shortcomings because you are successfully delivering what they wanted.
Inversely, if you get the other things right: you communicate well, you have a great client relationship, etc. but you aren't meeting your client's business goals (e.g. no growth in leads, sales, traffic, or any other agreed upon metrics) or you're not communicating to them the results you are getting, then those details don't really matter you're not meeting your client's needs.
Now that we've established why the reporting aspect is so important in retaining existing clients (and attracting new business), we'll take a deeper dive into how you can actually achieve that.
Tip #1: Create Unique Industry Benchmarks with Your Data Which Sets Your Agency Apart
Generic Industry Truism: Prove Your Success with Regular Reporting
We certainly agree with this truism. And, if you're delivering marketing campaigns to clients, this statement won't tell you anything you don't know already providing clients with meaningful reports on your performance whenever they need them is a given for any agency, it's not enough to differentiate you. And if you're not differentiated, you're expendable at worst or replaceable at best.
Instead, let's consider how you could provide analytics that differentiates you from other agencies so that your existing clients will realize it would be extremely hard to replace the value you're delivering and new clients will see you as uniquely valuable compared to other agencies they're considering.
How to Use Benchmarking to Demonstrate Success
Sometimes an existing client will ask you what results they could expect if, for example, they provided a budget for a new area of activity, say a digital display advertising campaign in a specific industry, or on specific web properties.
If you are an agency with many clients (present or past) in particular business sectors, you might have a vague idea of how successful similar campaigns or businesses have been. But, if you could present stats of exactly what results you've achieved in that sector or on those web properties and thus give the client a quantitative range of industry standards, that would immediately differentiate you and position your agency as an industry expert. But for most agencies, getting stats of this nature would involve a huge amount of work.
Most agencies don't have all their data in one place, particularly if you need to incorporate data from past clients. It would require extracting data from several different sources, putting that data together all in one place, then number-crunching in a spreadsheet or some sort of software tool it's extremely tedious and most agencies don't have the employee resources to do this.
With TapClicks, however, all your data from all your clients and campaigns are stored in one place the TapClicks platform and can be analyzed, manipulated, and graphed, or visualized by any marketer, without requiring a coder or professional data analyst. So agencies using TapClicks can very easily extract and plot trends and benchmarks of past clients segmented however they like: by campaign type, by industry, by geography, and more.
Let's look at some specific examples.
Example #1: Sector Benchmarking
Let's say your digital agency has a number of home services clients such as plumbers, roofers, window repairs, etc. You have a lot of data from campaigns you've run for those clients, past, and present. A potential new client in one of those areas might ask you what sort of results they could expect if they were to work with you on their digital marketing campaigns. As we said above, gathering all this information from dozens of past clients would normally be extremely tedious.
But with TapClicks, you already have all that data for all your clients in one place and you can plot or display data like average cost per impression, cost per click, or any other data from multiple clients in one report. You can also segment that data into groups for example Business Units (i.e. client name), Client Groups, and then Groups of Client Groups. You can put the same client/group into multiple groups if you wish. Then, you can filter all the data for that specific sector e.g. window repairs, and within minutes you would be able to share the expectations for conducting digital marketing campaigns in that sector.
That's going to really impress any client, existing or future.
Here is a short how-to videoshowing how easy it is to set up a calculation in TapClicks:
Although it shows a hypothetical calculation for metrics from one client, the same concept can be used to calculate metrics from multiple clients.
Example #2: Campaign Type Benchmarking
Continuing the example above, say your prospective window repairs client wanted to know what results they can expect on social media or SEO campaigns specifically. From the example above, you're already looking at your clients' digital marketing campaigns from the window repairs sector. You can now filter further within your dashboard by selecting the window repairs clients for whom you've run social media and SEO campaigns. That will give you the benchmarking information your prospective client (or existing client if they want to diversify into a new sector) has requested.
You can even view the data by segmenting it by budget. Your prospective client might ask what they could expect from a monthly budget of, say, $5,000 for a PPC campaign. Not only would you be able to show them what they could expect, but you can also show them what kind of results to expect for, say $25,000.
This information is unique to you and your agency's data, but for most agencies, this data is scattered in various advertising, marketing, or analytics platforms, many of whom may belong to the client. In other words, most agencies don't retain and store data of their own current and past work in a single place, with data they own themselves. So this sort of benchmarking data is tedious at best or impossible to produce at worst. TapClicks solves this and becomes a central source of all current and past client data that agencies can easily access, analyze, and visualize at any time.
Example #3: Regional Market Intelligence
Likewise, you could also use this feature of being able to filter and analyze groups of data for different regions and locations.
Consider a car dealership client. Say you're already doing digital campaigns for them in California. They're now opening up dealerships in five new locations and want to know if you have an idea of what results they can expect in those new locations. As above, if you're a large agency with lots of experience in that sector and car dealership clients in those regions or even another type of client sector in those regions, you can filter the results so you will have an idea of what campaign expectations would be.
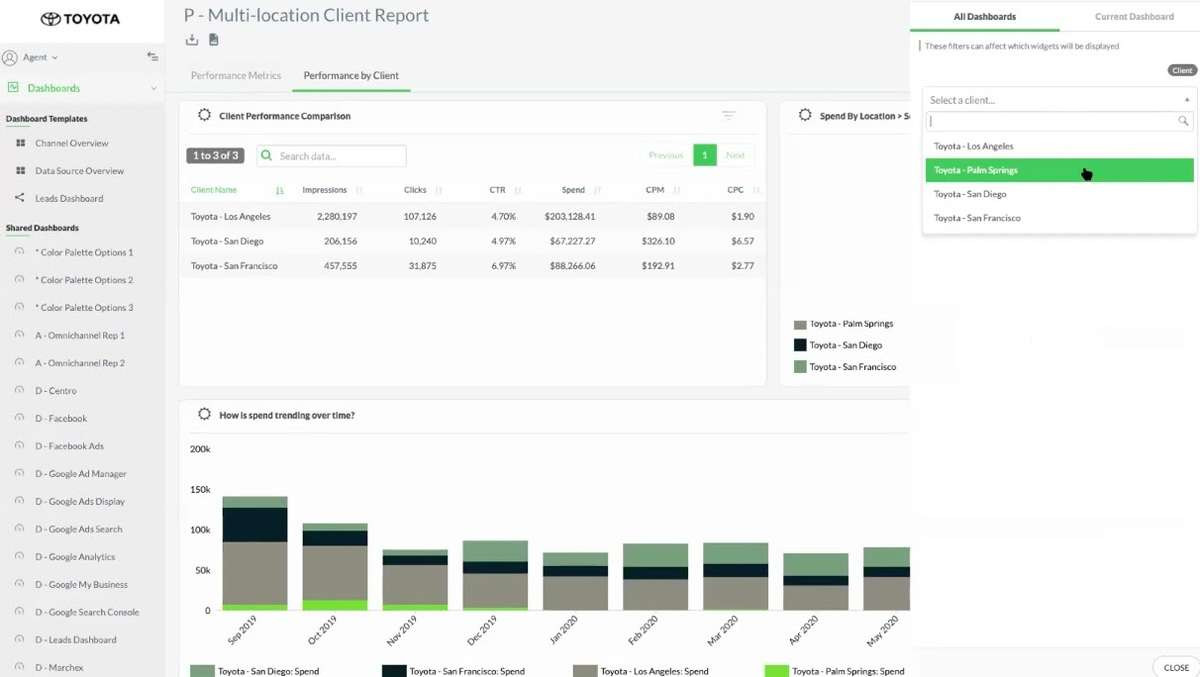
This kind of market intelligence is hugely valuable to agency owners to be able to share with new clients and existing clients, especially when you compare it to an agency without that knowledge or accurate way of backing up that knowledge with actual data. In fact, unless you have a solution such as TapClicks, it would be borderline impossible or certainly impractical.
Click here to read our post on Marketing Reporting for Multi-Location Businesses.
Tip #2: Automatically Track and Measure Results
Generic Agency Truism: Set Goals and Expectations
Setting goals and expectations is definitely a good starting point when you're onboarding a new client, but how do you actually measure that? It's all very well setting goals and expectations but unless you have the capability of tracking them, they're not going to be useful to anyone.
You and your clients need an accurate picture of your performance set against your KPIs and if you're not able to produce that at regular intervals or, in fact, at any given moment, that's not going to impress.
TapClicks' Goals and Pacing Tool
With TapClicks you can do exactly that - set goals and then accurately track your results against those goals, as shown below.

So, instead of waiting until you create your monthly report and realizing at that point that you're not on track, you can scrutinize the pace and KPIs of a campaign as it unfolds and make adjustments before issues arise.
As with all TapClicks functions, the data is dynamic, so you can view just one digital marketing campaign for one location for one client, right up to several campaigns for hundreds of clients, and every segment in between.
TapClicks Alerts Tool
Another really useful tool offered by TapClicks which will help you stay on the ball with your campaigns and budgets is its alert function where you can get notified if any metric hits a set threshold.
In the example below, an alert has been set for when the cost per click in a particular Facebook Ads campaign is greater than $5.50.

You can set up as many alerts as you wish, allowing you to keep close tabs on your campaigns and quickly make any necessary adjustments.
Both the Goals and Pacing tool and the Alerts tool mean that you will always be able to keep a sharp eye on all your campaigns. Your clients will benefit from your ability to be agile and make measured adjustments to campaigns so that your marketing efforts achieve the best results.
Tip #3: Automate Your Reporting So You Can Spend More Time Working Strategically on Your Campaigns
Generic Agency Truism: Show Your Value
Many advisors on retention strategies recommend you show your value in order to increase client retention. This is a vague term that can be interpreted in many ways, but how do you actually show your value to your clients?
Certainly, the downside of not using a tool like TapClicks and using disparate tools where you spend a lot of time creating reports is wasted time. Many agency staff spend tens or hundreds of hours each month extracting campaign data from different sources (e.g. Facebook Ads, LinkedIn, Google Ads, etc.), then doing number crunching in spreadsheets and plotting and graphing their data. And this needs to be done for each campaign and client every week or month or whenever the reporting period falls.
This is time spent doing time-consuming and tedious work that could be better spent working on your campaigns.
You can give your existing clients more value (i.e. time) by using the TapClicks platform and having all these tasks done for you automatically and at scale. TapClicks is designed for agencies that are running multiple campaigns, often for dozens or even hundreds of brands or clients, who have to regularly report on campaign performance to stakeholders.
Here's how.
With Tapclicks You Can Pull All Your Data Automatically and at Scale
With TapClicks, you can connect to more than 250+ marketing-specific platforms (we call them instant-on' connectors) and start pulling your data from them immediately and automatically. These include all the key marketing and advertising platforms as well as lesser-known ones.
And, if there's a platform that we don't yet have an instant-on connector for, the TapClicks team can usually set this up for you. In fact, we can connect to any data source, as long as it comes in a format we can integrate with (e.g. Google Drive, Snowflake, even an email attachment). We call this our Smart Connector'.
Once you're set up with your connectors your data is automatically pulled into your TapClicks data warehouse daily (or whenever you want to refresh) where it can immediately be incorporated into your analysis and reports. And for most data sources, we can pull in 12 months of historical data, too. So, as soon as you are set up with the data sources you need for your clients and campaigns, you will immediately have a valuable single source of data that you can draw on for market intelligence (see #1, above).
It's worth noting that the TapClicks platform is fully managed and that includes all the APIs. So, if a connection breaks or there's an update to an API, it will be taken care of right away.

With TapClicks You Can Easily Customize and Combine Metrics from Different Campaigns
In order to provide your existing clients or potential ones with meaningful performance information, you need to be able to customize and combine different metrics, such as comparing results from different digital marketing campaigns. This isn't easy if you're doing it manually, using a basic tool such as Google Data Studio, or patching together several different tools.
With TapClicks, it's easy to categorize umbrella terms with whatever name you decide. For example, you might choose engagement as the umbrella term for different metrics within different platforms. This could include a post-reaction on Facebook, a view on YouTube, or a click-through on LinkedIn (see below).


The TapClicks software will categorize it for you so you can view and compare the data together. And, you need only set it up once and it can be used for everything dashboards, reports, campaigns, and clients.
Set Up Scalable Dashboard Templates across Many Clients
A key part of showing your value to your clients is demonstrated in the quality of the information in your reports. And, as we have already mentioned, Account Managers and their teams can spend countless hours number crunching and creating elaborate visualizations each month. With TapClicks, you can do all this automatically, saving you a ton of time.
Users can choose from our readymade dashboard templates (these include social media channels (like Instagram), ad networks, and email campaigns) and configure them to include whichever metrics (we call these widgets) you set up. You can then visualize your data how you wish (e.g. graph, pie chart, bar chart).

Each widget and dashboard is highly customizable so you can customize metrics for each data source.
The beauty of the TapClicks solution is that you can use your dashboards as templates so that updates can be made across multiple dashboards.
Note: You can also make a change to just one dashboard if you prefer.
Here is a video showing how to set up a dashboard in TapClicks.
Easily Create Automated PowerPoint Reports
You can offer clients the option of viewing their data within a live dashboard whenever they want by granting them access. Note: you can also exclude sections of data you do not wish them to see, for example, Mark-up costs.
However, we find that most clients prefer to receive their reports via email. So, we designed a reporting tool called ReportStudio which is like having a PowerPoint presentation connected to all of your campaign sources which can automatically keep slides updated with the latest data.
Combined with the automatic pulling in and analyzing of data as well as any calculations (e.g. umbrella terms like Engagement), this means you can build analytics reports of your campaign data once, and schedule it to go out weekly, monthly, or whenever you want (more on scheduling in #4, below). All stats, graphs, charts, and visuals will automatically be updated with the latest data for that month.
You can read more information in this article about the benefits of the TapClicks automated reporting tool.
Tip #4: Optimize Communication with Your Clients by Sending Out Information That's Tailored to Their Needs
Generic Agency Truism: Communication is Key
The statement, Communication is Key, is kind of obvious. But what does this actually mean? There is of course a whole topic to discuss around good communication involving common courtesies like returning client phone calls, etc. But, in terms of reporting, it means sending the right reports to the right people at the right time.
But as we discussed above, analyzing data and producing reports is tedious. Many agencies have employees dedicate an entire week every month to reporting.
Send Clients Reports Whenever They Need Them
In contrast, with TapClicks, you can schedule reports to be sent to whichever client or stakeholders you want, whenever you want.
You can schedule these reports to be emailed as attachments (PowerPoint or PDF) at whatever frequency you want so the entire reporting process can be automated.
You can set up permissions so that only the people you want seeing the reports have access to them, and you can customize what they see, too as we mentioned earlier, if you don't want them to see your mark-up costs, the widget for this can be customized so that this is not viewable from their perspective.

Whether you choose for your clients to view data via our live dashboards, or as a scheduled email report, the benefit is that the data is automatically pulled into whatever format you have configured.
And, once you've set it up, it's there forever, until you decide to change it, saving you a massive amount of time which can be better spent working on your clients' campaigns and on your client retention strategies.
Want to see how easy it is to use the TapClicks analytics tool or learn how it can help your agency retain clients? Try our free 14-day trial.