
Google Data Studio vs Tableau: The 2025 Comparison Guide
You’re probably deciding between Google Data Studio and Tableau because you need to build better reports. These tools are well-known for helping teams interpret data, connect sources, and turn metrics into visuals.
But the real question is: which marketing data analytics tool saves you time?
Both Data Studio and Tableau offer plenty of features, but not all of them make your job easier.
In this guide, you’ll get a detailed comparison of Google Data Studio vs Tableau and find out why TapClicks might be the better option for your business.
Ready to level up from Looker Studio or Tableau? Book a demo with TapClicks!
What is Looker Studio (Google Data Studio)?
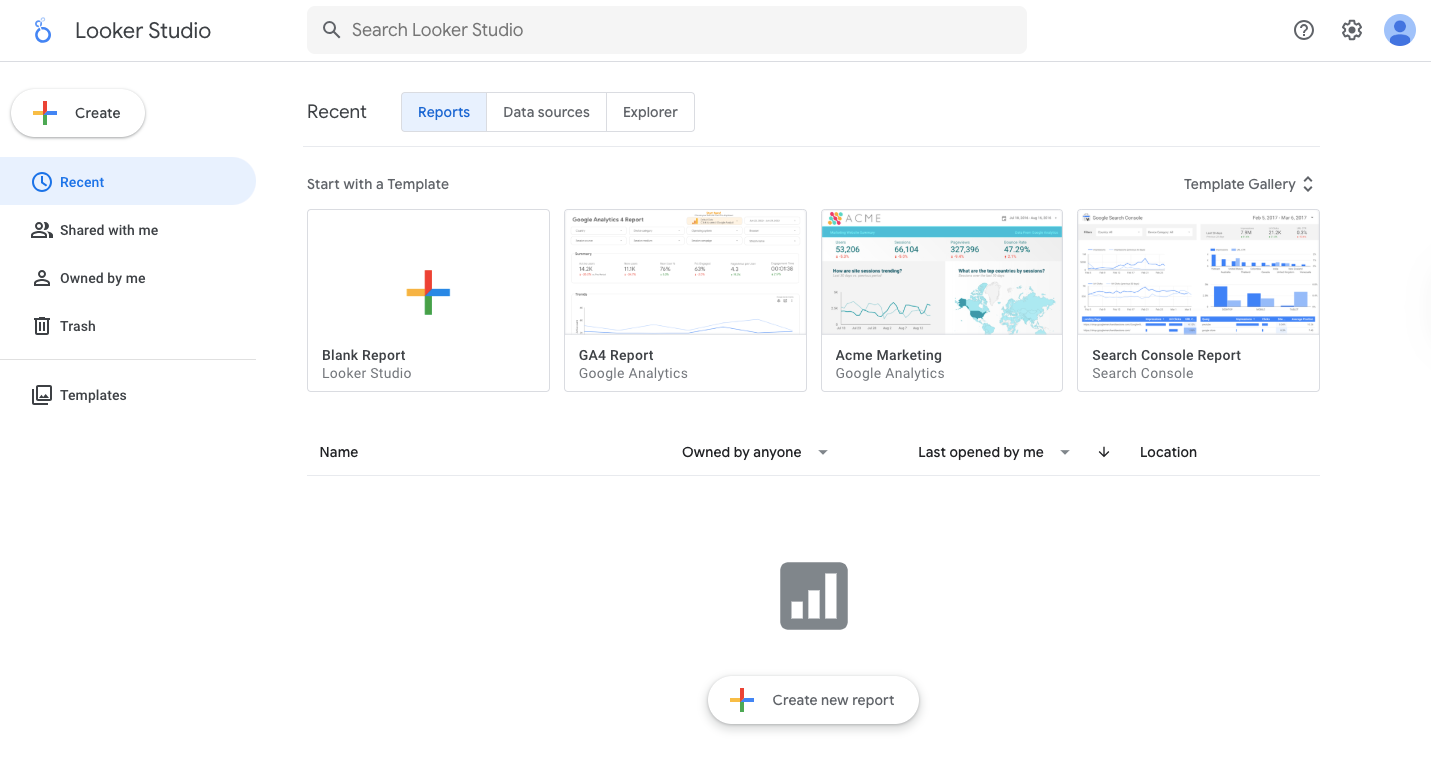
Image Source: lookerstudio.google.com
Looker Studio, previously known as Google Data Studio, is a free tool that lets you create simple dashboards and visual reports. It connects to Google Sheets, Google Analytics, and other Google apps and lets you process data from Google marketing tools in just a few clicks.
For simple reporting needs, it works well. You should use Looker Studio when your team wants to:
-
Make basic data charts
-
Schedule updates
-
Build visuals without writing SQL or touching code
The platform has native support for many data formats, including Excel and CSV, which gives you more flexibility across teams and clients.
Even though it’s easy to use, Looker Studio still allows a level of data manipulation. You can apply formulas, combine dimensions, and create custom fields for better data analysis.
While Looker Studio has real-time data and performance at scale as weak points, it’s still useful for smaller teams and recurring reports.
What is Tableau?
Image Source: tableau.com
Tableau is a paid data visualization software that has a long list of advanced features that help with custom fields, forecasting, drill-downs, and automated visuals.
Businesses use it to track trends, build dashboards, and create data reports across departments. It connects to spreadsheets, databases, and cloud warehouses to collect data and help teams spot patterns faster.
The platform further supports data cleaning, joins, filters, and blends, with built-in data cleansing capabilities and drag-and-drop controls. You’ll also find support for:
-
Cluster maps
-
Infographics
-
Advanced chart types
For smaller teams, Tableau can feel like too much. But for experienced data analysts working with larger datasets, it delivers strong performance. It can also manage complex data without crashing, even when you scale your dashboards across global teams.
Besides that, it supports many concurrent users and provides fast data processing while consuming marginal system resources, which makes it a fit for high-volume environments.
Still, it comes at a price. You’ll also experience a steep learning curve and some layout inconsistencies.
What is TapClicks?
TapClicks is a unified reporting platform built for marketers who want to move faster without losing accuracy. We combine campaign data, automated reporting, and performance insights all in one dashboard.
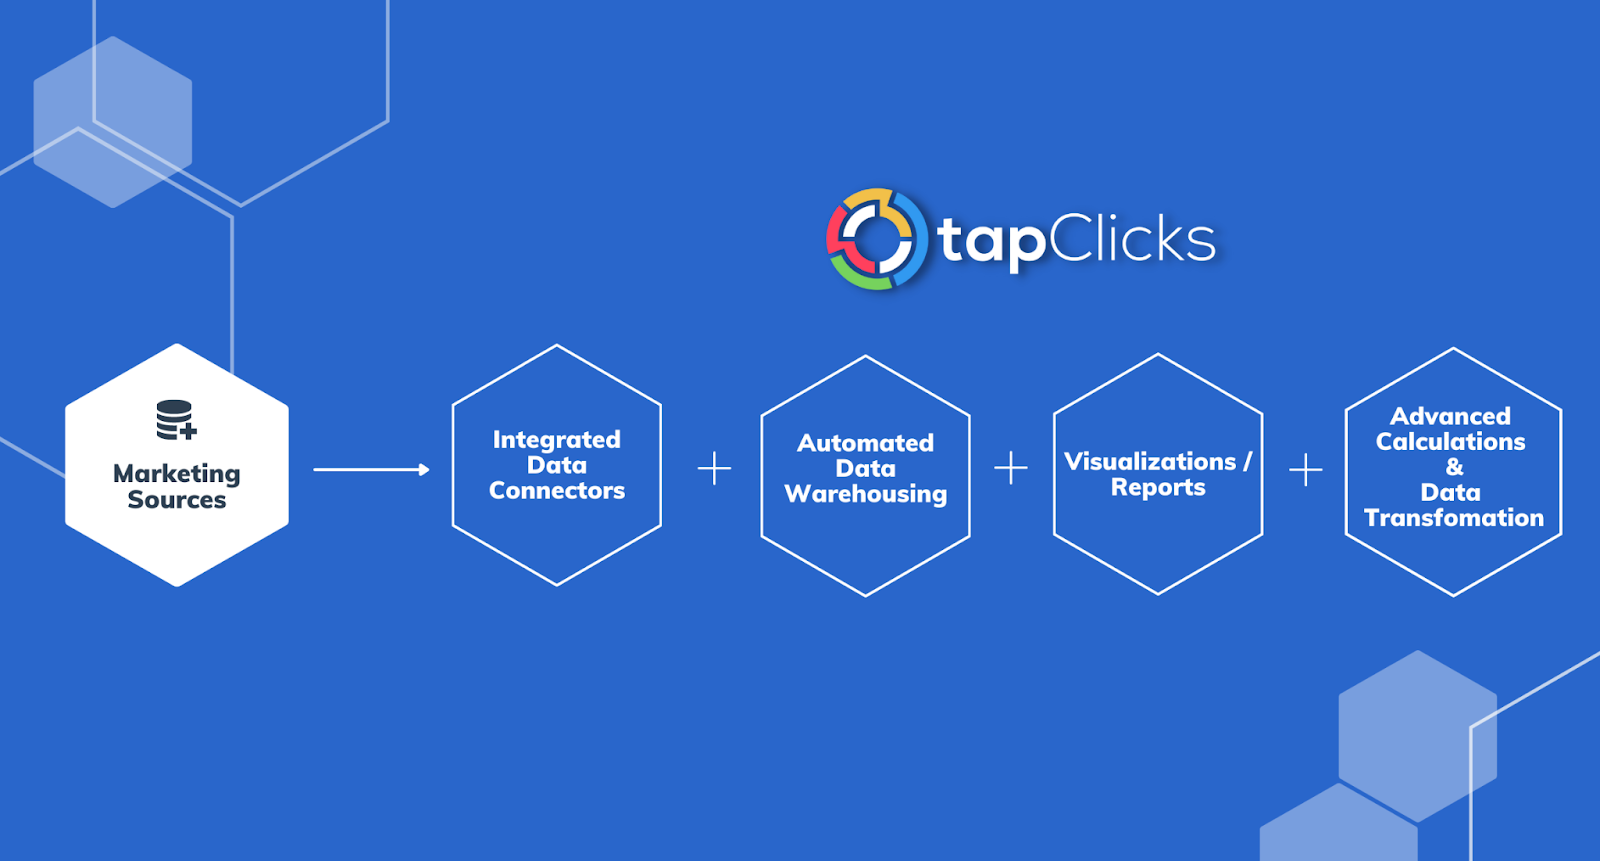
Our marketing reporting platform, TapClicks, covers all five key features that help you centralize your marketing performance and give you the tools to act on it. With it, you’ll be able to:
-
Integrate data from all your marketing platforms
-
Establish a centralized, permanent repository for all your data
-
Automate recurring calculations for reuse across campaigns, clients, dashboards, and reports
-
Build reusable dashboard templates applicable to multiple clients
-
Generate presentation-ready reports automatically populated with the latest data
How TapClicks Outperforms Google Data Studio and Tableau
Curious about what makes TapClicks a powerful tool?
Compared to Data Studio and Tableau, TapClicks simplifies complex reporting tasks and automates the time-consuming parts you’ve probably been doing manually. Let’s break down how it takes the lead across five essential areas of marketing analytics.
1. Pulls Data From Thousands of Sources
Both Data Studio and Tableau support platforms like Google Ads or Facebook, but that’s where things usually stop. When you need to pull data from broadcast platforms, demand-side platforms, or legacy databases, you’re stuck using extra tools or exporting spreadsheets. TapClicks handles that for you.
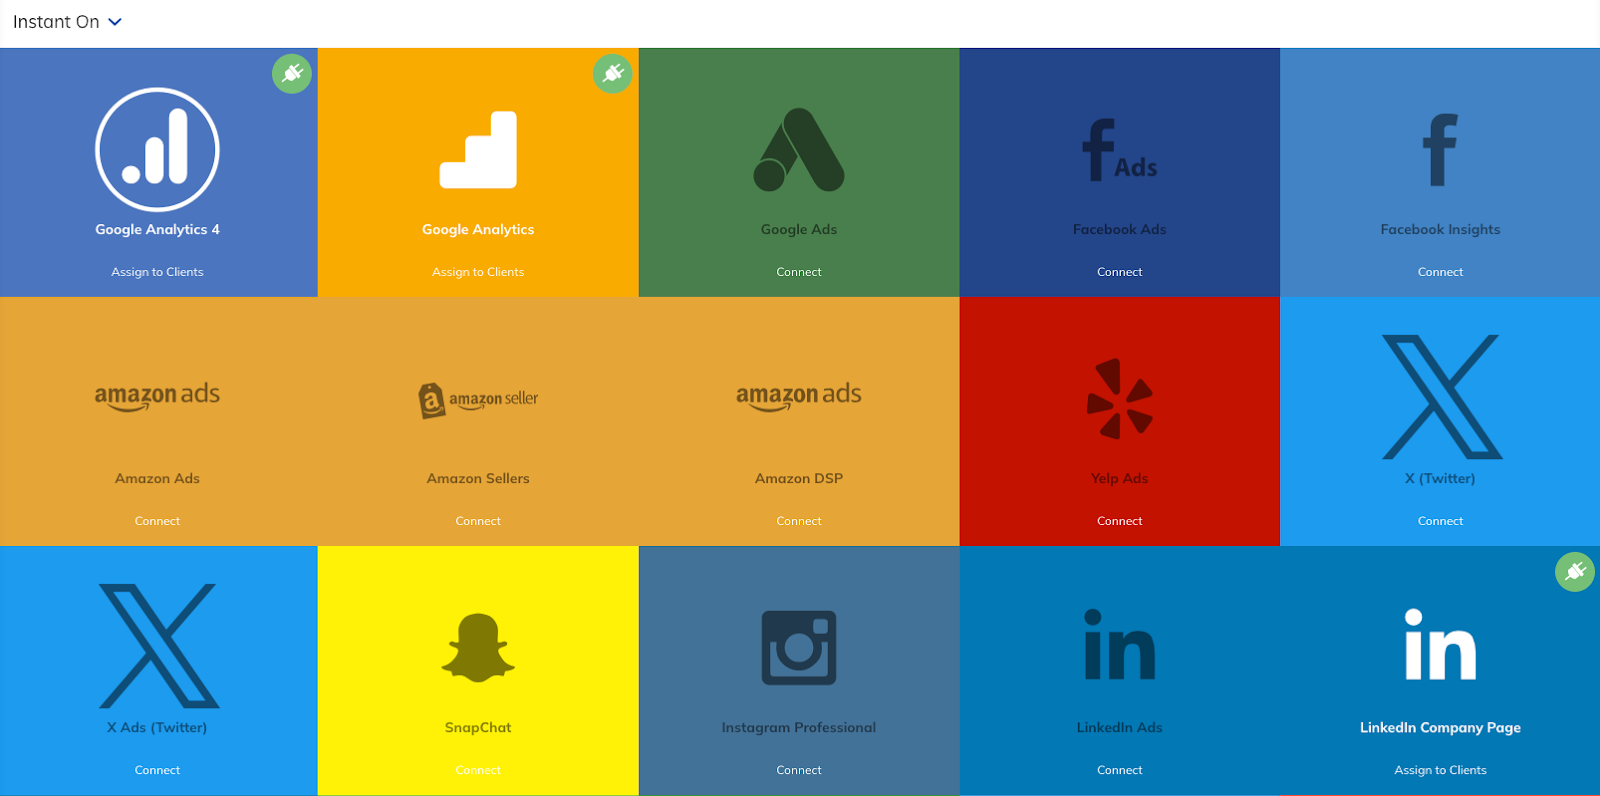
You get access to over 250 direct integrations out of the box, plus Smart Connectors that link to custom or offline sources. From Snowflake and Microsoft Azure to niche platforms like Genius Monkey and Verve, TapClicks doesn’t leave gaps.
We even support automatic historical data pulls, sometimes up to 12 months, so you can start with context, not just current numbers. No need to manage APIs either, as TapClicks does it for you.
2. Stores Your Marketing Data Permanently
Marketing data often disappears after 30 or 60 days, unless you’re backing it up somewhere else. For instance, Looker Studio doesn’t store data, while Tableau only stores data with the help of Tableau Server or another system.
TapClicks stores all your data in a fully managed, always-on warehouse built for marketers. Everything lives in one place.
You can run reports, track long-term trends, and compare performance year-over-year, even for platforms that don’t retain historical metrics by default. No more emailing your data team for a CSV export.
3. Automates Complex Calculations
TapClicks lets you build custom metrics once and reuse them across every dashboard, campaign, or client.
We also support grouped logic and campaign segmentation. You can assign campaign groups by product line, region, or brand, and pull them into unified metrics like “total spend” or “cost per click.” It replaces time-consuming Excel work with dynamic calculations you control.
4. Customizes Dashboards
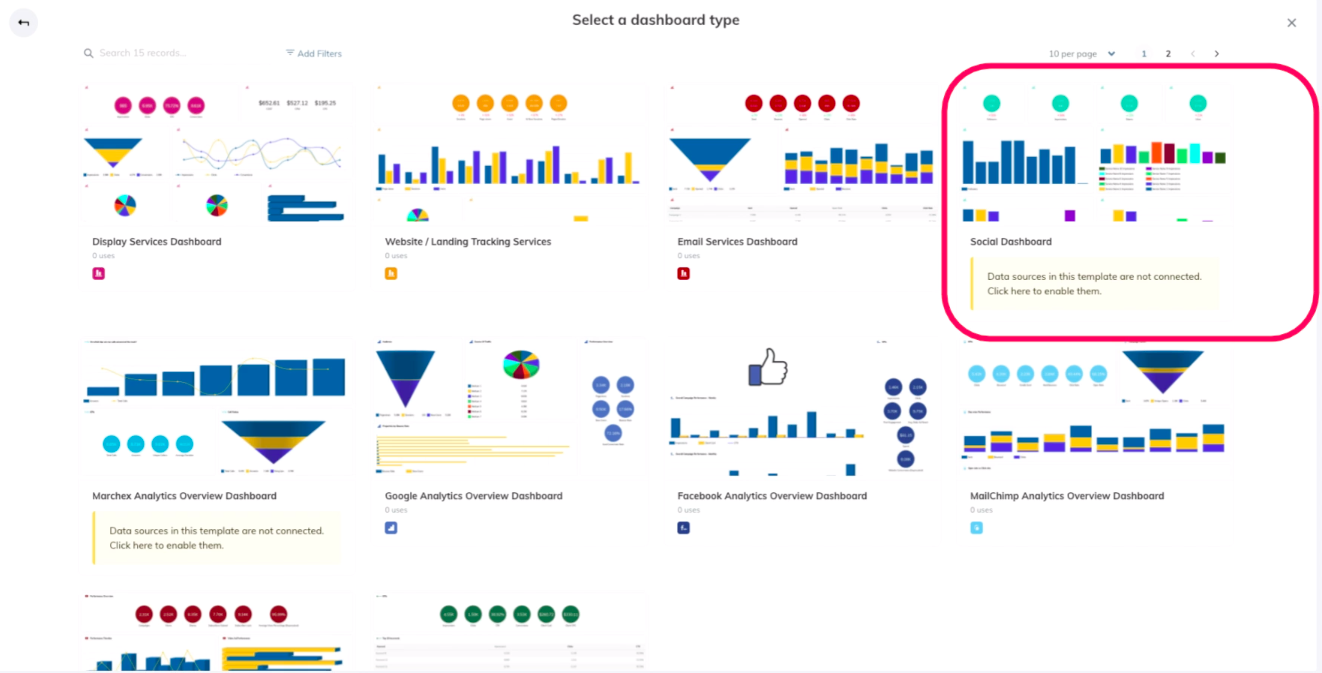
With TapClicks, you never have to update client dashboards one by one. You create dashboard templates, customize widgets, and apply changes across your entire client base in just a few clicks. That means no more copying reports or editing filters individually.
You can also control access down to the widget level. If you don’t want a client seeing markup costs or internal performance benchmarks, just exclude them.
Managing permissions for different users is simple too, and the dashboards remain active, which lets your clients easily check performance whenever they want, without having to wait for the next report.
5. Automates PowerPoint-Style Reports
You shouldn’t need to screenshot dashboards or build reports manually every month. TapClicks ReportStudio generates polished, white-labeled reports in PowerPoint, PDF, or CSV formats using the most up-to-date campaign data.
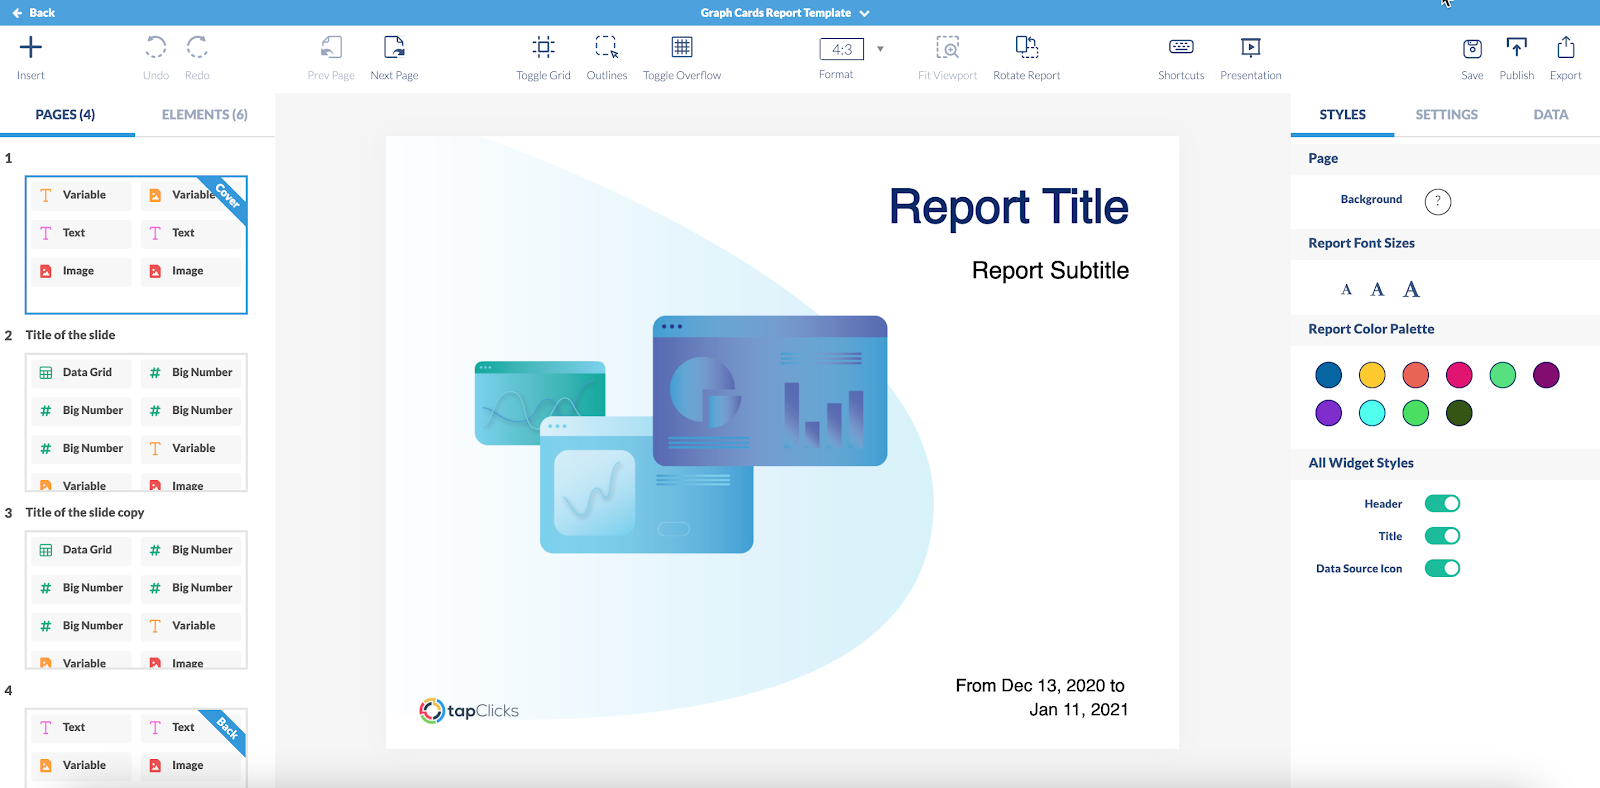
Once you’ve set it up, TapClicks pulls in your charts, metrics, and visuals automatically. You can send reports weekly, monthly, or on any custom schedule. And if you need to update the format later, it only takes a few clicks.
TapClicks delivers what Tableau and Looker Studio can’t. Book a demo with TapClicks today!
Google Data Studio vs Tableau: Feature-by-Feature Comparison
TapClicks offers a more complete solution for reporting and automation, but understanding the strengths and limits of Looker Studio (formerly Google Data Studio) and Tableau will help you make a fully informed choice.
Data Integration and Compatibility
Before you start creating reports, you need to get your data in one place. That’s where integration and compatibility come in. A reporting tool should connect to the platforms you already use and handle your inputs without breaking.
Looker Studio
Looker Studio connects directly to Google Analytics and other native sources such as:
-
Google Ads
-
Google Search Console
-
YouTube Analytics
You can also bring in spreadsheet tools like Google Sheets or tap into cloud platforms through BigQuery.
You’ll find more than a thousand partner connectors in its marketplace. That gives you access to MySQL, PostgreSQL, Amazon data, and many third-party tools. The system supports data blending, so you can combine information from multiple platforms inside the same report.
Just keep in mind that Looker Studio relies mostly on embedded connections. You’ll need to recreate them if you’re working across multiple reports. Some Looker Studio connectors also require third-party licenses.
Tableau
Tableau integrates with multiple data sources from Excel files, databases, APIs, cloud services, and enterprise tools. You can pull data from:
-
Snowflake
-
Redshift
-
Google BigQuery
-
Cloud-hosted SQL databases
It also connects to platforms like Salesforce and other customer relationship management systems. For larger companies using multiple tools and internal databases, the platform removes barriers and simplifies how you bring those systems together.
You can even do data extraction, blend data, and join across data types to build reports that reflect your full data picture.
Dashboard Design and Customization
The way you design and present data matters just as much. Your visualization tool should be built for the people using it.
Looker Studio
Looker Studio offers a wide range of styling options.
You can change themes, adjust layouts, and organize reports into clean, scrollable pages. Headers, section titles, and navigation menus are fully editable as well.
Want to add your logo or chart labels? You can place images, branded visuals, and notes anywhere on the canvas. And since Google Data Studio offerings include built-in templates and interaction filters, you can create interactive reports with just a few clicks.
The editing panel also allows calculated fields for metric transformations and filters for user interaction, which gives you more control without writing SQL.
Tableau
Tableau provides you with an interactive visual exploration.
The platform supports grid layouts, tiled designs, and device-specific formatting. You can organize sheets into containers, layer visuals, and adjust everything from padding to font scaling.
Besides that, it gives you full control over filters, drop-downs, tooltips, and clickable elements. You’ll also find visual types like pivot tables, heat maps, scorecards, and parameter-based charts. These options let you slice, drill, and explore data with a level of control not found in simpler tools.
Branding tools include custom color palettes, fonts, and high-resolution image support, so it’s easier to match internal or client style guides.
Data Blending and Cross-Source Analysis
Pulling data from different platforms into a single report helps you see the bigger picture. When a tool blends information from multiple sources correctly, it cuts reporting time and highlights relationships you might otherwise miss.
Looker Studio
Looker Studio supports data blending and drill-down analyses that help you merge sources like Google Ads, Google Analytics, and spreadsheets into a single chart or table. You can pick specific metrics and dimensions, then define a common join key, like a date or campaign name, to link the sets together.
The platform offers join types like inner, left outer, and full outer joins. Once blended, the new dataset can be used across visuals to show cross-channel performance in one view. That means you can track paid ad spend next to organic traffic or product revenue in a single report.
You also have full control over how these connections behave, which is helpful for simple cross-source analysis, especially when you’re reporting on basic marketing KPIs from two or three tools.
Tableau
Tableau handles more complex blending with ease. It supports multiple methods for cross-source analysis, including data blending, cross-database joins, and union options. You can work with structured and unstructured data, regardless of format or source.
The system links a primary and secondary data source using a shared field. Once linked, Tableau creates a blended view that pulls relevant metrics together, even when those sources have different structures. It also supports aggregation rules and lets you adjust granularity across sources.
You can join cloud data with local spreadsheets, combine fields from SQL servers and APIs, or pull insights from marketing and finance datasets in the same dashboard.
For advanced reporting setups, Tableau offers more control and customization than Looker Studio.
Reporting Automation and Scheduling
Automating reports helps you stay ahead without wasting time on repetitive tasks.
Looker Studio
Looker Studio makes basic report scheduling simple. After building your dashboard, you can schedule email delivery directly from the Share menu.
Choose how often the report goes out, such as daily, weekly, or monthly. Then, set your recipients, subject line, and message.
Having the Looker Studio Pro will let you schedule reports to Google Chat, create multiple delivery rules, and even add alert-based triggers for specific conditions in a chart. Filters can also be applied before sending, so recipients only see what’s relevant.
The scheduling feature of Looker Studio isn’t complicated, which makes it just fine if you need consistent updates without touching the dashboard again.
But keep in mind, it doesn’t support event-triggered automation or deep integrations with other business systems. For that, you’ll need a fuller setup.
Tableau
Tableau lets you use built-in schedulers within Tableau Cloud or Server to run reports on your preferred intervals. You can also integrate third-party tools if you need event-based triggers, like running a report after a database update.
For teams managing larger workflows, it offers automation for data prep through Tableau Prep Conductor, which makes sure your data is cleaned and ready before the report runs. You can even email reports, push them to shared folders, or embed them inside other platforms like CRMs or ERPs.
Other than that, it connects automation to deeper features. For example, Tableau offers a built-in data modeling solution that includes forecasting and trends. That means scheduled reports can include projections, not just historical data.
Collaboration and Sharing
Sharing reports should feel simple and secure, especially when multiple people need access or input.
Looker Studio
Looker Studio lets you work in a small group or across departments and edit and build reports together. It even allows you to collaborate on the same data visualization simultaneously without overwriting someone else’s work.
With Looker Studio, you can:
-
Invite people individually
-
Share with Google Groups
-
Send view-only links
Embedding your reports into websites or downloading as PDFs is also an option. For scheduled distribution, email delivery works well for recurring updates.
Control matters too. You choose who can view or edit, and you can limit downloading or copying. When you’re working with sensitive data, you can adjust access credentials so only the right users see the correct data.
For teams already using Google Workspace tools, such a setup feels familiar and keeps everyone aligned on the same page.
Tableau
Tableau provides more options for teams that need structured sharing. To manage and distribute dashboards, you can use:
-
Tableau Server
-
Tableau Online
-
Tableau Reader
These platforms support role-based access, version tracking, and shared editing.
Your team members can work on dashboards together or leave comments directly inside the workbook. That’s helpful when you’re breaking down trends or walking someone through results during a review.
For sensitive projects, Tableau offers password-enabled shared access to secure data reports. You choose who can view, edit, or interact with each dashboard and what they’re allowed to do once inside.
Pricing
After comparing the features, the price is the last thing you need to consider. Are these tools within your budget?
Looker Studio
Looker Studio is free to use if you’re handling basic dashboards and reports. You can invite collaborators, publish links, and connect to most Google products without any fees. That’ll suffice if you’re a marketer or freelancer who doesn’t need complex admin features.
For more control, Looker Studio Pro adds admin tools and access controls for $9 per user, per project, each month. The Pro plan will give you tighter permissions, scheduling to Google Chat, and better support.
Tableau
Tableau follows a flexible pricing system. Each license is priced based on the type of user and access level.
When you just need to consume data, Tableau Viewer costs $15 monthly. The Tableau Explorer costs $42 per month and gives access to web-based features through a Tableau Online license.
Meanwhile, Tableau Creator costs $75 per user monthly and includes Tableau Desktop, Tableau Prep Builder, and one Creator license for Tableau Server.
There’s also an Enterprise plan with higher-tier options: Viewer at $35, Explorer at $70, and Creator at $115.
Go Beyond the Basics of Tableau and Data Studio With TapClicks

Looker Studio and Tableau work well until you need more than dashboards.
With TapClicks, you eliminate the need for add-ons like ETL tools, database experts, or separate dashboarding platforms. Everything lives in one place, and you control how it works.
Want to combine spend from Facebook, OTT, and radio into a single line item? Done. Need to schedule monthly PowerPoint reports for 85 clients using custom metrics? TapClicks does that too.
Other than that, we give you a fully integrated system that handles:
-
Marketing data ingestion from 6,000+ platforms (and growing)
-
Advanced calculations and grouping logic that you define once
-
Historical storage for year-over-year insights
-
Custom, scalable dashboards that update automatically
-
Automated reporting that saves your team dozens of hours each month
Outgrown Google Data Studio and Tableau?
TapClicks handles deeper marketing needs with ease. Book a demo today!
FAQs About Google Data Studio vs Tableau
Is Google Looker Studio similar to Tableau?
Yes, Google Looker Studio is similar to Tableau in that both are visualization and data analytics tools used to create interactive dashboards and reports.
What is Google’s equivalent to Tableau?
Google’s equivalent to Tableau is Looker Studio, which was formerly called Google Data Studio.
What is the difference between Data Studio and Tableau?
The main difference between Data Studio and Tableau is that Looker Studio is free and cloud-native, while Tableau offers advanced developer tools like Tableau Desktop and Tableau Public and supports complex data modeling and on-premise deployment.
Is Google Data Studio still a thing?
Google Data Studio is still active under its new name, Looker Studio, and continues to support cloud-based data resources for reporting and analysis.