Datorama vs Data Studio: Which Tool Do Marketers Prefer?
Marketing reporting sounds simple until you’re the one pulling numbers from multiple tools, tweaking dashboards, and trying to explain why results don’t line up. It takes time that could be spent on strategy.
That’s why the Datorama vs Data Studio debate keeps coming up.
Marketers are looking for a way to reduce manual work and trust the insights they’re sharing. But do either of these tools actually deliver on that? Let’s take a closer look.
TL;DR
-
Datorama focuses on preparing marketing data for analysis, and Data Studio focuses on turning data into dashboards and reports.
-
Datorama offers stronger data management but often requires technical setup and ongoing manual input.
-
Data Studio is easier for reporting but can struggle with large datasets, limited customization, and data blending issues.
-
Each tool handles part of the reporting process, which can lead to gaps between data preparation, analysis, and reporting.
-
TapClicks brings these steps together with data integration, reporting, and AI insights in one platform.
What Is Datorama?
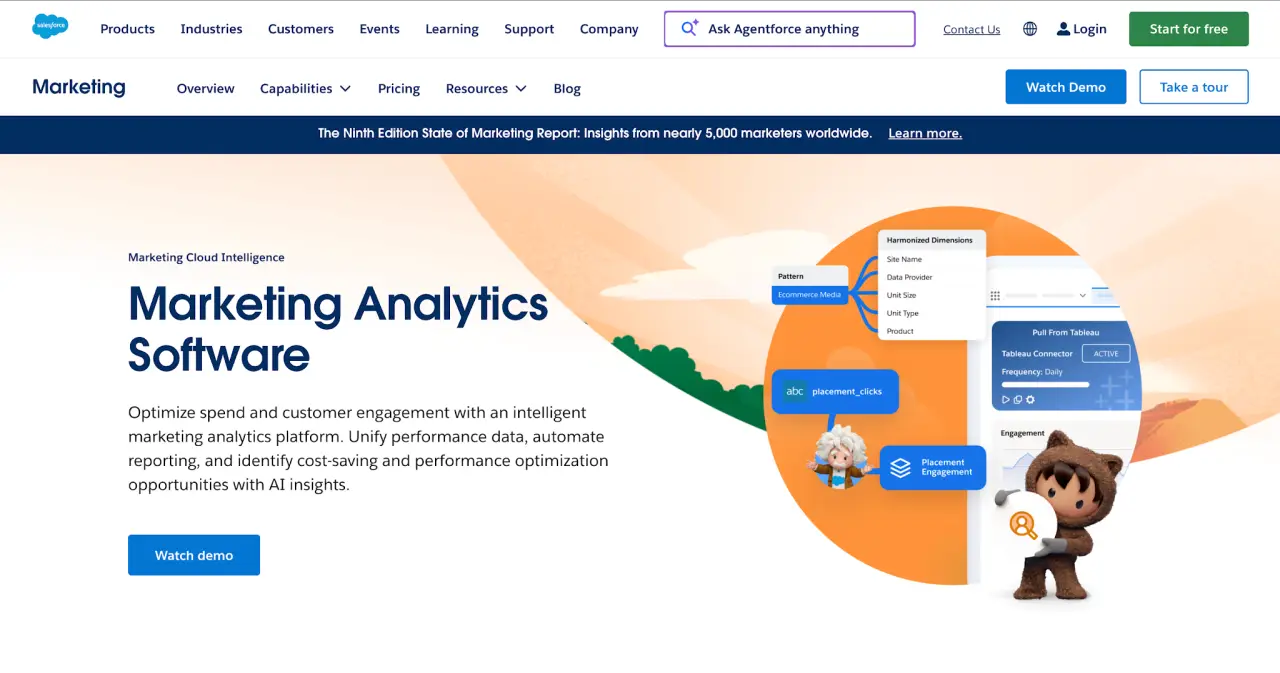
Image source: salesforce.com
Datorama, now called Marketing Cloud Intelligence, is Salesforce’s marketing analytics platform for teams that deal with large sets of marketing data.
It pulls in campaign, customer, and performance data from sources like Google Ads, customer relationship management (CRM) systems, ad platforms, databases, and flat files.
Teams use Datorama to organize that data, track campaign performance, and share reports. It’s mostly used by enterprise marketing teams that need more control over their data than a basic dashboard tool can offer.
Key features include:
-
170+ connectors: Datorama connects to major advertising platforms, CRMs, and databases. If a source isn’t supported, the Universal Connector lets you bring in data from files or custom systems.
-
Automated marketing data model: The platform organizes data into a consistent structure. It standardizes naming, groups metrics, and keeps reports easier to read.
-
Einstein Marketing Insights: Einstein looks at your data and highlights what’s driving performance based on your selected metrics.
-
Media planning and pacing tools: You can plan budgets, track campaign pacing, and adjust spend using past performance data.
-
Slack sharing and report delivery: Marketing teams can send updates through Slack, schedule reports, and share dashboards with stakeholders.
What Is Data Studio?
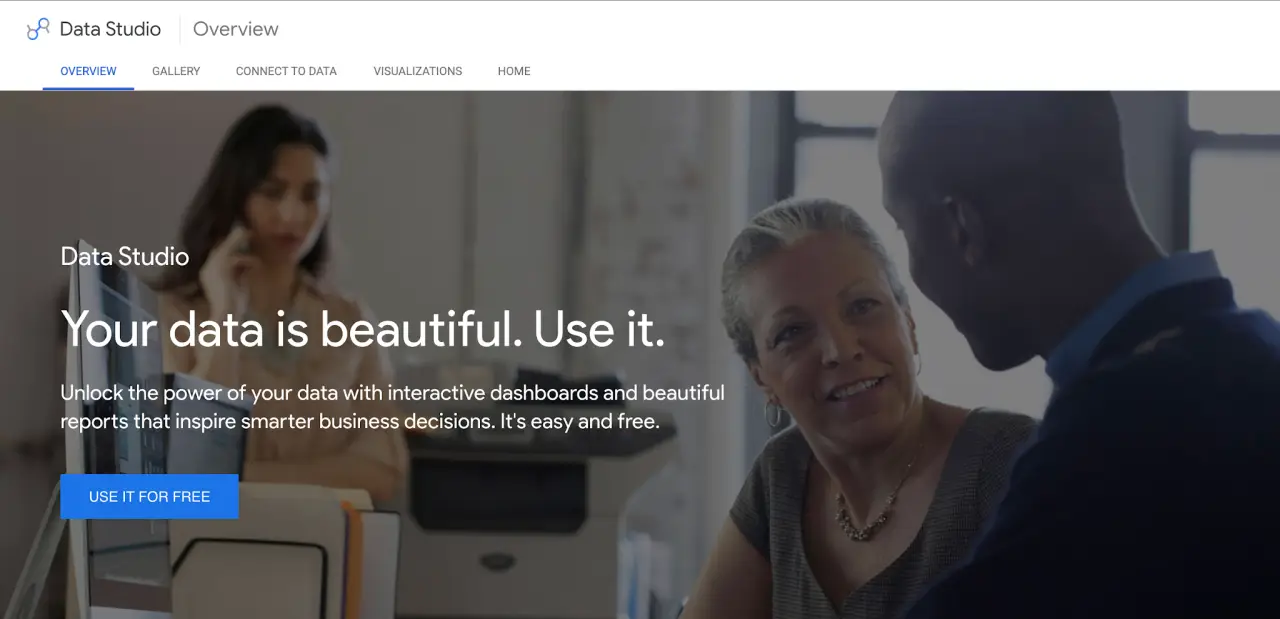
Image source: datastudio.google.com
Data Studio, previously known as Looker Studio, is a reporting and data visualization tool from Google Cloud.
Marketers use it to turn raw data from sources like Google Analytics, Google Ads, BigQuery, and Google Sheets into dashboards and reports.
It’s often used for digital marketing analytics, paid media reporting, website performance reviews, SEO reporting, and client updates.
The tool gives users a visual way to review performance metrics without writing code.
Key features include:
-
Interactive dashboards and data visualization: Users can create charts, tables, scorecards, filters, and date controls to review marketing performance from different angles.
-
Drag-and-drop report editor: The editor lets users add charts, text, images, and report pages through a visual interface.
-
Real-time collaboration and sharing: Reports can be shared with specific users or groups. They can also be embedded into web pages or internal portals.
-
Conversational analytics with BigQuery: Data Studio can connect with BigQuery conversational agents, giving users a way to explore data through plain language questions.
-
Access to Google Data Cloud assets: Users can browse and interact with reports, BigQuery conversational agents, and data apps created in Google Data Cloud.
Datorama and Google Data Studio Feature Comparison
Datorama and Data Studio cover different parts of the marketing analytics workflow, from data ingestion to reporting and analysis.
Data Integrations
Datorama provides more than 170 application programming interface (API) connectors, and its Universal Connector lets users ingest data from files, folders, and systems without direct integrations.
It focuses on marketing data management by organizing data from ad servers, CRMs, and databases into a structured format.
Data Studio connects to more than 1,400 data sources, including Google Ads, Google Analytics, BigQuery, and Google Sheets. It also offers over 1,300 community connectors and allows custom connectors.
Datorama organizes and prepares data before reporting begins. Data Studio connects data sources directly to dashboards.
Dashboarding and Visualization Options
Datorama provides dashboards with role-based views, along with prebuilt and custom widgets for reporting. It also supports branded dashboards through InstaBrand, which helps standardize how performance metrics appear in reports.
Data Studio centers on dashboard creation through a visual editor. Users can create multi-page reports with charts, tables, filters, and layout controls to review marketing performance.
Datorama leans toward structured reporting. Data Studio gives more control over layout and presentation.
Automation Features
Datorama automates parts of the reporting process, including connector updates, data classification, and scheduled outputs. It also uses historical data to guide media planning and campaign pacing.
Data Studio refreshes data from connected sources and allows scheduled report delivery. It also provides access to reports and data apps within Google Data Cloud.
Datorama connects automation to data preparation and reporting. Data Studio focuses on refreshing and sharing dashboards.
Data Blending, Modeling, and Transformations
Datorama uses a predefined marketing data model to organize campaign data. It applies naming rules and classification to prepare data for analysis and maintain consistency.
Data Studio lets users combine data from multiple sources within dashboards, including data stored in a data warehouse such as BigQuery.
Datorama standardizes data before analysis. Data Studio combines aggregated data during report creation.
Collaboration and Sharing
Datorama allows users to share insights through Slack, scheduled updates, embedded dashboards, and downloadable widgets.
Data Studio allows users to collaborate in real time, share reports through links, and embed dashboards into web pages or internal tools. It also provides access to shared data assets within Google Data Cloud.
Datorama focuses on report distribution. Data Studio emphasizes collaboration and shared access.
Ease of Use and Learning Curve
Data Studio offers a visual interface with drag-and-drop components, which helps new users start building dashboards without coding.
Datorama requires more initial setup, since users need to connect data sources, map data, and configure the marketing data model.
Data Studio is easier for new users. Datorama requires more configuration before reporting begins.
AI, Insights, and Anomaly Detection
Datorama includes Einstein Marketing Insights, where users select a key performance indicator (KPI), and the system surfaces patterns, outliers, and performance drivers using AI-driven insights.
Data Studio connects with BigQuery conversational agents, which allow users to analyze data using natural language queries (NLQ).
Datorama focuses on marketing intelligence and campaign performance analysis. Data Studio focuses on conversational data exploration.
Limitations Users Encounter With Datorama and Google Data Studio
Once reporting needs get more complex, users often run into issues with setup, data preparation, usability, and manual work.
What Users Dislike About Datorama
Marketing Cloud Intelligence operates within the Salesforce ecosystem, and many users say it takes time to learn. The initial setup can feel difficult, especially when working with customer data and configuring how campaigns and metrics connect.
SQL server requirements come up often in daily tasks. Users rely on SQL for segmentation, campaign setup, and troubleshooting. That adds technical work to processes that many marketers expect to manage without coding.
The interface can slow progress. Users mention that finding specific features takes effort, and permission settings often require trial and error. Several also point out the need for third-party plug-ins to unlock more functionality.
Even with built-in business intelligence (BI) features, users still manage segmentation, setup, and optimization manually. Many say stronger AI guidance for these tasks would make the platform easier to manage.
What Users Dislike About Data Studio
Data Studio users often mention limits with data labeling and deeper data analysis. When reports don’t show enough detail, users may need help from data or analytics teams before they can answer more specific performance questions.
Performance also becomes an issue with larger datasets. Reports connected to large spreadsheets or high volumes of data rows can take longer to load or return errors.
Customization can feel limited. Users can create dashboards quickly, but adjusting chart details or layouts to match specific reporting requirements isn’t always possible.
Data blending creates another challenge. When users combine sources like ad spend and conversion data, mismatched fields or missing values can appear. Resolving those issues often requires manual updates or custom calculations.
Why TapClicks Stands Out Against Datorama and Data Studio
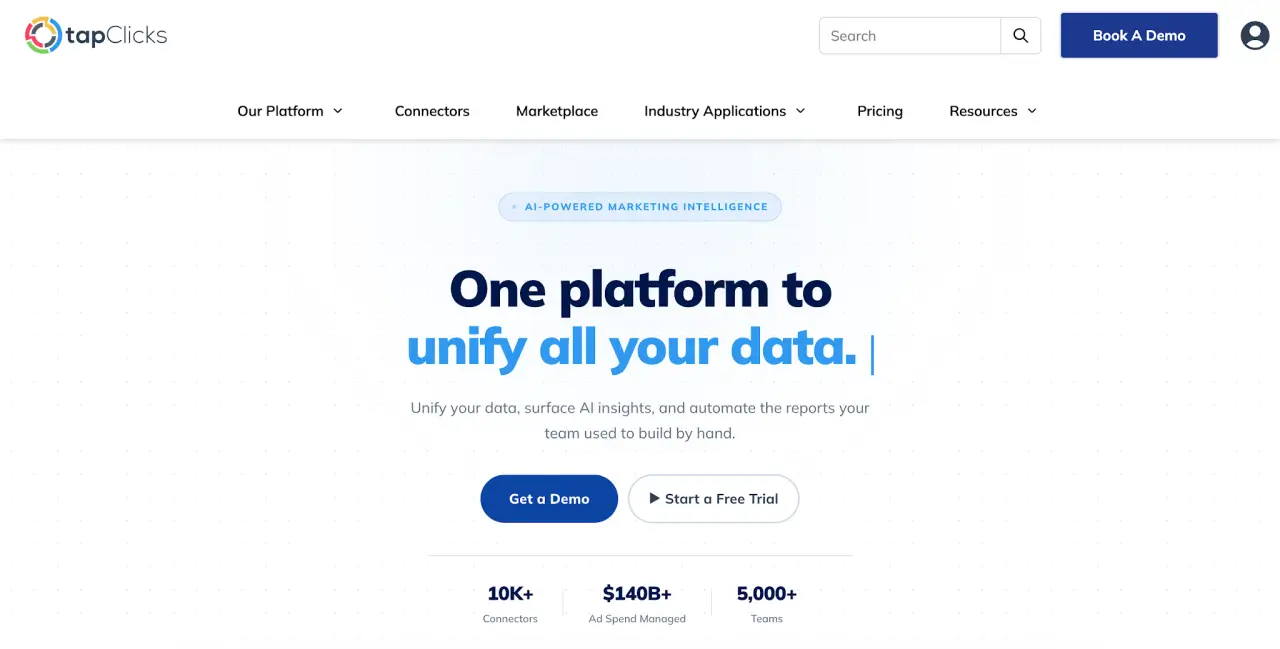
TapClicks brings data integration, reporting, and AI into one platform, so teams don’t have to rely on separate marketing analytics solutions.
Data Integration With 10,000+ Connectors
TapClicks supports over 10,000 connectors, including ad platforms, CRM systems, analytics tools, SEO tools, offline files, and sources without APIs.
TapData ingests and organizes that data, with support for historical backfill, multi-account ingestion, and multi-location setups.
It also standardizes campaign naming and metric definitions through automated data harmonization. That gives teams a complete picture of performance by channel without manual exports or patchwork pipelines.
AI Insights That Explain Marketing Performance
TapClicks uses AI Insights Agents to scan campaign data, flag anomalies, and highlight trends tied to business goals.
SmartReports includes AI-generated summaries in emails, so stakeholders can review key takeaways without opening dashboards. SmartStory and SmartSlides turn data analytics into presentation-ready reports with explanations and next steps.
Users can also query dashboards in plain language or create custom AI agents. For marketing agencies, this adds agentic marketing analytics to recurring reports and campaign reviews.
Data Preparation Without SQL or Manual Fixes
TapClicks lets users join, rename, calculate, and organize datasets without SQL. AI-assisted transformation helps prepare complex data faster.
The platform blends data from multiple sources before reporting, so teams can compare paid media, SEO, CRM, and conversion data without mismatched fields.
Users can also send structured datasets to Tableau, Looker Studio, Power BI, Snowflake, BigQuery, and Redshift.
Automated Reports and Presentations
SmartReports lets teams create reusable templates and schedule delivery, so reports stay consistent over time.
SmartSlides generates presentation decks, SmartEmail sends stakeholder updates, and Report Studio lets users create reports with a drag-and-drop interface.
Unify Your Marketing Channels and Reporting With TapClicks
Datorama focuses on structured data management, and Data Studio focuses on dashboard creation. Both tools help with reporting, but they still leave gaps when you need deeper analysis, consistent data, or a smoother reporting workflow.
TapClicks connects those pieces. It pulls data from your sources, organizes it with consistent data granularity, and turns it into reports, dashboards, and presentations without relying on separate systems.
You can review campaign performance, track the customer journey, and deliver updates without stitching together multiple tools.
FAQs About Datorama vs Data Studio
What is the key difference between Datorama and Data Studio?
Datorama focuses on organizing and preparing marketing data before it ever reaches a report, while Data Studio focuses on turning that data into dashboards.
In simple terms, the Datorama platform helps organize your data, and Data Studio helps you visualize it.
What is Datorama now called?
Datorama is now called Marketing Cloud Intelligence. It’s part of Salesforce and is used for managing marketing data, reporting, and performance analysis.
Is Data Studio now Looker Studio?
Data Studio was previously called Looker Studio. Google later brought back the Data Studio name as part of its broader analytics tools, which often connect to sources like a data lake for reporting.
How much does Datorama cost?
Marketing Cloud Intelligence starts at about $10,000 per organization per month, billed annually. The final price depends on your setup, including customization options and any additional tools you include.