
5 Best Dashboard Tools for Client Reporting in 2026
You’ve probably noticed that reporting takes longer than it should, and it always lands at the worst time.
Metrics come from ad platforms, analytics tools, and customer relationship management (CRM) systems, but they rarely align. One delayed update can change the entire narrative you planned to share with a client.
The right dashboard software brings marketing metrics together and refreshes them automatically. You spend less time double-checking reports and more time improving results.
This guide reviews the best dashboard tools agencies rely on in 2026.
TL;DR
Here’s a quick snapshot of the best dashboard tools marketing agencies rely on in 2026:
-
Microsoft Power BI
-
AgencyAnalytics
-
Looker Studio
-
Whatagraph
Why Agencies Rely on Dashboard Tools for Client Reporting
Dashboard tools help agencies answer performance questions with more confidence. Clients want updates they can understand right away, without long explanations or follow-ups.
Interactive dashboards and data visualization tools make this easier by presenting key performance indicators (KPIs) through charts and reports that are quick to scan.
Research published by IJCRT shows the value of this setup. The study found that 85% of users made decisions faster after adopting interactive dashboards, and 78% rated them as easy to use.
For agencies, this leads to clearer data storytelling, more productive client conversations, and fewer last-minute reporting issues during performance reviews.
Top 5 Dashboard Tools To Consider in 2026
The tools below help you keep client reporting consistent as marketing data changes. The differences between them become clear once reports run on a regular schedule.
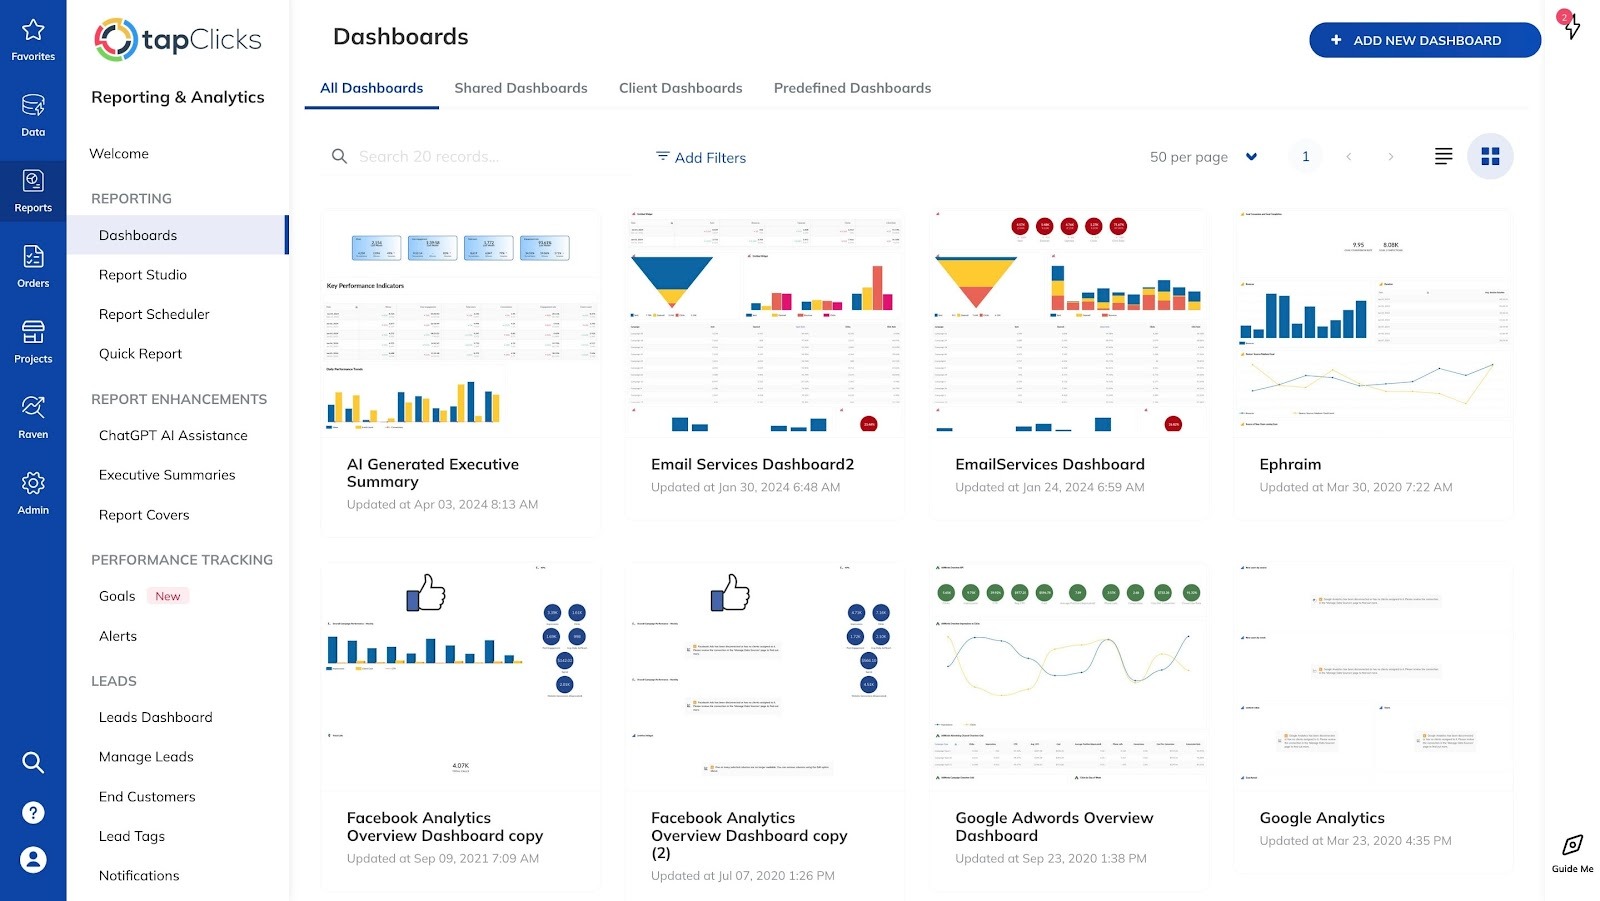
1. TapClicks
TapClicks gives agencies one dashboard per client that reflects everything happening in their marketing campaigns.
Data from paid media, search engine optimization (SEO), web analytics, and offline sources connect into one reporting view, so teams don’t bounce between tools during reviews.
These dashboards automatically adjust when connected services change, which keeps each client’s dashboard accurate and relevant without repeated fixes.
Dashboards can be shared on a schedule through the Report Scheduler or included inside Report Studio presentations for client meetings.
Access isn’t capped, so agencies can share dashboards with clients, executives, account managers, and sales teams without added fees.
Marketing teams can also create different dashboards for different audiences, such as executive summaries or detailed campaign views.
Key Features
-
Auto-recomposing dashboards that adjust as connected platforms change
-
Pre-built dashboard templates based on channel-specific KPIs and industry best practices
-
Freehand dashboard creation for fully custom reporting layouts
-
Drag-and-drop interface for adding and arranging widgets
-
Interactive charts and interactive reports with real-time updates
-
Unlimited dashboard access for clients and internal teams
-
Flexible scheduling through live links or presentation delivery
-
Benchmark widgets for comparing performance against industry data
-
More than 250 instant-on API connectors for popular marketing platforms, and 6,000+ data sources available through Smart Connector
Turn Dashboards Into Client-Ready Stories
TapClicks includes SmartStory, which turns dashboard visualizations into executive-ready presentations in minutes.
Instead of writing summaries or formatting slides, you get clear narratives and visuals generated from marketing performance data.
SmartStory works with more than 30 connectors and custom channels, which helps you combine data from different sources and keep reporting consistent for every account.
Build and Manage Dashboards Easily
It's easy to create dashboards in TapClicks. You can get a client dashboard up and running in minutes by following these steps:
-
Choose a pre-built dashboard template or start from a blank layout
-
Name the dashboard and select one or more data profiles
-
Assign a business unit and pre-filter the dashboard to a specific client
-
Apply brand styling such as font sizes and color palettes
-
Save the dashboard and add widgets like charts, tables, text, or images
-
Simplify your reporting by using one dashboard for multiple clients via filtering
2. Microsoft Power BI
Image source: microsoft.com
Power BI dashboards give agencies a single page to review key metrics. Each dashboard exists in the Power BI service and is built by pinning tiles from reports.
When you select a tile, Power BI opens the report and data model behind it, which makes dashboards useful as an entry point rather than a full reporting view.
You can view and share dashboards on desktop and mobile, but you can’t create or edit them outside the Power BI service.
Dashboard creation requires report-edit permissions, so setup usually falls to analysts or technically skilled users.
Dashboards can include tiles from multiple reports and data sources, including cloud and on-premises systems, while deeper filtering and analysis stay inside the reports.
Key Features
-
One-page dashboards created in the Power BI service
-
Tiles pinned from reports with click-through to detailed views
-
Support for cloud and on-premises data sources
-
Automatic refresh when underlying data updates
-
Desktop and mobile viewing and sharing
Pros
Power BI supports complex data analysis and detailed reporting. Marketing agencies with technical expertise can build advanced reports and use dashboards as a monitoring layer.
Cons
Dashboards are limited to one page and rely heavily on reports for context. Users mentioned that interactions and formatting options don’t carry over when visuals are pinned.
The learning curve around data modeling and DAX can slow adoption, and advanced features require paid licenses.
3. AgencyAnalytics
Image source: agencyanalytics.com
AgencyAnalytics helps agencies manage client reporting through customizable dashboards built around marketing performance.
Client dashboards display metrics from SEO, paid ads, social media, email marketing, ecommerce, and call tracking in one place.
Widgets from Google Analytics 4, Google Ads, Facebook Ads, Mailchimp, BrightLocal, and other platforms can appear side by side, which simplifies campaign reviews.
Dashboards can start from a blank canvas, a pre-built template, or a cloned client setup. Editing happens directly within the dashboard, where widgets, section headers, notes, and embedded content can be added or adjusted.
Agencies can also create custom metrics, blend values from multiple platforms, and annotate charts to add context around campaign changes.
Key Features
-
Customizable dashboards with widget-based layouts
-
80+ integrations supporting multiple data sources
-
Pre-built templates, cloning, and blank dashboard creation
-
Interactive visualizations, goals, benchmarks, and annotations
-
Automated client reports via links, email, PDF, or presentation mode
-
White-label branding with reusable themes and custom domains
Pros
Marketing teams can reuse dashboards and templates across accounts. Automated delivery and branding options reduce repeated setup and help keep reporting consistent.
Cons
Some configuration takes time to learn, especially for custom metrics and tables. Users also note that certain integrations may update more slowly, and advanced configuration can take additional time to master.
4. Looker Studio

Image source: lookerstudio.google.com
Looker Studio, previously known as Google Data Studio, is often used to create and share marketing reports. It connects directly to Google Analytics and other Google platforms, which makes data access simple from the start.
The drag-and-drop editor helps teams build dashboards without technical setup, making it a practical choice for everyday reporting.
Looker Studio works well when agencies need a clear way to present data from different sources in one report. You can blend data from Google tools, spreadsheets, and other platforms to get a broader view of performance.
Date controls and filters allow users to explore metrics on their own, which helps turn data into useful marketing insights.
Key Features
-
Direct connections to Google Analytics and other Google products
-
Drag-and-drop dashboard builder
-
Blended data from different data sources
-
Date range controls and viewer filters
-
Shareable dashboards with basic branding
Pros
Looker Studio is user-friendly and quick to learn. Marketing companies that use Google Analytics can build effective dashboards in a single platform and share them easily with clients or internal teams.
Cons
Dashboards can slow down as reports expand or data sources get more complex. Advanced calculations and deeper analysis are limited, and layout control is basic compared to other business intelligence tools.
5. Whatagraph
Image source: whatagraph.com
Whatagraph supports agencies that manage cross-channel reporting and frequent client updates.
Dashboards show performance metrics from paid ads, social platforms, SEO, email, ecommerce, and CRM tools in a single location. This setup reduces complex processes when reviewing marketing data from several platforms.
Dashboard design uses charts, tables, graphs, and media widgets that place ad visuals or social posts next to performance results.
Data displayed from multiple sources can appear inside the same widget, which makes comparisons easier to understand.
Custom formulas and renamed metrics help turn results into useful data insights, while saved templates shorten setup time for new accounts.
Dashboards can be shared through secure links, scheduled emails, or automated delivery. White-label customization options cover logos, colors, fonts, messaging, and custom domains, keeping reporting on brand.
Key Features
-
Cross-channel dashboards using multiple sources
-
Drag-and-drop dashboard design with customizable widgets
-
Pre-built templates and reusable layouts
-
Interactive dashboards with up-to-date metrics
-
Automated report delivery and secure sharing links
-
White-label branding with custom domains
Pros
Whatagraph enables users to create client-ready dashboards and reuse templates across accounts.
Automated sharing and interactive views help highlight actionable insights without complicating the reporting process.
Cons
Users mentioned that editing the same dashboard at the same time can cause widget issues.
Support for some advertising platforms is missing, and URL customization options are limited, which may restrict certain reporting workflows.
Simplify Dashboard Creation With TapClicks
Agencies feel reporting pressure when the same performance questions surface repeatedly, and answers take time to assemble. That cycle draws analysts away from deeper review and slows client conversations.
Automated dashboards reduce that strain by keeping reports updated without constant intervention.
TapClicks dashboards support this change with real-time dashboards that reflect platform updates as they happen.
Easy integration with marketing platforms reduces setup time, while built-in intelligence highlights valuable insights that explain performance changes in plain language.
Marketing analysts can review trends and patterns in detail.
Interactive dashboards also outperform static reports. Clients can adjust date ranges, explore metrics, and review performance on demand.
That access leads to more focused discussions during reviews, without waiting for another report to be sent.
FAQs About Dashboard Tools
Which tool is best for dashboards?
The best dashboard tool depends on reporting needs, data sources, and how frequently dashboards are shared.
Marketing teams handling recurring client reporting often choose platforms like TapClicks due to automation, scheduled delivery, and client-ready dashboards.
What are dashboarding tools?
Dashboarding tools are platforms that present performance metrics in visual formats such as charts and reports. They help teams review results, track progress, and answer questions without rebuilding reports.
Platforms such as TapClicks, Power BI, Looker Studio, Zoho Analytics, and HubSpot support different use cases, ranging from marketing performance to product usage.
What are the four types of dashboards?
The four common types are operational, analytical, strategic, and tactical dashboards. Each type supports a different goal, from routine monitoring to long-term performance tracking.
The right choice depends on how often the dashboard is reviewed and what decisions it needs to support.