
AgencyAnalytics vs Looker Studio: What’s the Difference?
Your client meeting is tomorrow, and the dashboard looks polished. But when someone asks why conversions dipped or which channel drove profit, the room goes quiet.
Moments like this fuel the ongoing debate around AgencyAnalytics vs Looker Studio in agency circles. Both promise sleek reports and unified dashboards.
However, once you connect multiple data sources and manage several client accounts at once, the differences start to show.
Before making a decision, it helps to look past surface-level visuals and consider how each platform handles reporting depth and automation.
TL;DR
-
AgencyAnalytics favors automated client reporting, while Looker Studio offers deeper custom analysis.
-
AgencyAnalytics speeds up recurring reports with templates and scheduling.
-
Looker Studio provides flexible dashboards with broad Google data integrations.
-
Neither platform fully handles data ingestion, financial logic, or operational workflows.
-
TapClicks unifies data, automation, SEO insights, and reporting in one platform.
What Is AgencyAnalytics?
Image source: agencyanalytics.com
AgencyAnalytics is a marketing reporting tool that helps you centralize marketing data and simplify client reporting.
It pulls data from more than 80 marketing platforms, including Google Ads, search engine optimization (SEO) tools, and web analytics sources, into unified dashboards.
Instead of relying on manual reporting in spreadsheets, marketers use it to present data through customizable dashboards and automated reports.
The focus is on turning campaign performance and key performance indicators (KPIs) into branded, client-friendly reports that are easy to share.
Key Features
-
80+ integrations to pull data from Google Ads, SEO tools, social media platforms, and other marketing channels
-
Drag-and-drop interface for customizable dashboards and custom reports
-
Prebuilt report templates for SEO, pay-per-click (PPC), and other marketing campaigns
-
White-labeled branded reports with custom logos, colors, and domains
-
Automated reports with scheduled delivery and optional approval workflows
-
AI Summary and Ask AI for quick overviews of performance data
-
Alerts triggered by key metrics and campaign thresholds
-
Forecasting tools to analyze trends and project performance
-
Mobile access for viewing dashboards and sharing reports
What Is Looker Studio?

Image source: lookerstudio.google.com
Looker Studio (formerly Google Data Studio) is a browser-based data visualization tool within Google Marketing Platform.
Marketing agencies use it to connect data from multiple sources and present performance metrics through interactive dashboards.
It connects to Google Analytics, Google Ads, Search Console, BigQuery, Google Sheets, SQL databases, and hundreds of partner connectors.
Analysts consolidate campaign data, web analytics, and paid media metrics into one reporting view without exporting spreadsheets.
The platform emphasizes visual reporting and exploratory data analysis. Users design marketing dashboards with charts, tables, filters, and date controls that let stakeholders explore performance metrics.
Key Features
-
600+ partner connectors for marketing platforms, databases, and flat files
-
Native integrations with GA4, Google Ads, Search Console, YouTube, and BigQuery
-
Drag and drop editor with snap-to-grid canvas and custom property panels
-
Custom metrics and calculated fields for modeling complex data
-
Embedded analytics for client portals or internal websites
-
Real-time collaboration with shared editing and revision history
-
Application programming interface (API) access for asset management within Google Workspace
AgencyAnalytics vs Looker Studio: Key Differences Explained
Agencies comparing AgencyAnalytics and Looker Studio usually want to know which reporting tool is right for their workflow.
The answer depends on how you handle client data, complex reporting needs, and ongoing report delivery.
Ease of Use and Setup
AgencyAnalytics prioritizes speed when creating reports. Templates and predefined layouts shorten the time between connecting accounts and delivering client-ready dashboards.
Looker Studio takes a different approach. You can connect data sources first, then design the reporting structure manually. That flexibility appeals to analysts, but it requires more hands-on configuration before reports look presentation-ready.
Data Connections and Flexibility
AgencyAnalytics focuses on marketing analytics tools. Its integrations target common ad platforms, SEO software, and web analytics sources. Most agencies find their core channels covered without extra configuration.
Looker Studio offers broader data connections, including SQL databases and BigQuery. Agencies with a data warehouse or more advanced tools benefit from that openness.
However, blending all the data into one coherent view often requires manual setup.
Automation and Ongoing Reporting
AgencyAnalytics emphasizes recurring client delivery. Scheduled reports and approval steps simplify ongoing report creation for multiple accounts.
Looker Studio supports sharing and scheduled emails, but it doesn’t include a built-in approval layer. Agencies rely on internal processes rather than system-driven workflow.
Data Analysis and Advanced Reporting
Looker Studio handles deeper data analysis. Analysts explore data with calculated fields, blended sources, and custom metrics that address complex reporting scenarios.
AgencyAnalytics concentrates more on consistent presentation. It covers standard performance reporting, but agencies with complex reporting needs may prefer Looker Studio’s analytical depth.
Managing Access and Oversight
Looker Studio integrates with Google Workspace, which helps organizations manage unlimited users and permissions.
Enterprise environments sometimes combine it with external security service layers or perform security verification through Google Admin tools.
AgencyAnalytics focuses less on technical governance and more on client-facing reporting. Its value lies in operational simplicity rather than advanced infrastructure management.
Challenges Users Face With AgencyAnalytics and Looker Studio
Feature lists rarely reveal daily constraints. Those appear when reporting moves beyond basic reporting into deeper data analysis, financial logic, and multi-client oversight.
AgencyAnalytics Limitations
AgencyAnalytics simplifies automated client reporting, yet advanced filtering feels restrictive.
Users often struggle to isolate granular keyword data, specific conversion names, or layered campaign segments without exporting data.
Managing multiple clients adds complexity. When account managers edit a report, the platform generates a new link, which complicates distribution and version tracking.
The platform focuses on presentation rather than full data integration. Margin calculations, markup logic, and custom financial views frequently move into spreadsheets.
Data teams that want to model data or connect reporting to a data warehouse often rely on external business intelligence (BI) tools for advanced analysis.
Looker Studio Limitations
Looker Studio offers flexible dashboards, yet complex reporting requires technical expertise. Blended data sources, calculated fields, and cross-channel metrics demand hands-on configuration.
Large datasets slow performance during stakeholder reviews. Some third-party connectors require troubleshooting, especially when other Google tool data refreshes inconsistently or malicious bots distort metrics.
Looker Studio prioritizes visualization over operational workflow. It doesn’t include automated client reporting processes or account-level management features for organizations that manage multiple clients.
Reporting Without Data Integration Is Only Half the Picture
Dashboards visualize performance. They don’t manage how raw marketing data enters the system, gets standardized, or connects to revenue before it appears in a report.
Most reporting tools emphasize presentation over full data integration. As reporting complexity increases, critical processes move outside the platform:
-
Margin and markup calculations handled in spreadsheets
-
Budget pacing tracked separately from ad platform spend
-
Order intake and trafficking details are stored in other systems
-
Cross-channel unification managed through manual exports
Unlimited reports don’t fix fragmented workflows. When ingestion, transformation, and reporting operate in isolation, inconsistencies creep in and slow data analysis.
Marketing teams reconcile numbers instead of extracting actionable insights.
A complete data analytics solution consolidates ingestion, normalization, financial logic, and reporting in one environment. Every dashboard reflects the same underlying calculations.
Why TapClicks Is a Better Alternative to AgencyAnalytics and Looker Studio
Most reporting tools focus on charts. TapClicks connects intake, SEO monitoring, analytics, and reporting inside one platform, so you don’t jump between systems to understand performance.
Unified SEO and Marketing Data
TapClicks consolidates analytics, ad platforms, CRM data, and SEO tools into one repository.
It also imports flat files and sources without APIs, so historical data remains intact for trend comparisons and benchmark reviews.
Raven tracks keyword rankings, search engine results page (SERP) features, competitor visibility, and backlinks across devices and regions. Site audits flag crawl issues, indexing errors, and page speed concerns.
An SEO Health Score and trend charts show how technical updates influence rankings over time.
SEO performance appears alongside paid media and conversion metrics. You see how rankings connect to traffic and revenue without manual reconciliation.
Reporting, Automation, and AI Insight
TapReports turns warehouse data into dashboards, PDFs, and slide decks that refresh automatically. Report Studio edits layouts with live metrics, while Quick Reports handle fast client summaries.
Templates standardize layouts for large client portfolios. Custom metrics calculate once and apply everywhere.
AI Insights Agents scan dashboards and write concise summaries about ranking changes, traffic swings, and competitor movement.
SmartSlides exports presentation-ready decks. SmartEmail distributes scheduled updates without manual follow-up.
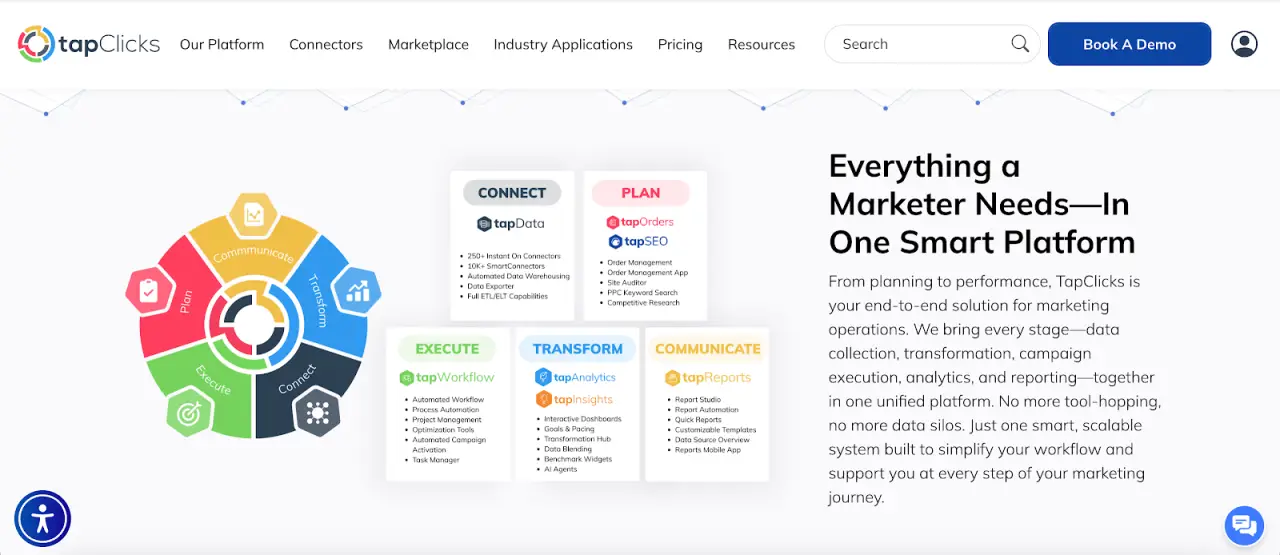
Campaign Intake to Performance Review
TapOrders records budgets, placements, and channel combinations at the moment of sale. TapWorkflow routes approvals, creative tasks, and fulfillment steps with timestamps and file history attached.
TapAnalytics and TapReports then connect those original campaign details to performance outcomes. Every report reflects both planning and results within the same system.
See the Full Story Behind Your Campaigns With TapClicks
Both AgencyAnalytics and Looker Studio deliver polished dashboards and useful reporting features. They help present performance, but they don’t connect the full marketing lifecycle.
Reporting answers what happened. It rarely shows how campaign setup, budget allocation, SEO updates, and execution decisions influenced the outcome.
Those pieces often sit in different systems, which makes it harder to trace results back to their origin.
TapClicks keeps everything in one place. Campaign intake, keyword tracking, competitor monitoring, budget data, analytics, and reporting operate inside the same platform.
You can see how:
-
A technical SEO fix influenced rankings
-
Ranking changes affected traffic levels
-
Traffic trends relate to conversions and revenue
AI Insights Agents summarize performance changes in plain language. Report Studio updates slide decks automatically when data changes.
Templates apply consistent metrics for large client portfolios, so reports remain uniform without repetitive layout edits.
FAQs About AgencyAnalytics vs Looker Studio
What is better than Looker Studio?
Looker Studio focuses on dashboards and visual reports. Platforms like TapClicks extend beyond visualization by consolidating data ingestion, SEO tracking, analytics, reporting, and workflow in one environment.
If you need one system to handle campaign intake through executive reporting, a unified marketing platform offers broader coverage.
What is the difference between Databox and AgencyAnalytics?
Databox emphasizes KPI dashboards and performance monitoring. AgencyAnalytics focuses more on recurring client reports with white-label branding and scheduled delivery.
Databox leans toward live metrics, while AgencyAnalytics prioritizes presentation and client-facing reporting cycles.
What is the difference between Looker Studio and Google Analytics?
Google Analytics collects and processes website and app data. Looker Studio displays that data in dashboards and visual reports. One gathers performance data; the other presents it in a visual format.
What are the disadvantages of Looker Studios?
Advanced reporting in Looker Studio requires technical knowledge, especially when blending data sources or writing calculated fields. Large datasets can slow report loading.
It also centers on visualization and lacks built-in client reporting workflows or operational campaign management tools.