12 Instagram Ads KPIs That Actually Matter in 2026 (and How to Report on Them Without the Manual Work)
Last updated: August 7, 2026
Why Instagram ads reporting needs to change in 2026
Instagram isn't the single-feed platform most reporting templates were built for. Reels captured more than half of Instagram's ad inventory in 2025, up from roughly 35% the year before, as Meta shifted inventory and Advantage+ automation toward short-form video (CNBC). Reels also now accounts for 46% of the time US users spend on the app, up from 37% a year earlier (Tubefilter). Meta's own Q4 2025 disclosures put full-year 2025 ad revenue at $196.18 billion, up 22% year over year, with ad impressions up 12% (Meta 10-K, SEC filing).
Practically, that means a report built around one Feed-vs-Stories split is already out of date. Reels, Feed, Stories, and Explore now behave like three or four different channels with different costs, different creative requirements, and different audience behavior — and your reporting needs to separate them.
The 12 Instagram ads KPIs worth reporting on
Every metric below answers a different question. Report all 12 broken out by placement (Feed, Stories, Reels, Explore) rather than blended, since blended averages routinely mask a placement that's quietly burning budget.
| # | Metric | What it tells you | 2026 benchmark range |
|---|---|---|---|
| 1 | CPM (cost per 1,000 impressions) | How expensive your audience/placement combo is to reach | ~$2–$6, varies heavily by industry (WebFX) |
| 2 | CPC (cost per click) | Efficiency of your creative + targeting at driving a click | Feed ~$3.35, Stories ~$1.83, Reels ~$1.28 — 26% below Facebook Feed (WebFX) |
| 3 | CTR (click-through rate) | Whether your creative and hook are actually stopping the scroll | Feed ~0.22%–0.88%; Stories ~0.33%–0.54% (WebFX) |
| 4 | Engagement rate (likes, comments, shares, saves ÷ reach) | Whether the ad resonates enough to act like organic content | Varies by format — saves and shares are the strongest signals for Reels distribution |
| 5 | Frequency | How many times the same user has seen the ad | Above ~3–4 in a short window is a fatigue warning sign |
| 6 | Video completion / hook rate (Reels, Stories) | Whether your first 3 seconds are working | Track 3-second views and completion rate together |
| 7 | Conversion rate | Percentage of clicks that complete your target action | Benchmark against your own historical baseline |
| 8 | Cost per result / CPA | What you're actually paying per lead, install, or sale | Set per-objective, not account-wide |
| 9 | ROAS (return on ad spend) | Revenue generated per dollar spent | Report both blended and placement-level ROAS |
| 10 | Reach vs. impressions ratio | Whether you're reaching new people or re-serving the same audience | A shrinking ratio over time signals audience saturation |
| 11 | Landing page conversion rate (post-click) | Whether the ad is doing its job even when the landing page isn't | Isolates creative performance from page performance |
| 12 | Share of ad inventory by placement | Where your budget is actually being spent | Compare against the ~50%+ Reels share trend |
How to structure an Instagram ads report clients actually read
A report that lists all 12 metrics in one flat table gets skimmed and ignored. A report that answers three questions in order gets read.
- What happened? Lead with 3–4 headline numbers (spend, ROAS, cost per result, and the metric that moved most) as big-number visualizations, not a table. This is the same principle behind TapClicks' guide to data visualization types — the visualization should match the question, not just display the data.
- Why did it happen? Break the headline numbers out by placement (Feed, Stories, Reels) and by campaign objective. This is where frequency, hook rate, and CTR earn their place — they explain the "why" behind a CPA change.
- What are we doing next? Close every report with 2–3 specific actions: which ad set to pause, which placement to shift budget toward, which creative to refresh. A report without a "next" section is a data dump, not a report — and it's a common driver of client churn. Poor reporting and communication are cited as a very-high-impact churn driver for smaller social media agencies, which see annual churn rates near 46% (industry benchmark data cited across agency reporting sources).
For more on structuring the report itself, TapClicks' social media report template walks through a layout built around this same what/why/next structure.
3 common mistakes in Instagram ads reporting
- Blending Reels, Feed, and Stories into one CTR or CPC number. Since Reels now carries the majority of ad inventory and runs at meaningfully lower CPC than Feed, a blended number can make a campaign look healthy while one placement quietly underperforms.
- Reporting frequency without a fatigue threshold. Frequency by itself is just a number. Pair it with CTR or engagement rate trend to show whether fatigue is actually suppressing performance.
- Manually pulling data every reporting cycle. Agencies typically run 5–12 active data sources per client, each with its own login and export format — a setup that eats hours per client per month and introduces the kind of date-range or KPI-definition errors that undermine trust in a report.
How TapClicks automates Instagram ads reporting
This is the part manual reporting can't solve: even a well-structured report is only as good as the hours it takes to assemble it. TapClicks' Instagram Professional connector and Facebook Ads connector pull placement-level performance — including Reels, Stories, and Feed — directly into a single dashboard alongside every other channel in the account, so a report doesn't need to be reassembled from five different exports each cycle.
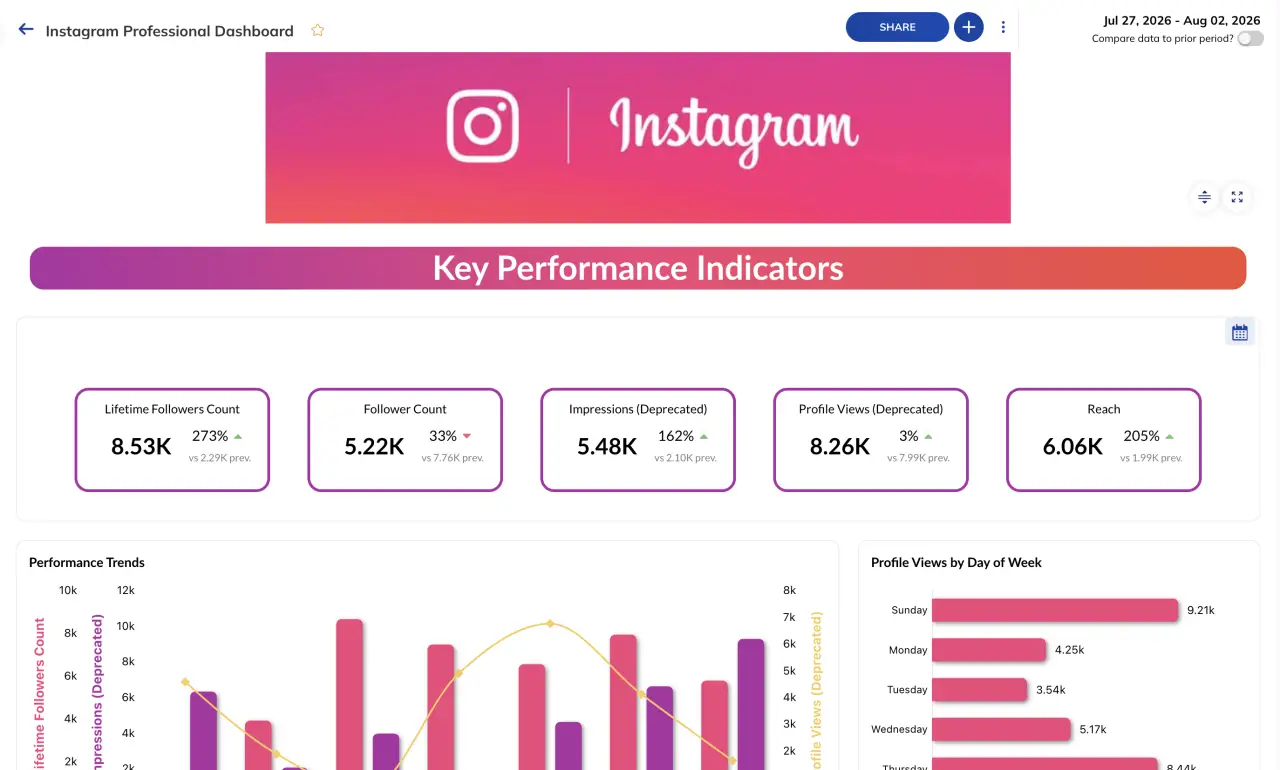
From there:
- SmartAnalytics applies AI-driven analysis on top of the raw connector data to flag anomalies like a sudden frequency spike or CPC jump automatically, instead of waiting for someone to notice it in a spreadsheet. It goes a step further than alerting, too — its built-in AI tools analyze the underlying data and surface plain-language insights and recommendations (for example, suggesting a budget shift toward Reels when placement-level ROAS diverges), so the account team spends less time interpreting charts and more time acting on them.
- SmartReports turns the connected data into a white-labeled, client-ready report using the visualization types (big numbers, combo charts, bubble charts for cost/conversions/clicks relationships) covered in TapClicks' data visualization guide, so the "what happened / why / what's next" structure above is built in rather than manually formatted.
- Because TapClicks connects 200+ platforms in addition to Instagram and Facebook, agencies reporting across Meta, Google, TikTok, and LinkedIn in the same account get one unified view instead of stitching together separate exports — the same problem addressed in TapClicks' roundup of marketing analytics tools.
For agencies specifically, TapClicks' guide to marketing agency reporting tools compares what to look for when the reporting has to scale across dozens of client accounts rather than one.
FAQ
What's a good CTR for Instagram ads in 2026?
Feed ads typically fall between 0.22% and 0.88% CTR, while Stories ads run narrower, around 0.33% to 0.54% (WebFX). Benchmark against your own account history first — industry ranges vary widely by vertical and objective.
Why is Reels CPC lower than Feed CPC?
Reels inventory has grown faster than advertiser demand for it, and Meta's algorithm favors the format given how much user time it captures — 46% of US time on Instagram in 2025 (Tubefilter). More available inventory relative to bidding pressure keeps Reels CPC below Feed.
How often should Instagram ads reports be delivered?
Weekly for active campaigns in optimization, monthly for steady-state accounts. Automated dashboards make weekly cadence realistic without adding manual hours, since the data refreshes without a new export each time.
Should Instagram and Facebook ads be reported together or separately?
Both — report them together for blended account-level spend and ROAS, and separately by platform and placement to catch performance differences Meta's combined delivery can hide.
What's the single most important Instagram ads metric to start with?
Cost per result (or CPA), because it ties every other metric — CTR, CPC, frequency, conversion rate — back to the number that actually matters to the budget holder.
Sources
- Meta Marketing Benchmarks for Facebook & Instagram in 2026 — WebFX
- Most of Instagram's ads ran on Reels in 2025, data shows — CNBC
- On Meta earnings call, Zuckerberg claims Reels "has an annual run rate of over $50 billion" — Tubefilter
- Meta Platforms, Inc. Form 10-K FY2025 — SEC
- Agency Reporting Automation: 11 Best Tools for 2026 — Improvado