
3 Features to Look for in a PPC Reporting Tool [In-Depth Analysis]
If you need to report on multiple PPC campaigns or your marketing agency has multiple clients with PPC campaigns, finding the right PPC reporting tool can be confusing.
We've been creating and providing marketing reporting tools for over a decade so we know that when you're considering which PPC reporting tool is right for you, asking the following 3 questions is key:
- Data Intake: Does it gather data for all your other marketing campaigns(e.g. SEO, radio, TV ads) plus your sales data (e.g. CRM, eCommerce sources) as well as your PPC data, so you can view all marketing data in one place (instead of having a stand-alone tool for only PPC reporting)?
- Calculations: Does it allow you to automate the process of calculating overall metrics to report to clients or executives from the granular campaign by campaign metrics that PPC platforms output (e.g. calculating total cost per conversion from 50 different campaigns)?
- Automatic PowerPoint or PDF Reports: Does it allow you to automate sending PowerPoint or PDF presentations to your clients every month with the latest data automatically updated in the slides so your team doesn't have to spend hours or days manually updating slide decks every month?
In this post, we'll walk you through the TapClicks solution in detail and explain how it does all of the above automatically and at scale. We'll also include some bonus features offered by TapClicks, too.
If you're a large or enterprise-level agency that would benefit from a PPC reporting tool that scales and automatically updates, you can try our free 14-day trial or schedule a demo.
Question #1: Does Your PPC Reporting ToolGather AllYour Marketing Data (Not Just PPC) and Your Sales Data Too?
Most PPC reporting tools connect to the main social media and search engine platforms so you can report on your PPC campaigns. However, these specific tools probably won't have the ability to pull data from all your other marketing sources, such as SEO, radio, or TV campaigns, and possibly some of the lesser-known PPC platforms, too.
So, if you or your clients are running many different marketing campaigns (as is commonly the case) you won't have the ability to extract, visualize, and report on all your marketing data together unless you do a whole load of time-consuming work extracting data from those platforms manually and individually every single month.
However good your PPC reporting tool is, it's massively inconvenient to have a PPC reporting tool that is siloed from the rest of your marketing activities.
It's Important to View Your Sales and PPC Datain One Place
Likewise, PPC reporting tools and some market-specific dashboard tools don't allow you to connect to your sales data (e.g. CRM or eCommerce sources) unless you import it manually yourself or use an add-on tool or integration to do that for you.
So, if you want to see how your PPC campaigns are impacting actual sales, that's going to involve a lot of work pulling in the data from all the different sources, doing manipulations, and number crunching in an Excel spreadsheet or maybe within Google Data Studio, and this would need to be done every week or month or whenever your reports are required.
In our experience, we know that many agencies spend tens to hundreds of hours doing this kind of work with account managers and teams dedicated to doing just this when they could better spend their time focusing on ROAS (return on ad spend) and fine-tuning PPC campaigns for their clients.
With TapClicks, You Can Connect to 250+ Data SourcesInstantly
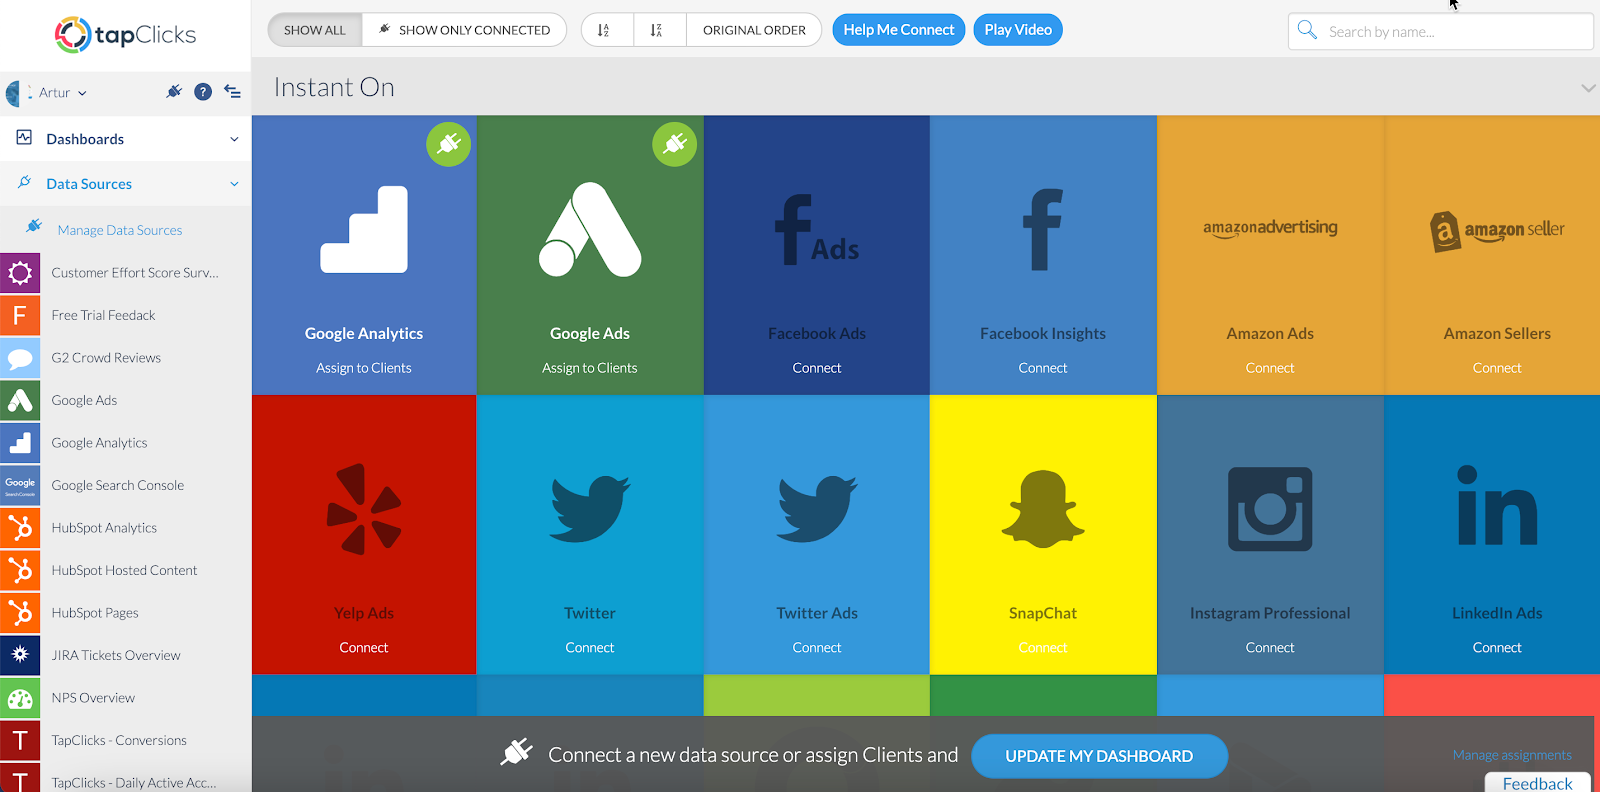
With TapClicks, none of this laborious work is needed because you can connect to every data source you can imagine. There are 250+ data sources that you can connect to and start pulling data from straightaway and in near-real-time (we call them instant-on connectors).
These include all the key PPC ad platforms you need for your PPC campaigns, as well as multiple other marketing sources and sales and eCommerce sources, such as:
- Facebook Ads
- Snapchat
- Google Ads
- Bing Ads
- Shopify
- Amazon Sellers
- Salesforce
- And hundreds more.
The TapClicks Team Can Build Connections to Almost Any Other Data SourceYou Might Have
In addition to our instant-on connectors, TapClicks can pull data from just about any source you can think of, including the more obscure platforms (e.g. Genius Monkey and StackAdapt) as well as local or proprietary ones (e.g. your own database) via what we call our smart connectors.
This means that you can gather PPC data, marketing data, and sales data from every single source you need it from, including a file via email, and have it all in one place.
Here's a short video demo on how to set up a smart connector.
TapClicks Saves You Time and Resources by Managing All Your API Connectors for You
Aside from being able to connect to every data source you need (in addition to your PPC data sources), TapClicks saves you a significant amount of time by managing those connections for you.
So, if there's an unexpected update or a connection break in a particular API, rest assured that the TapClicks team will be on top of it because they already have relationships with these companies, meaning you don't need to even think about it.
Question #2: Does Your PPC Reporting ToolAllow You to Automatically Aggregate MetricsSo You Can Provide High-Level Summaries for Your Clients?
A common time suck in marketing reporting, especially PPC reporting, is analyzing the detailed data from each campaign and doing calculations to create meaningful aggregate summaries for your clients.
For example, reporting on total impressions, total CTR (click-through rate), or total engagement from dozens or hundreds of campaigns.
Viewing each metric at the single campaign level is too granular for your clients, especially if you have dozens or hundreds of different PPC campaigns. They want to know what the headlines are, not all the individual CTRs for 20 (or 100) different campaigns.
Usually, doing these calculations is a repetitive process that agency employees have to do manually, but with TapClicks, once you've connected to all your PPC data sources and any other data sources you need, you can create formulas that define data sets one time and then every month the calculation will be done automatically from the metric you created.
Being able to define and configure data exactly as you want means that it transposes into visualizations that summarize the key headlines and stories for your clients.
Here's how it works.
How to Define Specific PPC Terms with TapClicks
Say you have a client with 100 PPC campaigns on various platforms which run across different segments, for example, product lines as well as locations. To report on aggregate performance metrics (e.g. total impressions, total CTR or total engagement) without a tool such as TapClicks would involve a lot of tedious work.
Once you've pulled the data from the various disparate sources, as described above, you would need to work out what you want to include in your aggregate terms, manually number crunch (usually in a spreadsheet), and create formulas to view that data by different groupings (e.g. a specific region or product collection). This becomes even more complicated because different platforms use similar terms to describe the same thing (e.g. impression, imp, hit, or view).
With TapClicks, the process is simple. Firstly, all the metrics are already in one place because you're pulling all the data you need into the TapClicks platform.
Secondly, you simply define a new metric (e.g. Total Engagement) and click on each metric you want to include in your new aggregate term and you're done.
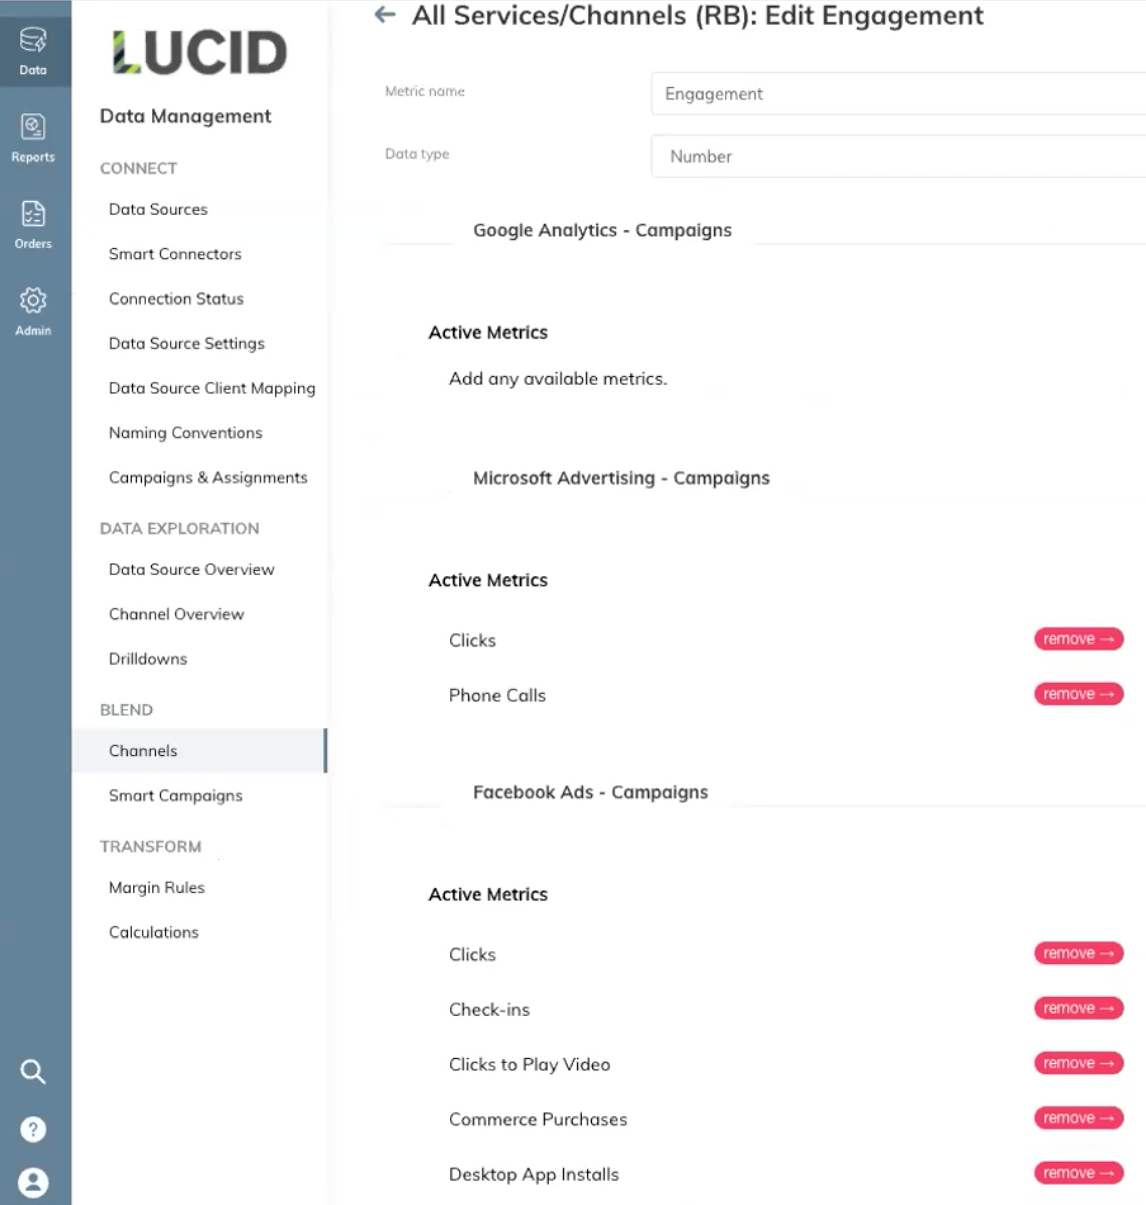

This new total engagement metric is now forever available for all dashboards and reports you want to create. You can use it to summarize PPC campaign performance for particular product lines or in specific locations or groups of products or locations. The metric is saved for you to use on whatever data groups you select for as long as you want to use it.
You'll never again have to go into all your PPC ad platforms individually and add up all the different engagement metrics into a total again.
And when you want to create a new dashboard or report, or you have a new PPC client, the total engagement metric you created is ready for you to use. And if you want to adjust it for one particular campaign or client, you can do that, too.
Easily Make Edits to Dozens (or Hundreds) of PPC Dashboards at Once with Templates
Most PPC reporting tools have some kind of visualization or dashboard feature. The benefit of TapClicks is how easy it is to update many dashboards at once.
If you're using a free PPC template or tool like Google Data Studio, you're likely managing dozens or even hundreds of stand-alone dashboards. So, if your agency decides that it wants to define a term such as total engagement slightly differently, for example, by incorporating a new term within it, you would need to go into each of your dozens (or hundreds) of dashboards one-by-one and make that change manually.
With TapClicks, you don't have to do that. You would make the change only once. This is because by default, every element of a dashboard (which we call a widget) and, in fact, the whole dashboard, acts as a template. This allows you to replicate all widgets and dashboards across several or many PPC campaigns and clients. We built TapClicks this way so that it can be flexible and scalable.
Note: As with our total engagement definition above, you can also choose to solely apply custom elements to individual dashboards.
To create a new dashboard in TapClicks, most users opt for our readymade templates as a starting point. We have pre-built templates for all the major PPC platforms including Facebook Ads, Google Adwords, etc.
These can be customized as much or as little as you wish by selecting or deselecting whichever metrics (widgets) you want. All templates are white label so you can add your agency or client branding.
You can read more about PPC dashboards in this post.
Facebook AdsDashboard

Google AdsDashboard

Here is a video showing how to set up a dashboard in TapClicks.
TapClicks Bonus Feature: Automatically See Ad Creative Next to Ad Stats
In addition to viewing all the metrics for your PPC campaigns, TapClicks has introduced a useful feature so that you can also view your ad creative alongside the data it relates to.
For example, if you've run a Facebook ad campaign, you can view all the metrics for that campaign depending on what widgets(different metrics) you've set up, and you can see the visual for the actual ad right next to those metrics(see below).

TapClicks Bonus Feature: Goals versus Pacing
Most agencies want to be able to track PPC campaign performance against goals so that
strategy can be adjusted if needed.
For example, they don't just want a report on the number of clicks in a campaign this month but may want to see how a campaign is doing relative to previous months and relative to the intended goal in one graph.
Most PPC reporting software tools do not allow you to do this, unlike TapClicks which has a convenient Goals versus Pacing' feature.

Question #3: Does Your PPC Tool Allow You to Automate Sending PowerPoint Reports to Your Clients with Automatically Updated Numbers and Graphs?
Regardless of the live dashboard feature offered by most PPC reporting software (including TapClicks), we find that clients also want to receive reports in a specific format (e.g. PowerPoint or PDF) via email at a set time each week, month, or whenever the reporting period falls.
If you're using a standard PPC reporting tool, you will need to build your monthly PPC reports yourself. Most agencies use some kind of standardized reporting template for, say, PowerPoint slides (here's our free PPC reporting template), but even with that, you'll need to spend hours each month updating the numbers and graphs on each slide manually.
And you'll need to do this for every PPC campaign and/or client and produce reports for different audiences individually in whatever format they want and then send them to stakeholders when they want them.
Most agencies think there is no way around manually updating this month's numbers and graphs in a monthly PowerPoint or PDF report, but there is. This is why we designed ReportStudio, which combines all the advantages of a live dashboard tool with the power of a flexible and scalable report builder.
TapClicks ReportStudio Auto-Updates Your Reports Just Like a Live Dashboard
With ReportStudio, you can create presentation report templates for your clients with whatever plots and graphs you want and set the report to be emailed out to whatever schedule you wish. And when the report is sent out, all the numbers and graphs will automatically update with the most current data.
It's the equivalent of having a PowerPoint presentation builder that's connected to all your live PPC data and any other data you want to include (e.g. other marketing campaigns and sales data).
Because you've already defined your PPC metrics within your dashboards (and you can view these via your live dashboards whenever you want), these will be pulled across automatically into ReportStudio so you don't need to repeat the set-up you've already done.
The beauty of ReportStudio, as with so many other features of TapClicks, is that you can set up and create client reports on all your PPC campaigns until you decide to change it.

You can customize your PPC performance reports with our white label templates and set permissions so that each audience sees the information that's relevant to them when you want them to see it. You can set up reports to run monthly, weekly, etc. whichever works best for you.
Once you set up when you want the report to go out, how often, which report you want to be sent, and who you want it to be sent to, the report will be sent via email or PDF (whatever you've requested) to the people you've set it up to go to.

Here is a short video on how to schedule reports with TapClicks.
Whichever format you've chosen, either a live dashboard or a scheduled email report, the benefit is that your PPC data is automatically pulled into whatever format you have configured so that stakeholders and clients receive white label reporting for their PPC campaigns.
Learn more about TapClicks ReportStudio in this video.
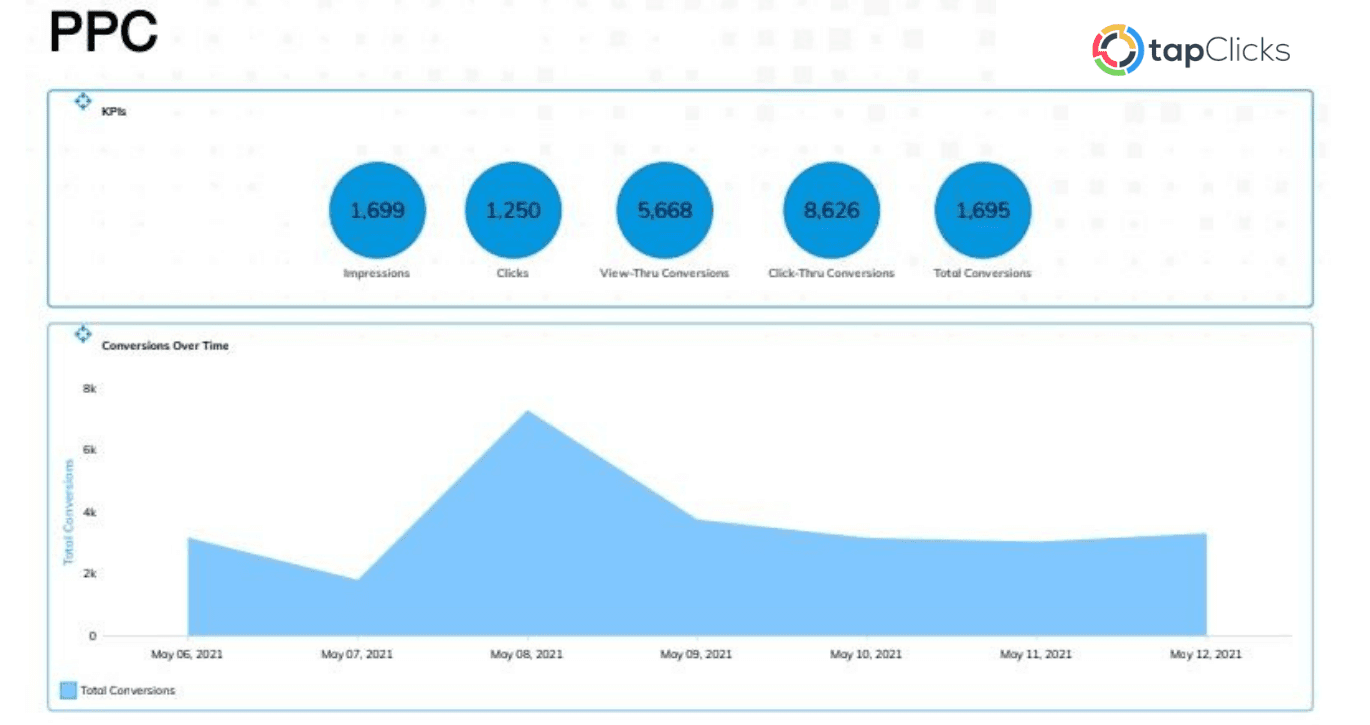
Examples of PPC Reports in ReportStudio
The slide below shows the KPIs versus the conversion rate over a week for a PPC campaign.
If you wanted, you could look at the data across different timescales and you could also add in data from other campaigns (and also your sales data) to see campaigns side by side.
The slide below shows a high-level view of the performance of a PPC campaign across 10 months.
You can include as many metrics as you wish and show them as snapshots (as they are here) or as a graph or line chart.
This helps you and your clients get an overview of your PPC marketing campaigns and make strategic decisions on what is and isn't working.

TapClicks Bonus Feature:Set up PPC Alerts
TapClicks has a useful alert function where you select the client or campaign and timeframe and then whatever PPC metric you want it to alert you about.
In the example below, a Facebook Ads alert has been set for whenever a CPC(cost per click) is greater than $5.50. This means you can make adjustments to PPC campaigns quickly if you need to. You can set up as many alerts as you like as there is no limit on the number of alerts you can have.

Want to Try TapClicks PPC Reporting Tool?
We've explained in detail the 3 most important features you need when searching for the right PPC reporting tool for you.
Our experience tells us that if you have hundreds or even just a dozen PPC campaigns or clients, you need a solution that pulls data from all your PPC campaign platforms as well as your other marketing and sales sources. Your PPC reporting software should also allow you to automatically aggregate metrics so you can provide high-level summaries for your clients and it should allow you to send beautiful PowerPoint reports which are created from your live data automatically and whenever you want.
Having a PPC reporting tool such as TapClicks that does all this easily and automatically will save you a massive amount of time which can be better spent considering your ROAS (return on ad spend) and fine-tuning your PPC campaigns for your clients.
Are you ready to upgrade your PPC reporting processes to spend more time on the work that matters most? Try our free 14-day trial.