
How to Improve Your PPC Reporting Process (With Free PPC Report Template)
To help you quickly create reports and present your data in a way that is visually engaging we put together a free, downloadable PPC report template.
But even the best PPC report template comes with significant limits, such as a lack of automation and limited data analysis. Not to mention, when creating a PPC report, you need to:
- Get all relevant marketing data out of your advertising platforms and into your marketing report
- Create data visualizations that help you illustrate your PPC performance to your audience
- Send the report to the right people in the right format, whether that's PDF, CSV, or PPT file
These tasks are time-consuming and recurring you'll always need a marketer to handle them if you're using manual reporting processes, and as your client list (or the number of campaigns you're running) grows, the more time your team will spend on reporting, and less on more revenue-driving tasks, such as developing new PPC campaign strategies.
To help improve those key areas (and more), marketing teams can use TapClicks to pull all relevant data into one dashboard so they can easily create PPC reports, schedule recurring reports, and tell a more complete story with their data.
In this post, we cover:
- How to Use Our Free PPC Report Template
- The Challenges That Come with Relying on Manually Reporting PPC Metrics
- How Marketing Teams Can Use TapClicks to Automate Their PPC Reporting
If you've already experienced the time-consuming headache of managing manual PPC reports and want a more efficient (and scalable) process, try our free 14-day trial.
How to Use Our Free PPC Report Template

Our free PPC report template is available here as a Google Presentation.
When you open the PPC report template, it will be in View Only mode. Simply click File > Make a Copy to get your own editable slide deck.
In your copy, you can put in your PPC data and create a report for your client or stakeholder.
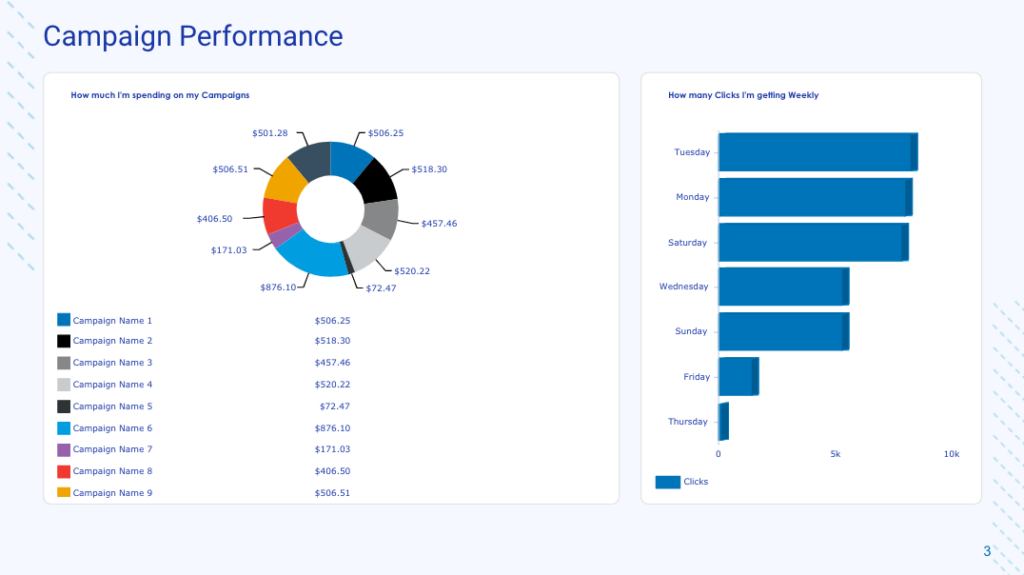
For example, if you're reporting on ad spend over multiple campaigns then in slide three you can list the campaigns and report the ad spend.
With this free PPC reporting template, you get:
- A customizable slide deck that can be downloaded as a PPT or PDF.
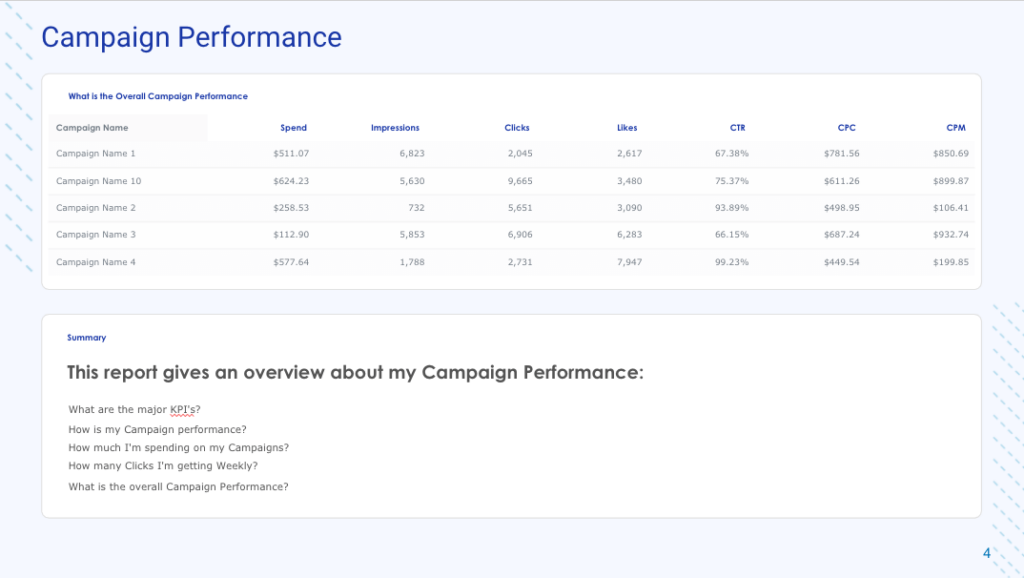
- Nine different slides to help you organize important metrics for campaign performance, engagement, and creative performance. (Plus, you can duplicate specific slides if you need more.)
- Places where you can use text descriptions to summarize PPC performance.
But while using a free PPC report template is a good first step to reporting on ad campaigns, it isn't a sufficient reporting method for marketing teams who want to save on labor and scale their processes.
The Limitations of PPC Report Templates: Report Generation and Management
When you manually create PPC reports (whether in a Google spreadsheet, powerpoint, or Google Data Studio template), you're laying the groundwork for costly bottlenecks.
Manually creating PPC reports requires constant hands-on management which means your marketing team will have less time to analyze PPC data and develop new marketing strategies and campaigns. As such, marketing specialists commonly become nearly full-time reporting managers.
Specifically, your marketing team will have their hands full with these burdensome tasks:
- Customizing the PPC template for every new client or campaign.
- Consolidating several disparate data sources into one template. This is often incredibly time consuming and complicated such that plenty of marketing teams just opt to use several templates (one for each platform), and then create a one-sheet overview of their PPC efforts. Then they're managing dozens of report templates for just one client.
- Managing recurring reports and inefficiently creating ad hoc reports.
These tasks not only prevent growth and scalability, but they also cut into your organization's profits.
Below, we look at how our TapClicks all-in-one marketing dashboard is used by pay-per-click marketers to solve these issues.
How TapClicks Streamlines Your PPC Reporting Process
To improve your PPC reporting process, it's critical that your marketing team has access to:
- All relevant data sets
- Customizable reporting templates
- Automated reporting and KPI alerts
TapClicks Helps to Easily Connect Disparate Data Sources
If you're running omnichannel marketing strategies (which most PPC teams are), then you're dealing with several different platforms, from social media channels such as Facebook Ads and LinkedIn Ads to search engine channels like Bing Ads and Google Adwords.
To get all of that data into one PPC report, you need to manually login to each platform, export the relevant data out into a spreadsheet, and then take that data and put it into your PPC template, using screenshots or creating widgets.
But with TapClicks, you get live API connections to over 250+ different data sources.
A TapClicks Bonus: We give marketing teams substantial historical data. For example, if you set up a TapClicks account today and connect Facebook Ads to your dashboard, you don't have to wait to start seeing data. We pull up to a year of data on the same day. With this valuable historical data, you can begin seeing previous campaign performance immediately.
With all of your relevant data in the same dashboard, you can blend and transform data to get more insightful analysis. For example, you can blend your Google Ads data and your Facebook Ads data together to evaluate overall CPC (cost per click) or pinpoint which ads are increasing your ROAS.
More than a PPC Template: TapClicks Uses Your Data to Tell the Full Story
TapClicks also gives you the advanced functionality to connect other platforms such as CRM platforms, SEO and SEM platforms, and eCommerce platforms to your reporting template. These may be services you need right now, or services you'll benefit from in the future as you grow.
Instead of viewing your PPC metrics as separate from sales, you can view both datasets side by side within the same dashboard.

But the benefit to you is your ads report can now also be used to show ROI for your client, not just in terms of ad spend versus ad revenue.
For example, in the image below, you can see how formulas and value can be broken down in your reports.
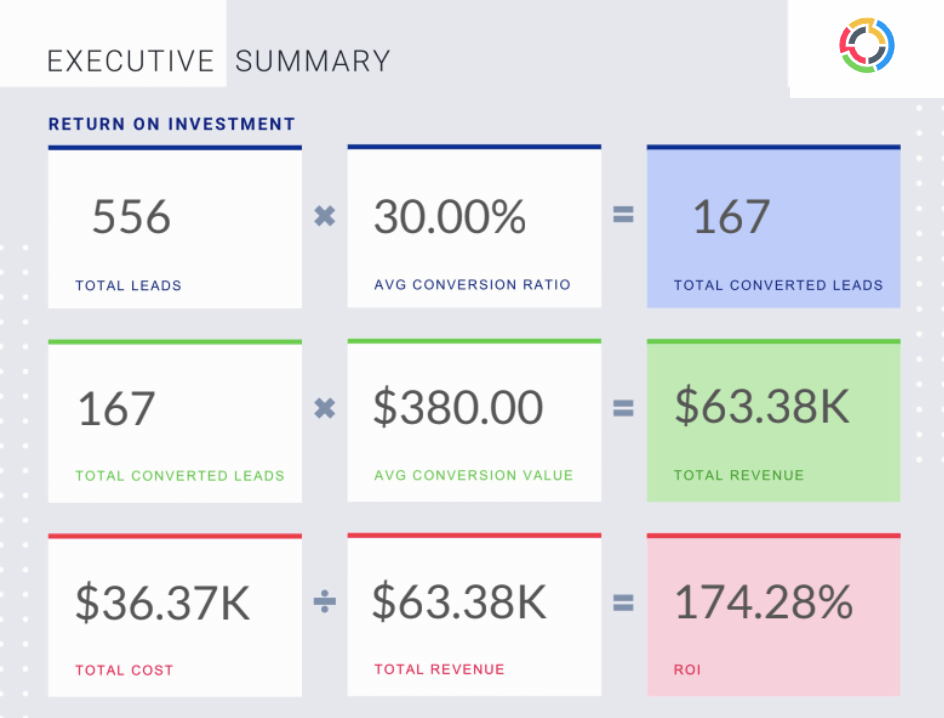
In this example, your marketing strategy brought in over 556 leads which, with a 30% conversion rate, equals 167 converted leads.
With the average conversion value of $380, that means your campaigns brought in $63.38K in revenue. When you minus the cost of your services, your client is still receiving an ROI of $174.28%.
That's the kind of storytelling that increases client retention and helps you upsell your existing clients on new services.
TapClicks Provides a Customizable Master Template

With TapClicks, you save time because you don't need to change every PPC report when you want to make a change.
Let's say you normally send your client a weekly report on ad spend, impressions, and CTRs across all channels something that's easy to do because all of your data sets are pulled into your TapClicks dashboard.
But after your weekly client call, both parties decided to make Facebook Ads a bigger focus, and to stop running paid advertising campaigns on Google Display Network.
Similarly, different stakeholders want different reports. Your head of marketing may want different key metrics than the founder. With TapClicks, you can create different reports for different recipients by simply clicking which data sets you want to include.
How TapClicks Adapts to Changing Metrics
PPC managers used to focus their reporting on measuring click-through rates (CTR), however, the value of knowing your CTR diminished overtime as advertising platforms grew more sophisticated.
Now, our most cutting edge customers are actively trying to quantify their client's share of voice. That is, the reach their brand has within their specific industry.
To do that, PPC managers are now more interested in knowing the number of impressions their campaigns get, rather than just the CTR.
If you're using a PPC reporting template for all of your clients, you need to go in and manually add the new metric share of voice, which is made up of other metrics grouped together.
But with TapClicks, you're getting live API connections that are managed by our team. As the PPC landscape changes, we go in and update our connectors, keeping the data sets that are most relevant to your marketing a click away.
TapClicks Lets You Leverage Automated Reporting and KPI Alerts
When you onboard a new client with TapClicks or develop a new campaign you can set up recurring reporting. Just indicate when you want a report sent out, whichmetrics you want included, who you want to get the report, and how it should be delivered (PDF, PPT, etc.).
You can also create multiple recurring reports, in case you need different data in your monthly report than you do your weekly report.
In addition, you can set alerts for when KPIs reach a specific percentage. So if you're watching one campaign and your client is focused on the Return on Ad Spend (ROAS), you can set a benchmark to get a notification if the ROAS drops below a certain percentage.
Now, your marketing team can work on addressing the issue, instead of spending their time trying to find the issue.
Final Thoughts: Optimizing Reporting with Our PPC Report Template
Our free PPC report template is a good first step for digital marketing teams looking to improve their reporting processes. It gives you a template and storytelling flow to follow when organizing your data for reporting.
But there's still plenty of room for improvement if you're relying on manual PPC reporting, because manual reporting processes are time-consuming, expensive, and difficult to scale.
When you use TapClicks as your PPC reporting tool, you get:
- All relevant data sources funneled into one dashboard for a more accurate view of your marketing efforts
- A customizable master template that lets you make changes across all clients at the same time
- Automated reporting and KPI notifications to help free up how much time your marketers need to spend looking at reports
Are you ready to level up your PPC reporting processes to spend more time on the work that matters most? Try our free 14-day trial.