
5 Essential Features Your Marketing Reporting Software Should Have (with 7 Competitors to Consider)

There are plenty of solutions available that analyze marketing data and build reports. But knowing what specific features to look for and finding the right tool can be a challenge.
For example, if you're an enterprise-level agency, it's important that your marketing reporting software is scalable and helps automate repetitive processes, otherwise your team will spend an unsustainable amount of time on reporting.
This article is meant to help marketing teams answer those questions.
We'll discuss the most common types of reporting tools and explain how to choose the right one for you. We'll give an in-depth explanation of how our tool, TapClicks, has the 5 essential features that will help a growing marketing team or agency, and then list 7 alternative tools.
Advanced Features of Marketing Reporting Software (That Are Not Included In Most Solutions)
Most standard marketing reporting software tools will feature integrations with popular digital marketing platforms such as Google Analytics, Facebook Ads, LinkedIn, etc. And they will usually have the ability to set up live dashboards and schedule reports.
But those aren't the only useful features to look for when choosing marketing reporting software. Specifically, tools that just have some basic dashboard and reporting functionality often lack the functions to:
- Pull data from all marketing data sources including the more traditional ones such as radio, TV and ad management platforms. Without this, the reporting tool isn't that useful for brands or agencies that spend a decent portion of their budget on radio, TV, and paid media outside of Google and Facebook.
- Create a permanent store of all your data. Storing your data all in one tool and producing reports directly from there means you don't have to download data from channels separately or manually.
- Automate repetitive calculations that can be used over and over for any campaign, client, dashboard or report. For example, create a formula to calculate ROAS (return on ad spend) and be able to have dashboards and PowerPoint reports automatically populate ROAS for the latest month or week of data without employees having to manually calculate it every month for every campaign or client.
- Set up dashboard templates that can be used across as many clients as you wish so that you only have to make changes once and they will be applied to all dashboards.
- Produce PowerPoint-style reports that are automatically populated with your most up-to-date data and can be sent to your clients on a recurring schedule.
Common Marketing Reporting Solutions
Before we discuss our own solution and list 7 alternative tools, let's consider the 3 typical methods that agencies and marketing teams use to create reports on their marketing performance.
Note: One or more method may be used.
1. Manually Creating Reports
Many smaller agencies and marketing teams create custom reports manually and don't use any marketing reporting tools at all. Or, they use tools (like #2 and #3, below) for some of the work and then do the rest themselves.
Doing client reporting manually involves downloading a lot of disparate data. You have to go into each marketing platform and pull your data into a spreadsheet or an application such as Google Sheets. A great deal of time is spent juggling spreadsheets and data sets, organizing and standardizing the data (e.g. deleting empty columns and making dates uniform) and doing calculations like working out your ROAS manually.
Doing this amount of work for each campaign (e.g. PPC, SEO, Google Ads, etc.) and client takes marketing teams dozens or hundreds of hours each month. And it has to all be done again the next month and every month thereafter time that could be better spent working on marketing campaigns and fine-tuning marketing strategy.
2. Dashboard Reporting Tools
Dashboard reporting tools (e.g. DashThis) are designed to pull in data and visualize it in a reporting dashboard as a snapshot-in-time. They are usually fairly easy to use with drag-and-drop functions but they are limited in how many features they offer and data calculations they can do.
Most dashboard reporting tools don't store your data for you they only create dashboards and reports for data you currently have access to. So, if you lose a client, you will no longer have access to that data unless you store it separately in a data warehouse.
Marketing teams that need more flexibility and scalability frequently turn to more general purpose BI (business intelligence) tools. We'll discuss these next.
3. Business Intelligence Tools
BI tools (such as Tableau) provide sophisticated analytics and visualizations on disparate sets of business data. They are usually complex to use and do not have the ability to connect with every marketing and sales data source. For these, you would have to download the data manually (#1) or use another tool (such as an ETL Extract, Transform, Load tool) to do that for you.
Because many BI tools are not typically marketer-friendly, they require dedicated IT support to access the data and create analytics for you. This causes delays in getting your reports produced and rules out any last-minute requests for ad hoc reports.
Dashboard and BI tools vary in features and how much automation they offer. We'll look at some tools in categories #2 and #3 later in this article.
Our marketing reporting software, TapClicks, fulfills all 5 of the essential features we described above and is designed for agencies and marketing teams that need flexibility and scalability. Specifically, with TapClicks, you can:
- Pull data from all marketing data sources.
- Create a permanent store of all your data.
- Automate repetitive calculations that can be used over and over for any campaign, client, dashboard or report.
- Set up dashboard templates that can be used across as many clients as you wish.
- Produce PowerPoint-style reports that are automatically populated with your most up-to-date data.
We'll explain exactly how it does this next.
If you're interested in how TapClicks could be a marketing reporting software solution for your organization, you can try it free for 14-days or schedule a demo to learn more.
TapClicks: The Marketing Reporting Software That Automates and Scales
Feature #1: TapClicks Pulls Data from Every Data Source
While many marketing reporting tools may be able to pull data from the common marketing platforms (e.g. Google Data Studio, Twitter, Facebook, etc.), the number of integrations are usually limited. They typically don't integrate with some of the more traditional mediums such as radio and TV or the more complex demand-side platforms commonly used by enterprise-level agencies and marketing teams who operate at scale.
So, for marketing teams who run campaigns via these platforms, these tools are restrictive as data from those platforms will need to be downloaded manually or by using another tool (e.g. an ETL tool) to do the work. Even if you use a marketing reporting tool that creates reports for you, having to do part of the work manually or with a separate tool wastes unnecessary time.
With TapClicks, you can pull data from thousands of data sources. We have over 250 pre-built direct integrations with marketing platforms such as Google Ads, Facebook and Wide Orbit (for broadcast ads) as well as ecommerce platforms, CRMs (e.g. Salesforce) and databases such as Microsoft Azure and Snowflake.

We also have direct connections to many lesser-known platforms (e.g. Genius Monkey, Tiger Pistol and Verve).

If there is any platform that we don't have a direct connection with, we can set one up using our Smart Connector tool.
We have connected to over 6,000 unique data sources using this tool including home-built databases and offline data sources, too.

In many cases, we can download 12 months of historical data, so this can automatically be incorporated into your analysis and reports to give a wider reflection of your marketing efforts.
Once you've connected to the data sources you want, your data will be pulled automatically daily or whenever you want to refresh it.
Another advantage of using TapClicks is that we manage the APIs for you. So if there's a break in connection, you don't have to ask your data team to fix it for you because the TapClicks team will take care of it.
Here's a short video on how to create a Smart Connector in TapClicks:
Feature #2: Create a Permanent Store of All Your Data
Most marketing reporting tools create digital marketing reports as a snapshot-in-time from real-time data or time-restricted data and they don't actually store your data. For that, you'd need to use a separate database or data warehouse that typically requires coding expertise to access.
Say you are a brand that sells via Amazon, many Amazon Ads reports are limited to only 60 days of data. If you don't extract that data and store it somewhere (e.g. in a data warehouse) it will not be accessible to use for year-on-year comparisons or growth analyses, for example. And, even if you do store it in a data warehouse, it's likely that you will need to ask your data team to access it for you (as coding skills will be required).
TapClicks stores all your data in your own fully managed data warehouse, accessible to marketers. Having your data all in one place helps save time as you can do everything you need within the TapClicks platform, including creating marketing analytics, sending out reports, and pushing data out to other locations.

The beauty of using TapClicks is that your data is stored in your data warehouse forever and can be accessed easily by marketers with no coding experience and no need to request help from an IT expert or data team.
You can read more about TapClicks marketing data warehouse in this article.
Feature #3: Automate Complex Calculations That Can Be Used for Any Campaign, Client, Dashboard, or Report
Marketers spend a great deal of time crunching raw data from their campaigns in spreadsheets and creating reports from manual calculations.
Some of the common metrics clients request may include:
- Performance across different campaigns and platforms to assess which are working best (e.g. Instagram Ads vs. LinkedIn Ads vs. Pinterest Ads vs. Radio).
- Average comments, likes, or shares on dozens of social media platforms.
- Total cost metrics, for example, customer acquisition cost, cost per engagement, or cost per conversion across all marketing campaigns.
- Total visits, impressions, clicks, and conversion rates on the website from search engine marketing, email marketing, PPC, Ads, and other marketing campaigns.
Doing these calculations and creating reports from them takes hours of work which needs to be done every month for every campaign and client. Most marketing reporting software can help with some aspects (marketing dashboard software tends to be limited and BI tools are too complex) but TapClicks can help with it all.
With TapClicks, you can do any calculations you want via an interface that anyone can use and, once you've set it up, it will automatically be applied to whichever campaign, client, dashboard, or report you wish.
Here are a couple of examples:
Customize and Combine Metrics
Marketers often deal with metrics from different marketing platforms that have unique names but the same meaning. For example, a social media agency may track follows on Twitter or Facebook and subscribes on YouTube simply as engagement and want to report that to clients.
Reporting on a Total Engagement metric like that is tedious every month, likes and follows have to be added up by the team and tracked in a spreadsheet.
But with TapClicks, you can define an umbrella term once and it will remain available and updated with the latest data for all future reports you want to create.
For example, you could create a new term inside TapClicks called Total Social Engagement and define it as the sum of post-reactions on Facebook, views on YouTube, or click-throughs on LinkedIn (see below).


Once that custom metric is defined, it will be available in TapClicks forever, with updated data, so you never have to manually add those engagement metrics yourself again to report on it. In any dashboard or report you build in the future, you can just drop in the metric Total Social Engagement (or a graph of this metric over time) and TapClicks will automatically calculate it based on how you defined it and have the number or graph ready for you.
This saves a huge amount of time.
Set Up Repetitive Calculations
In addition to defining custom metrics, you can also automate more complex data calculations in TapClicks.
For example, if your client is a tire manufacturer and you want to view their data by brand, but you have multiple ad campaigns running for each brand, it's challenging to set up different data streams to give you the information you need. With TapClicks, you can set up advanced calculations that find the specific brand names within campaigns and aggregate stats across all of these campaigns into single metrics for that specific brand.
In our example below, we can see that there are 266 Facebook Ad campaigns, all pulling in data from our data sources.
We've decided to name a certain segment of those campaigns HNP Campaigns' (see arrow on the right-hand side).

This means we can now pull data for just those HNP campaigns into any report or dashboard we want to create.
In this example, there are 191 of them and it pulls the data for all of those campaigns into one line (see arrow on the right-hand side).

You can use this function to group and view data by all types of location or by any segment you like product, campaign type, or group, and zoom in and out as you need to.
You can also calculate the overall click-through rate by adding up clicks across many campaigns and dividing by total impressions. You could calculate cost per click for campaigns across a region or specific product lines by adding up total spend and dividing by total clicks. The possibilities are endless and are beyond the remit of most marketing software tools.
As with everything in the TapClicks platform, you only have to set up these calculations once. From there, they can then be dropped into any dashboard or report and the values will be updated automatically.
Feature #4: Customize Dashboards to Use Across Hundreds of Clients
Marketing reporting software tools allow you to visualize your marketing data via graphs, visualizations, and dashboards, so you can measure your marketing campaigns' performance against your KPIs and report on that to clients and stakeholders.
However, the downside of most marketing reporting software tools is the restriction of how many dashboards you are permitted and also the inability to make changes that apply across more than one dashboard. Both of these issues inhibit the ability for a marketing agency to scale.
For example, if you wanted to add a new metric or graph to your Facebook Ads campaigns and you have a hundred clients you run Facebook campaigns for, you would need to go into each client's Facebook Ads dashboard and apply that change manually and individually. With TapClicks, you would only need to do this once because each element in every dashboard is a template.
Customizing Dashboards
Using the above example, you would simply add the metric to the TapClicks platform and then select that filter so it would be automatically applied across all your Facebook Ads dashboards for all your clients and they would be updated. And if you didn't want to include it for a particular client, you could deselect the filter for that client. This saves hours of time.
The TapClicks built-in dashboard feature is fully customizable and easily scalable. You can use our templates as a starting point and customize everything to suit you. You can customize multiple dashboards right down to the specific metric (we call these widgets) of each chart or table and use these as templates.

You can use single widgets, metrics, or dashboards as templates and when updates are made, they will be reflected across all the relevant elements.
Unlike some other marketing reporting software tools, there are no limits on how many clients or campaigns you can manage with TapClicks. These can be managed all from one place and you can also group several accounts and view them under one client.
Grant Access to Stakeholders and Clients
To save you from constantly having to distribute reports, you can grant permission to stakeholders to view their dashboards whenever they want.
Plus, you can control who sees what. You can set the permissions at widget level, so for example, if you didn't want a client seeing your mark-up costs, you could filter this out of their report.
While some stakeholders or clients are happy to check their data at a time that suits them, it is our experience that most prefer to receive their reports at specific times via email, as we'll discuss below, in Feature #5.
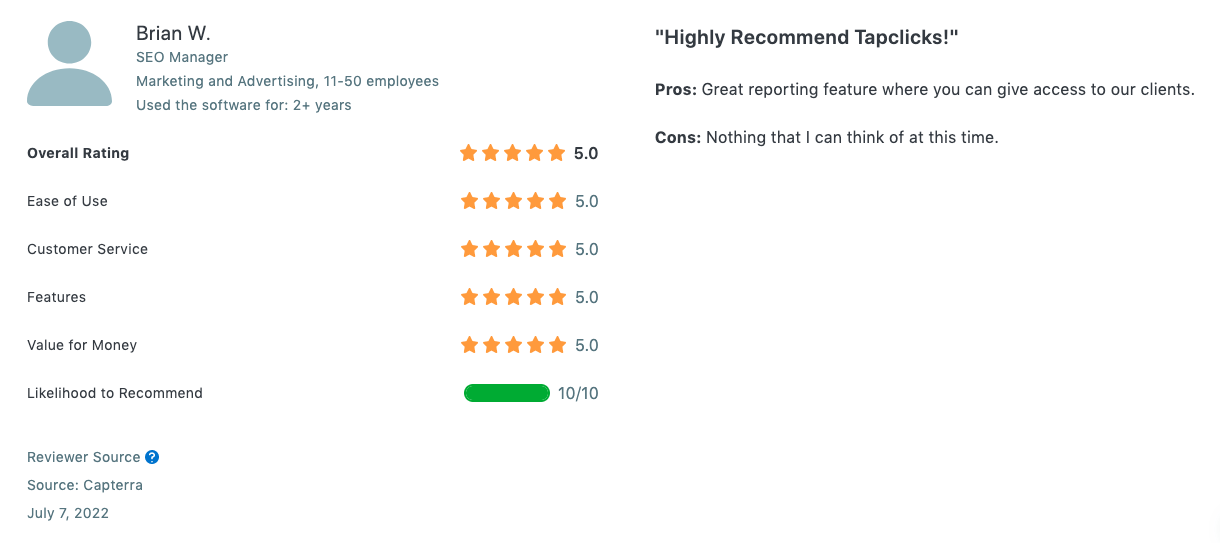
This Capterra review sums up a TapClicks' customer's view of the permissions feature:
Here's a short video showing how to create a dashboard in TapClicks:
Feature #5: Automatically Populate PowerPoint-Style Reports with Your Latest Data
Some marketing teams or agencies create reports manually by taking screenshots of the visuals from their analytics dashboards and pasting those into their marketing reports, one by one. As with the other manual tasks we've mentioned in this article, this would need to be done every month (or more) for every campaign and client. It's hugely inefficient and a massive drain on time and resources.
TapClicks ReportStudio saves marketers a huge amount of time by automatically populating PowerPoint-style reports with your latest data.
You can use one of our readymade templates or create one of your own. As with the dashboards, our reports are white label, so they can be customized to suit and reports can be sent out in all the main file types (PDF, PPT and CSV).

Any calculations, graphs, charts, or visuals you created in TapClicks (Features #3 and #4) will automatically be pulled across to populate your reports so they will always be up-to-date and you never have to do anything manually.
As with most features in TapClicks, you can set up and create reports for all your campaigns and clients once only and it's done forever, until you decide to change it.
And, as with the dashboard features, you can set permissions so that each audience sees the information that's relevant to them. You can set reports to be distributed to whatever schedule you wish weekly, monthly, or whenever the reporting period falls and they will automatically be sent out to whoever you selected to receive them.
Here's a short video on how to schedule reports with TapClicks:
Case Study: How TapClicks Saves Lessing-Flynn Multiple Hours Each Month and Provides Benchmark Intelligence to Retain and Attract Clients
Before using TapClicks, full-service agency Lessing-Flynn created reports by reviewing data on Google Analytics and several other data sources and then downloading it painstakingly into Excel spreadsheets. This was taking up many hours of the team's time each month and preventing them from focusing on what the analytics actually showed in terms of optimization strategies.
By pulling data directly from all the data sources they needed, including trade show activity and other traditional data sources, TapClicks completely eliminated the need to do anything manually, saving the agency a significant amount of time. Lessing-Flynn's clients are now able to view their data directly in a more user-friendly format than spreadsheets, whenever they want via their live dashboards.
Lessing-Flynn also uses TapClicks to view data across different channels and clients which allows them to benchmark their work and instill confidence in both existing and new clients.
You can read the full case study here.
Want to Try TapClicks as Your Marketing Reporting Software?
Using some kind of marketing reporting software is a must for a marketing team or agency that wants to scale. But not all reporting tools are equal, as we've demonstrated in this article.
TapClicks fulfills all 5 of the essential features we laid out in this post. With TapClicks, you can pull data from all your data sources, store that data in your own marketer-friendly data warehouse, do complex calculations, and create visualizations automatically and at scale. You can have these reports sent out automatically to stakeholders and clients on any schedule you choose.
If you're interested in how TapClicks could be a marketing reporting software solution for your organization, you can try it free for 14-days or schedule a demo to learn more.
7 Alternative Marketing Reporting Software Tools
As discussed in this article, there are a huge variety of marketing reporting software tools available ranging from marketing reporting dashboards (e.g. DashThis) to more complex BI tools (e.g. Zoho Analytics).
It's worth mentioning that, not only can you create reports directly within TapClicks, you can also export your data to any other platform or tool. So, if you're already using one of the tools below, you can use TapClicks to collect and store your data and then push it out to that tool within the TapClicks platform.
Here's a brief look at 7 marketing reporting software tools:
AgencyAnalytics

AgencyAnalytics is a dashboard reporting tool with 70+ out-of-the-box connections to many of the major marketing channels. Used by many digital agencies, it comes with a range of SEO tools to track ranking and competition, social media activity, monitor backlinks, and audit sites.
AgencyAnalytics features a drag-and-drop editor to customize automated reports and dashboards while the dashboards are white-label so they can be integrated with any company's branding.
To check out our full article on the difference between AgencyAnalytics and TapClicks, click here.
DashThis

DashThis is a reporting and analytics tool built on pre-made templates and drag-and-drop widgets. With 30 data integrations, it offers easy-to-use, straightforward analytics with some of the popular marketing platforms.
DashThis tends to be used by smaller agencies looking for more straightforward analytics without data transformation or data storage.
Domo

Domo is a business intelligence and data visualization platform that is fully mobile. Domo integrates with hundreds of data sources and tools from your CRM to social media and web analytics.
A key feature is Domo's App Dev Studio which enables business users to build custom intelligent apps to aid workflows with little or no coding experience. The platform does require some upskilling but can be a good option for large businesses who want this extra functionality.
To check out our full article on the difference between Domo and TapClicks, click here.
HubSpot
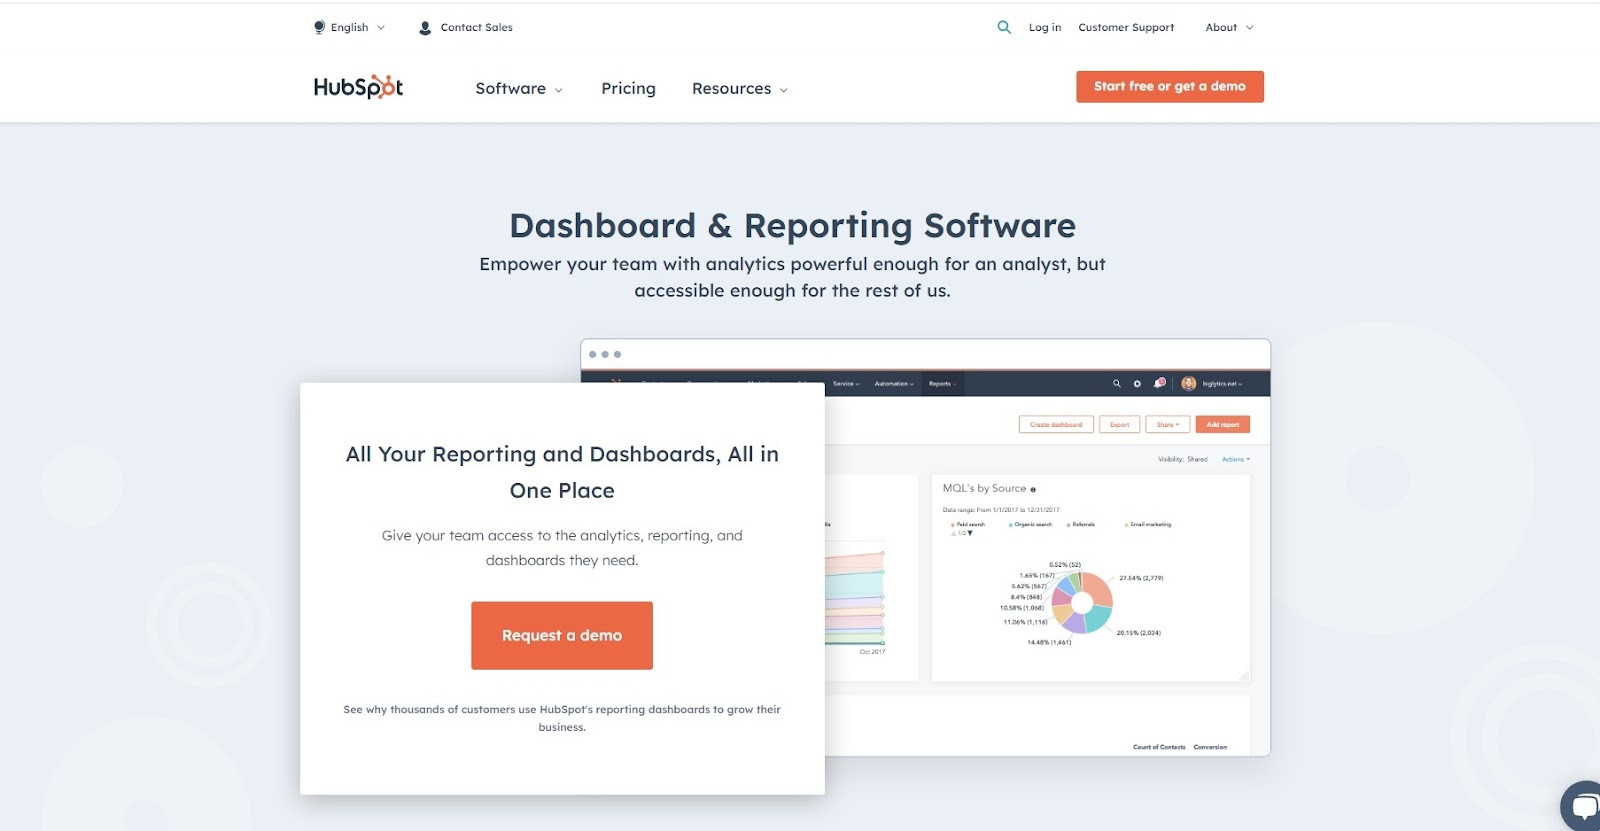
HubSpot offers dashboard and reporting software that integrates with all its other products (e.g. CRM) via the HubSpot Marketplace.
You can choose from a library of pre-built marketing, sales and service dashboard templates and use a drag-and-drop interface to customize up to 300 dashboards that can be shared via Slack or email right within HubSpot.
Klipfolio Powermetrics

Powermetrics is Klipfolios lighter business intelligence product that caters to marketing teams who don't need the advanced and labor-intensive customization that a full BI tool offers. Features include the ability to connect and automate updates for your data including pulling data from spreadsheets and databases.
Unlike most BI tools, Klipfolo stores your data history so you don't need a separate data warehouse.
To check out our full article on the difference between Klipfolio and TapClicks, click here.
Whatagraph

Whatagraph is an automated digital marketing tool that has integrations with 40 marketing data sources including Google Search Console, Twitter and Google Ads.
You can monitor and compare cross-channel data in real-time via the platform, create reports from customizable templates and schedule them to be sent automatically to clients and stakeholders.
Zoho Analytics

Zoho Analytics is a self-service BI tool with 100+connectors and in-depth data reporting functionality and visualization tools.
Interactive dashboards and reporting templates can be used for ad hoc reporting or automated. The platform has an intelligent assistant powered by AI which is used for data analysis in real-time. The tool requires some technical know-how and is a powerful reporting and analytics tool.
If you're interested in how TapClicks could be a marketing reporting software solution for your organization, you can try it free for 14-days or schedule a demo to learn more.