
DSP Reporting: 3 Features Marketers Should Consider

DSPs automate the buying and management of digital advertising inventory (e.g. ads on mobile apps or website banner ads) from multiple publishers and sources. They are an efficient way for agencies to manage the whole process from rate negotiation to optimization across a large number of websites they would otherwise have to interact with individually.
For agencies and brands running programmatic advertising campaigns via DSPs (demand-side platforms), reporting can be a challenge, especially if campaigns on DSPs are only one part of a larger marketing strategy.
Typically, DSPs don't have access to all the digital advertising inventory available so agencies use more than one DSP as well as other marketing platforms. This means that reporting on multiple campaigns is tedious because the data is disparate. You need to fetch performance data from the different DSPs and do calculations on it to get meaningful takeaways and insights. And then, usually, you create visualizations to put into reports for clients and stakeholders. It's a time-consuming process that some marketing teams and agencies have told us eats up dozens of employee hours a week.
Our DSP reporting solution, TapClicks, handles the entire data management lifecycle for you in one place, providing a central hub for all your DSP and marketing data from which you can:
- Import all DSP data and permanently store it in your own marketing data warehouse.
- Do advanced calculations and automate repetitive calculations.
- Create and schedule automated reports.
It automates multiple parts of the DSP reporting process, saving a lot of employee hours and giving marketing teams the tools and time to extract more interesting insights from their digital campaigns.
In this article, we'll explain the 3 features TapClicks offers which we believe are essential for an effective DSP reporting tool.
If you think TapClicks could work as a DSP reporting solution for your organization, you can try it free for 14-days or schedule a demo to learn more.
Feature #1: Aggregate All Your DSP Data into One Place
Handling disparate data is a common challenge for marketing agencies and brands, with many running campaigns on more than one DSP plus several other data sources, for example, radio, print ads, etc., not to mention non-marketing data such as sales and eCommerce data which you want to add into the mix.
Collecting all the different data sets from multiple sources (including your DSP sources) is tedious and time-consuming. You need to use a tool (for example, an ETL tool) to do this for you or collect the data manually from each source. And you would need to do this every week or month, or whenever your reporting period falls.
TapClicks resolves this issue in two ways:
TapClicks Pulls Data Automatically from Thousands of Data Sources (Including Your DSP Data Sources)
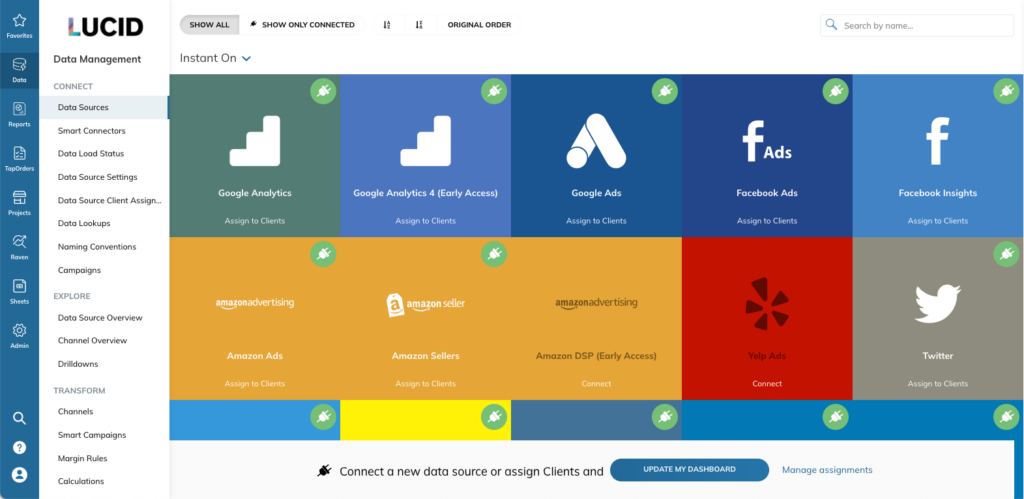
TapClicks connects to thousands of marketing data sources, including DSPs and other data sources (e.g. eCommerce and sales data). Using our Smart Connector tool, we can pull data from almost any source, including offline databases, immediately and automatically.
We have hundreds of direct integrations to marketing platforms as well as many popular DSPs, for example, Choozle, StackAdapt, Amazon DSP, and Yahoo.
Plus, we manage all the APIs so your developers don't need to. If there's ever an update required or a break in a data connection, the TapClicks team takes care of it for you.
Once you've set up connections to extract all your DSP data, along with other data, it will be collected daily, or whenever you choose to refresh it, automatically. This means that you will always have up-to-date data from all your sources available for creating reports.
TapClicks Stores Your DSP Data in Your Own Marketing Data Warehouse
Once you're pulling data from your chosen sources, it will flow into your own TapClicks data warehouse.
Unlike typical data warehouses which require SQL, the TapClicks data warehouse is accessible without database programming knowledge. Any marketer can extract data from it from a graphical interface (we'll talk more about this in the next two features).
It's worth noting that for most data integrations you can also pull 12 months of historical data. That, plus the fresh data that's pulled daily, is stored in your data warehouse permanently for you to access when you want.
One of the benefits of having a solution such as TapClicks which pulls all your data from your DSP platforms and other sources and stores that data for you in your own data warehouse is that it gives you significant flexibility. There is no limit on how many campaigns, clients, or brands you can do this with, so it's scalable, too.
Feature #2: Create Custom Metrics and Do Advanced Calculations on All Your DSP Data
All campaign reporting including digital ad performance from DSPs requires doing calculations on the reporting data to get to higher level takeaways and trends that management teams and clients care about.
For example, they want to know:
- Total ad spend month over month or week over week
- Cost per impression MoM or WoW
- What are the best performing ads (e.g. display ads, sponsored display, video ads, audio ads, etc.)
- Performance by product line or brand or campaign (e.g. ad clicks, CTR)
- ROAS (return on ad spend) by product line or brand or campaign
And so on.
These calculations are inevitably repetitive almost any marketing team, in-house or agency needs to report on metrics like these weekly or monthly, or whenever a client or stakeholder requests them.
While a DSP will provide you with a certain amount of reporting information, it will be restricted to the metrics set by the platform and will only be for the ad campaigns you run with that platform.
If you're running campaigns on different DSPs and other mediums too, without a solution like TapClicks, you'll be spending time manually doing tedious calculations on Excel spreadsheets so you can plot and graph data for your clients. And if you (or your data analysts) are doing this for every campaign or client every week or month, the time spent is significant.
Do Advanced Calculations Directly within TapClicks
With TapClicks, you can do advanced calculations directly within the platform. You can define and customize metrics to suit and use them across as many campaigns and clients as you wish. Here are a couple of examples:
Example #1: Define and Customize Umbrella Terms
Even though using a DSP cuts out a lot of the planning, buying and tracking time involved in placing multiple online ads, the individual platforms that integrate with the DSP will still have their own unique metric names (for example, subscribes on YouTube or follows on Facebook or Twitter).
These terms mean essentially the same thing and marketers often want to treat them accordingly by adding them up or renaming them as what we call an umbrella term.
In the social media example we just mentioned, we might like to categorize those terms like engagement.
Consolidating disparate metric names to create meaningful reports is a labor-intensive and manual process which involves multiple spreadsheets and many hours of employee time.
With TapClicks, you can define an umbrella term just once and your specification will be available within the platform forever, with updated data, to be used across as many campaigns and clients as you like.
In our example below, you might define total social engagement as the sum of post reactions on Facebook, views on YouTube, or click-throughs on LinkedIn. That newly defined metric can now be used in any report or calculation and TapClicks will automatically calculate what the total social engagement value is for whatever date range you choose.
You will never have to manually add up those metrics again.

Example #2: Set up Advanced Calculations
As well as defining umbrella terms, you can also do all kinds of advanced calculations on your data in TapClicks.
For example, if you are a tire manufacturer and you have ad campaigns running for multiple brands across different DSPs, you might want to view your data by brand. With TapClicks, you can set up calculations that find specific brand names within the campaign names and aggregate stats across all of these into single metrics for that specific brand. And this is easy to do because all your data has already been pulled into the TapClicks platform (see feature #1 above).
For example, below we can see that there are 266 Facebook Ad campaigns, all pulling in data from our data sources.
We've decided to name a certain segment of those campaigns HNP Campaigns' (see arrow on the right-hand side).
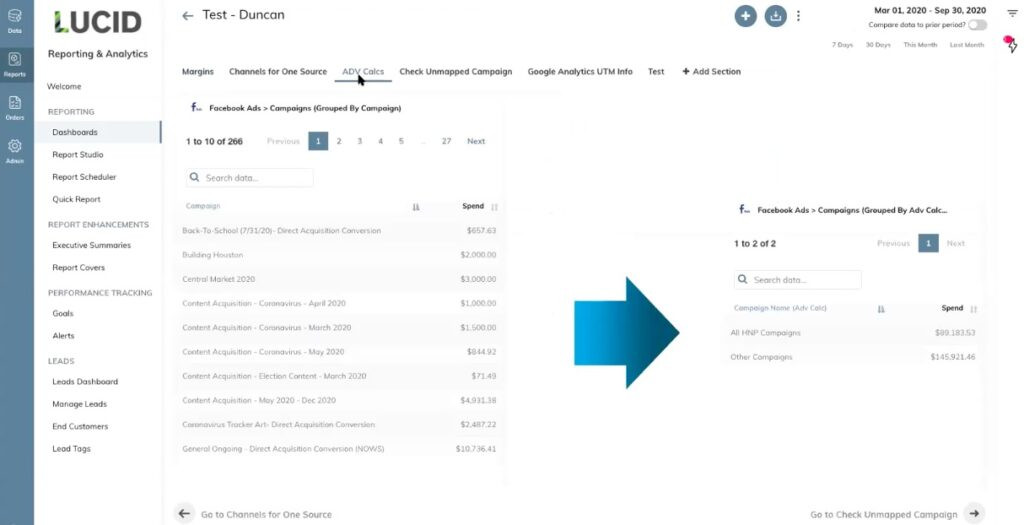
This means we can now pull data just for those HNP campaigns into any report or dashboard we want to create.
Here, there are 191 of them, and data for all of those campaigns is pulled into one line (see arrow on the right-hand side).
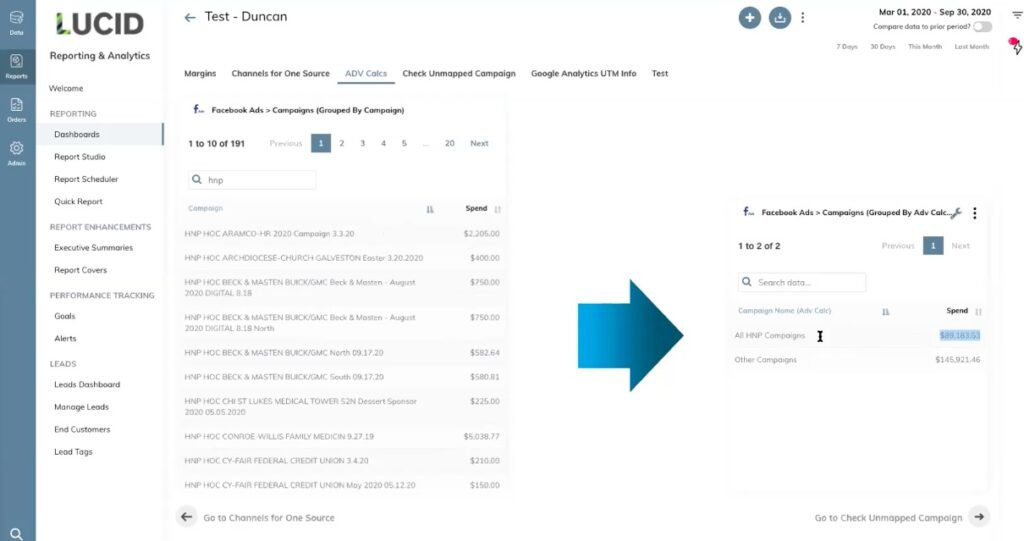
This useful function can be used to group and view data by all types of location or segment (e.g. product, campaign type, or group) and zoom in and out as needed.
You can calculate the overall CTR (click-through rate) by adding up clicks across many campaigns and dividing by total impressions. You could calculate cost per click for campaigns across a region or specific product lines by adding up total spend and dividing by total clicks.
These features give you endless possibilities and the flexibility to scale, something which would be extremely difficult to achieve without a tool such as TapClicks.
As with everything in the TapClicks solution, you need only set these up once. Then every reporting period, the calculated metrics are up-to-date and ready for you to report on.
We'll discuss this next.
Feature #3: Create and Schedule Automated Reports From the TapClicks Platform
Creating reports from disparate data sources is time-consuming for all the reasons we've mentioned already unwieldy amounts of data from different DSPs, doing a lot of the work manually every reporting period, etc.
In TapClicks, clients or stakeholders can view their data visualizations in two ways:
- Via customized dashboards
- Via PowerPoint-style reports
View DSP Data via Customized Dashboards
With TapClicks, you can view your DSP data within a dashboard setting which displays the metrics you set up (#2 above) via whatever plots, graphs and visualizations you configure. Dashboards are white label so you can customize them to suit clients or brands and, once created, can be used as templates across as many clients as you wish.
For example, you could create a Programmatic Advertising dashboard which includes all the different types of digital activity (e.g. sponsored brands, display ads, video ads, audio ads, etc.) along with various metrics such as conversions, CTRs, ad spend, etc.
The beauty of the TapClicks platform is that you can use any dashboard you create as a template. So, for our example, you could use the same dashboard for all the clients who are running programmatic ads via DSPs. And, if you want to make a change, for example, if you want to reconfigure an umbrella term, that change will be applied automatically for all clients.
It's also worth noting that if you don't want the change for all clients, that's easy too. You just select the clients you want the change to apply to.
View DSP Data via Automated PowerPoint-style Reports
While clients can be given direct access to their data dashboards within the TapClicks platform (if you grant them permission), in our experience many clients or stakeholders also want emailed reports (Eg. PowerPoint or PDFs).
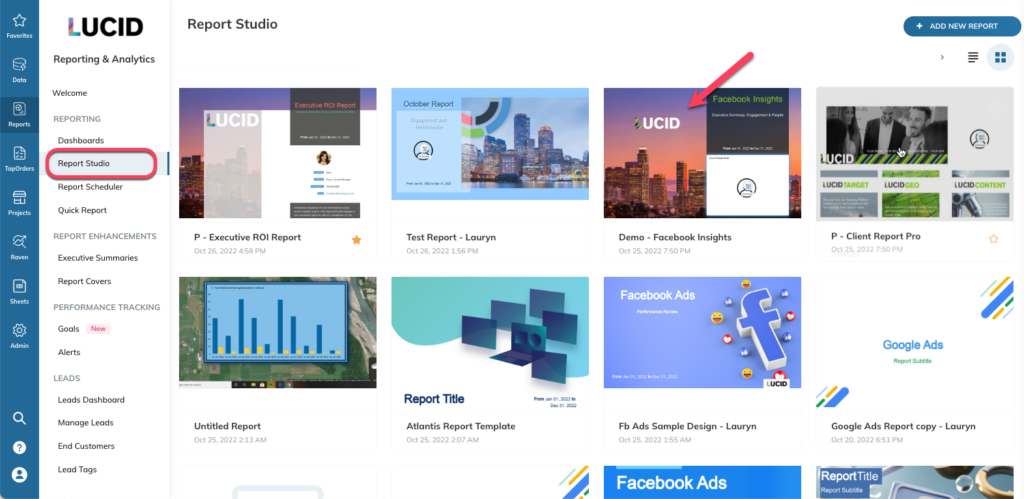
This is why we designed Report Studio, a report builder which allows you to create beautiful-looking PowerPoint-style reports and schedule them to be sent to clients and stakeholders whenever you want them to weekly, monthly, etc. and the data in all number fields, charts, and graphs will be automatically updated when the report is sent out.
This can save agencies and marketing teams a lot of employee hours that are typically spent updating the same monthly or weekly reports with the latest numbers.
You can use one of our report templates and customize it to suit or you can create your own from scratch.
You can set up reports to be scheduled to whatever timeframe you choose (e.g. weekly, monthly) and sent to the recipients you select.


Here is a short video on how to schedule reports with TapClicks:
This means that you can do the entire DSP reporting process pulling the data from all your data sources, storing that data, doing advanced calculations and creating custom metrics, and creating and distributing meaningful DSP reports to clients and stakeholders all within the TapClicks platform.
If you think TapClicks could work as a DSP reporting solution for your organization, you can try it free for 14-days or schedule a demo to learn more.