Marketing Report Examples Designed by Us and How to Automate Them

Creating marketing reports for clients is an essential part of an agency's job, but it's tedious and time-consuming. Marketers spend dozens or hundreds of hours creating reports gathering data from different sources, analyzing data sets in Excel spreadsheets, and then producing presentations that need to be delivered regularly (e.g. weekly or monthly) to clients and stakeholders.
Having worked with hundreds of marketing agencies for over a decade running TapClicks, we believe that automation is the key to producing insightful reports for enterprise-level clients. A great marketing platform should be able to do the following 3 things:
- Automatically pull data from all your marketing sources so you don't have to.
- Automate repetitive calculations and data analysis, so your team doesn't have to compute the same metrics every week (or every month).
- Automatically create marketing reports where the latest numbers are automatically updated every time the report is generated.
If you can automate gathering data, doing analysis, and building reports, your marketing team or agency can save dozens of employee hours every week. We built the TapClicks platform to automate the entire reporting process and regularly save you hours of tedious and repetitive work.
In this article, after we share marketing report examples, we'll carefully explain each of these TapClicks features.
If you think TapClicks could work as a marketing reporting solution for your organization, you can try it free for 14-days or schedule a demo to learn more.
TapClicks Marketing Report Examples
Here are just a few marketing report samples you can create within the TapClicks platform:
Social Media
TapClicks allows you to tailor each report and drill down into a high level of detail.
The marketing report sample below shows the number of YouTube views broken down into various time metrics.

You can read more about social media report templates in this article.
PPC
With Report Studio, you can include whichever data you like and view that data in a variety of ways.
The slide below shows the KPIs versus the conversion rate over a week for a PPC campaign.
You could also look at the data across different timescales and add in data from other campaigns to see campaigns side by side.

The slide below shows a high-level view of the performance of a PPC campaign across 10 months.
You can include as many metrics as you wish and show them as snapshots (as they are here) or as a graph or line chart.
This helps you and your clients get an overview of your marketing campaigns to make decisions about marketing strategy and assess return on investment.

You can read more about PPC report templates in this article.
Search Engine
The example below is a Google Analytics report showing a high-level view of performance KPIs plus more detailed information of performance over time, awareness, and traffic sources.
The report can be configured however you like so you can filter metrics in or out and view them in different graphical formats.

Overall Performance
The report template below has been set up to feature the high-level performance data for two social media campaigns (Facebook and Instagram).
One of the features of TapClicks is that you can also include the visuals of the ad creative directly alongside the data it relates to.
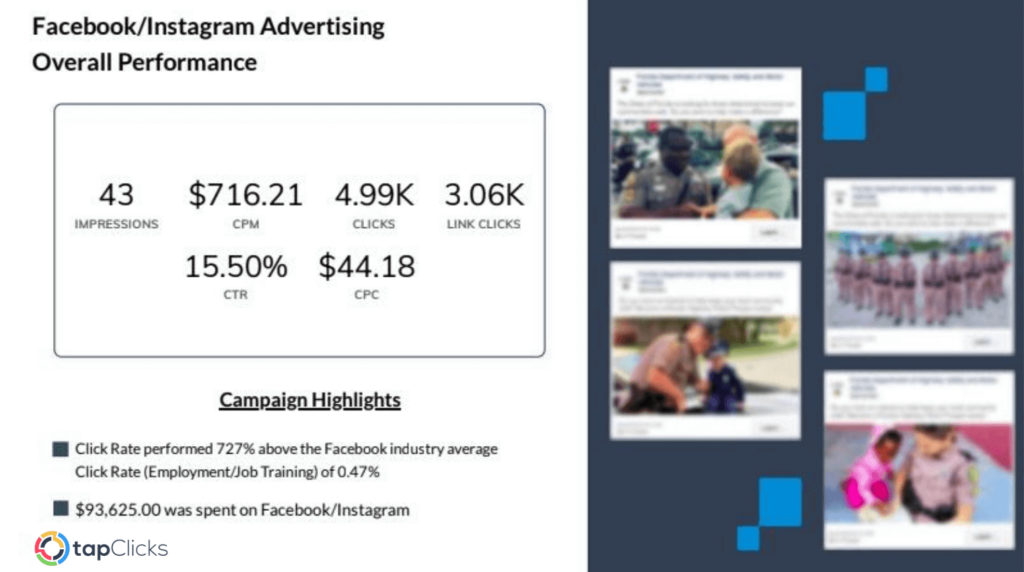
Seeing everything in one place helps tell a story and contextualize the data.
Executive Summary
As well as drilling down into the detail for each campaign or viewing campaigns alongside one another, you can zoom out and create a high-level executive summary for clients, too.
This can include anything you choose such as goal completions, performance highlights, and future plans.
You can read more about monthly report templates in this article.
Having looked at a few marketing report examples, we'll show how each of the 3 TapClicks features we mentioned above can save you a ton of time.
#1: TapClicks Pulls Data from All Your Marketing Sources
Marketers typically run several types of marketing campaigns at once. For example, social media, email marketing, and content marketing, to name a few.
So, when reporting time comes, the data from all these marketing channels have to be collected from each source manually (e.g. Google Analytics, Facebook, etc.). And this has to be done every week or month, or whenever the reporting period falls. This is hugely time-consuming.
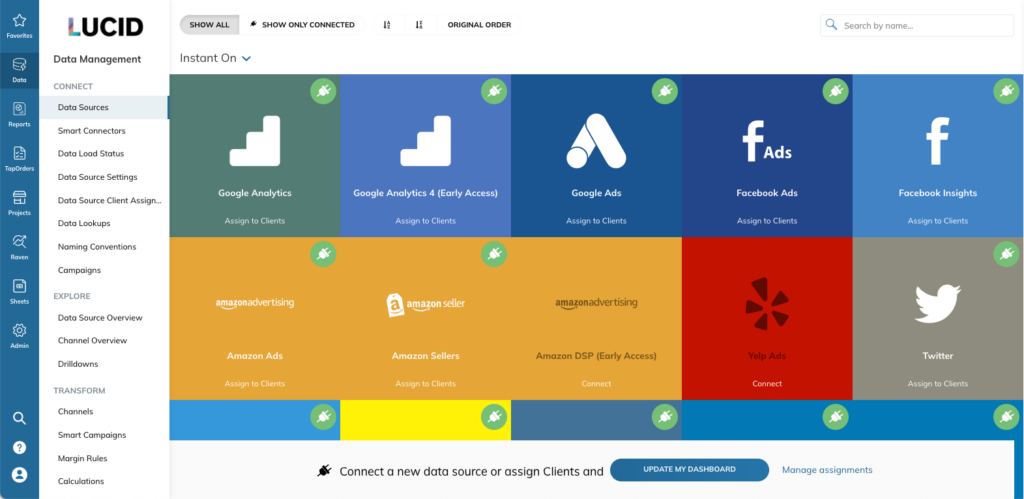
With TapClicks, you can connect to thousands of data sources and have all your data flowing automatically into your own TapClicks marketing data warehouse via our Smart Connector tool. This includes home-built databases and offline data sources. We also have hundreds of direct data integrations with marketing platforms as well as sales and eCommerce sources.
Once connected, data will be pulled automatically and daily so it will always be up-to-date. You can also refresh it at any time. And, in some cases, it can pull 12 months of historical data, too.
Because TapClicks manages the APIs with the marketing platforms, you don't need to worry about a connection breaking and you don't need a developer the TapClicks team will take care of it for you.
Being able to pull data from all your marketing sources into one place automatically saves you a massive amount of time. It also gives you the ability to scale.
#2: Automate Repetitive Calculations for Your Marketing Reports within the TapClicks Platform
The challenge facing marketers (if they don't have a tool like TapClicks) is that analyzing their marketing metrics is a laborious and complex task. To create meaningful visualizations and reports, you need to juggle a lot of data, usually in several spreadsheets, and manually do calculations and plot graphs. Inevitably, for marketing reports, these calculations need to be done over and over again, usually on a monthly basis.
For example, if you are a social media agency and you want to report on total likes, follows and other engagement metrics that your campaigns have generated, you would need to add these up manually from every campaign and every social media platform and repeat the process each reporting period. Multiply this by all the metrics you want to look at and then by campaign type and client, and you quickly have a mountain of work. Yet this is normal for most marketing teams and agencies their employees spend dozens of hours every month (or more) on these rote reporting tasks.
With TapClicks, we store all your data (see #1), so you can define calculations just once and never have to do them again.
Here's one illustration of how it works:


You might define total social engagement as the sum of post-reactions on Facebook, views on YouTube, or click-throughs on LinkedIn, as shown above.
Once that custom metric is defined, it will be available in TapClicks forever, with updated data. Other examples include:
- Total traffic driven from our campaigns
- Total return on ad spend
- Average cost per click
- And so on
With TapClicks, your team will never have to manually compute those metrics again to create marketing reports. This is a huge time-saver.
#3: Create Marketing Reports Two Ways
As we mentioned above, agencies can spend dozens or hundreds of hours every week or month number crunching and creating visualizations and reports.
There are free downloadable marketing report templates available which can be useful for small agencies. In fact, we have our own free report template which we discuss in more detail in this article.
But when you're running many campaigns and have multiple clients, updating a template manually is inefficient. Being able to create reports automatically in different formats for your clients gives you flexibility and scalability.
Next, we'll look at the two different types of marketing reports offered by TapClicks.
Marketing Visualizations via Dashboards
TapClicks offers customizable dashboards. Once you've set them up, they'll be automatically populated with the latest data. If you give clients or stakeholders access, they'll be able to view the latest information whenever they want, so you may not even need to generate a monthly marketing report.
You can choose from several ready-made dashboard templates (some of which we showed above) which include social media marketing channels, ad networks, and email campaigns, or you can create your own template from scratch.
Each marketing dashboard can be customized to suit whichever campaign or client you want and configured to include whichever metrics (we call these widgets) you set up.
For example, you can include the CTR (click-through rate) for a digital marketing campaign and view this alongside the KPIs you set to monitor your marketing performance.
You can then visualize the data however you wish graph, pie-chart, bar chart, etc.

The beauty of the TapClicks solution is that dashboards or visualizations can be turned into templates and applied across multiple dashboards. Agencies can create one dashboard for a specific type of report (e.g. digital marketing report) and filter the data to each client.
Here is a video showing how to set up a dashboard in TapClicks:
Grant Access to Your Clients
With TapClicks, you can grant permission for clients to access their dashboards, so they can view their performance reports themselves.
You can set up individual permissions at the widget level so that different stakeholders only see the important metrics relevant to them. For example, if you don't want clients to see your mark-up costs, you simply deselect this widget.
Providing clients with access to their dashboard helps to prevent last-minute ad hoc report requests with no need for scheduled reports, either.
In our experience, although clients can view their analytics data themselves, most clients prefer marketing reports emailed to them at a set time (usually on a monthly basis) and in a particular format. This can be easily done with TapClicks.
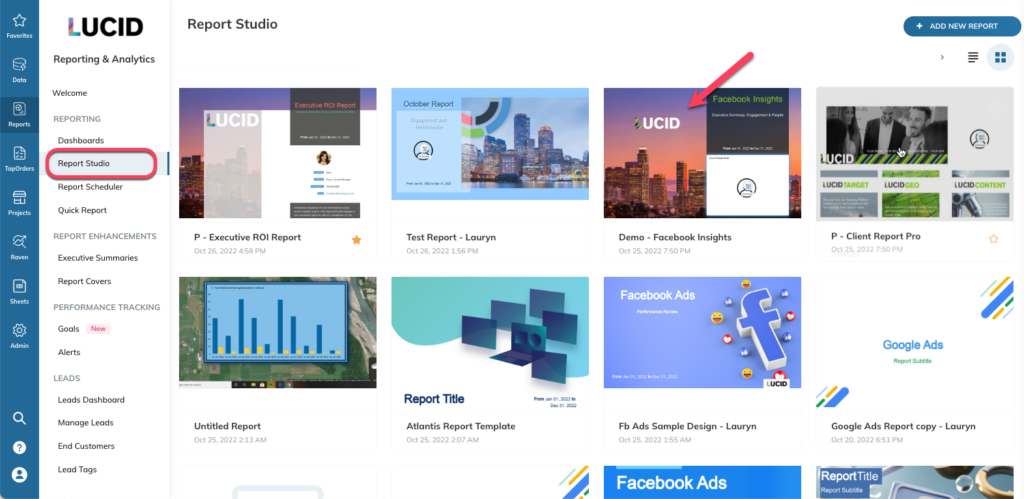
Schedule PowerPoint-Style Reports for Clients
With TapClicks' reporting tool, Report Studio, you can create PowerPoint-style reports that are automatically populated with your latest data and schedule them to be sent out to clients or stakeholders whenever you want.
As with the dashboards, you can use our white label templates as a starting point and customize as many different reports as you like (e.g. social media report, SEO report, PPC, weekly marketing report, etc.). All the metrics that you configured will be automatically pulled across into the reports to whatever date parameters you set since all of your data is held within the TapClicks platform.
Like so many of the TapClicks features, you need only set up the reports once for your marketing activities and they'll be there, ready for you to use, whenever you choose.
Reports can be distributed via email or PDF (PPT or CSV) to the people you want them to go to (e.g. clients, marketing team, or sales team) allowing them to review campaign performance against the marketing plan and revise the marketing strategy if needed.
And, as with the dashboards, you can create a master report template that can be used across several campaigns or clients which saves you a huge amount of time.
Here is a short video on how to schedule reports with TapClicks:
Want to Create Your Marketing Reports with TapClicks?
We've explained how time-consuming and labor-intensive it can be to create marketing reports without a tool like TapClicks. Having a solution that automates the entire marketing process from data collection to analytics and report creation is essential for enterprise agencies with dozens or hundreds of clients.
TapClicks provides a software solution that saves agencies and marketers a huge amount of time, so you can create any marketing report you want, automatically, and at scale.
If you think TapClicks could work as a marketing reporting solution for your organization, you If you think TapClicks could work as a marketing reporting solution for your organization, you cantry it free for 14-days or schedule a demo to learn more.