
Marketing Campaign Dashboard: Templates That Scale Across Channels & Clients
For any marketing agency or in-house marketing team that's running more than a handful of campaigns, a marketing campaign dashboard becomes an absolute necessity. Without it, it's tedious for marketers to send separate reports with key metrics for all your marketing channels to stakeholders.
There are many marketing dashboard tools on the market but the details of the tool can help dictate which one is a good fit for you.
If you're regularly dealing with multiple campaigns and a lot of data, here's what you should look for when researching dashboard solutions that track your marketing efforts and help you evaluate campaign performance:
- The ability to connect to every major platform in real-time and pull in marketing data directly and automatically so you don't have to do it manually.
- The ability to create templates so you can edit one thing (the template) and have those changes be automatically applied across dozens or even hundreds of dashboards (e.g. for all clients).
- An integrated reporting solution which lets you easily create PowerPoint-style presentations that you can automate and send to clients at the rate you choose.
- A marketing reporting solution which auto-updates your charts and presentations so you don't have to do it yourself.
We've designed TapClicks to have all these features, and in this post, we'll walk through and demonstrate the benefits of each of them. Then, we'll show you some examples of our marketing dashboard templates.
Want to see how easy it is to use the TapClicks marketing dashboard and ReportStudio features? Try our free 14-day trial.
The Ability to Connect to All Data Sources
First, it's important that your marketing campaign dashboard has the ability to connect directly (via API) to ad and marketing platforms like Google Ads, Facebook Ads and SEO tools. Without this capability you'd need to manually import the data from each platform, a time consuming and laborious process.
TapClicks currently has over 250+ marketing-specific live API connections to leading platforms. This includes live connections with popular advertising and social media channels (Google Ads, Facebook Ads, etc.), SEO platforms (MOZ and Google Search Console), CRM tools, and more.
Most of these connectors can be set up to pull real-time data within an hour. Plus, we can pull in historical data (up to 12 months on most platforms) so you can start making more informed decisions from day one.

You can also use our Smart Connectors' feature which allows you to connect your own data to the TapClicks platform independently.
For example, you could use this function if you have data you've collected from a conference that you want to incorporate into your analytics dashboard. TapClicks will automatically pull this in and your dashboard will immediately be up to date.
And, because the interface is white label, you can use your own logo so that it is branded to suit you or your client.
We've made the process of connecting to a data source really easy. Simply select the data source you want to connect to from our Manage Services' dashboard, enter your details into the login screen, select an account and who to assign it to, and click Update'.
You are now connected to that data source and your data will flow straight into your dashboard, completely eliminating any manual processes.
There are over 30 options of metrics available for each data source (e.g. budget, follows, engagements).
You can customize what you want to look at for each one giving you complete control of which marketing metrics you focus on.

A Choice of Customizable Robust Templates by Channel
All of our products are highly customizable including our reports and dashboards.
When your data is pulled into TapClicks, you can start by sorting it into a dashboard template.
We have ready-made templates for PPC, social media marketing channels, email campaigns including bounce rate, and more (see our examples, later).

Each dashboard is made up of highly customizable widgets.
For example, your dashboard on Google Ads performance can be reflecting the past month of data, while your widget that displays impressions can show the last two months of data. This lets you customize any report to exactly what your client, department, or company needs from that particular data.
You can also integrate data from multiple platforms into one metric.
For example, if you want to show your client the total cost of ad spend across Facebook, Google, and LinkedIn, you can roll those numbers up into one metric and call it: Total Ad Spend.
Templates Let You Easily Make the Same Changes Across Many Dashboards or Reports
With most reporting tools, template edits are not automatically applied to live dashboards. They'll apply to new dashboards, but you still have to go and make those edits to your live dashboards.
But with TapClicks, if you make a change to your template, it can be automatically applied to all of your client dashboards using that template. You won't have to retroactively go back to each one and make that update.
This is a huge gain in efficiency and optimization that allows you to easily manage more reporting dashboards.
Continuing with our Google Ads marketing dashboard example from above, here's how you go about customizing your dashboard:
After selecting the Google Ads template and connecting your Google Ads related platforms to your account you can edit your dashboard to reflect which KPIs you want displayed.

Dashboards are made up of widgets. These widgets can be removed completely or edited.
You can even change the date range of data for individual widgets.
For example, you may want your overall dashboard to reflect May's numbers, while showing May and April data within your Average Cost Per Click (CPC) widget.
Creating and Editing Widgets
If you want to add different widgets, you can easily create a new one.
Just click the plus (+) sign at the top of your Google Ads dashboard.

From here, you can select which data sources you want to include in your widget.
Plus, you can pick how you want the data organized (such as by ad groups or date range).
Then, you can pick how you want the data displayed (a table, a chart, a bar graph, etc.).

Once you're done setting the parameters, just click Save and your new widget is now on your Google Ads dashboard.
The Ability to Create and Automate Campaign Reports Straight from Your Dashboard
Most agencies do their reporting manually, spending tens to hundreds of hours each week on laborious, inefficient processes.
This involves patching together different reporting tools such as Excel spreadsheets, PowerPoint, and Google Docs which require a lot of work to build and maintain.
This means that data visualization and customizability are limited, so your ability to tell compelling stories to clients is also limited.
The ability to create and automate reports for all your marketing activities will help you monitor your KPIs (key performance indicators) and conversion rates accurately so you can optimize your marketing campaigns and adjust your marketing strategy accordingly.
A core functionality of TapClicks is devoted to marketing reporting.
And, there's the option of tying in your marketing dashboard to your marketing operations platform so you have one seamless solution for all your marketing analytics campaigns.
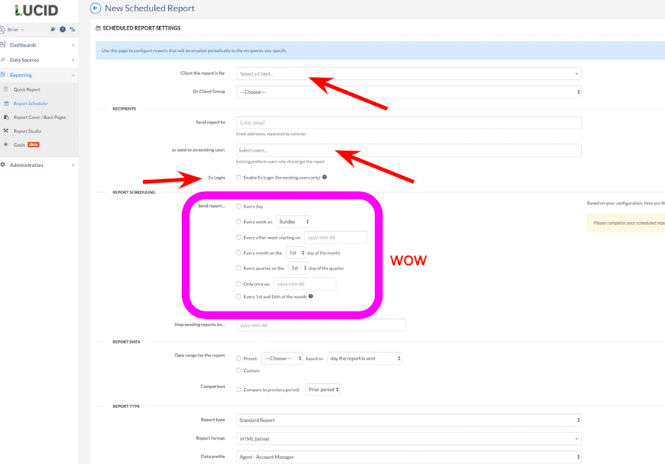
Within the TapClicks ReportStudio, you can set up recurring reports and quickly create last-minute reports to monitor your marketing KPIs.
You can give your clients specific access to customized dashboards (with the permissions set by you, as explained below). You can display any data you choose lead generation, open rates, page views, organic traffic, website performance to provide an accurate picture of their return on investment.
Use Premade Report Templates, or Customize Them
You can choose from the TapClicks professionally designed suite of reporting templates, or you can upload your own.

As with our dashboards, the templates are white-label, so you can implement your preferred branding (whether that's yours or your client's) and choose a color palette to match.

Reports can start with an executive summary to list milestones and contextualize your agency's performance towards the client's big picture goals.
By setting up recurring reports, you can significantly cut down on the time your team needs to spend preparing reports, without sacrificing the quality of the report itself.
The Ability to Set Client Permissions That Suit You
Finally, a lot of TapClicks customers have different requirements for which clients or teams can see data from different marketing activities, so we let you set up custom permissions for clients who want to view their dashboards.
The really convenient feature with TapClicks is that you can set up these permissions at the widget level. You can customize a specific widget so that it doesn't display any sensitive information that you don't want the client to see (e.g. mark up costs).
You then give your client permission to access what you want them to see and save yourself having to manually send out custom marketing reports or respond to last minute requests.
The Ability to Automatically Populate Data from Your Dashboards into Your Report Slides
When you want to present your marketing report to your client, instead of bouncing back and forth between Excel spreadsheets and PowerPoint slides, the data you need and have pre-selected will automatically transfer from your dashboard and populate your slides saving you significant time.
Likewise, if you want to make a change to a particular dashboard, for example, Google Ads, this will be applied across all your clients as your dashboard is universal.
It's worth noting that you can also make a change to just one dashboard, if you wish.
So, auto-updates can be applied at all the levels from your dashboard, to your templates, to your presentation slides providing huge gains in efficiency for you and your clients.
The Importance of Scheduling Reports to Be Sent Out Automatically
We've already established that sending out marketing reports manually is a laborious process which limits your agency's ability to work efficiently.
We also save you a significant amount of time by letting you schedule recurring reports.
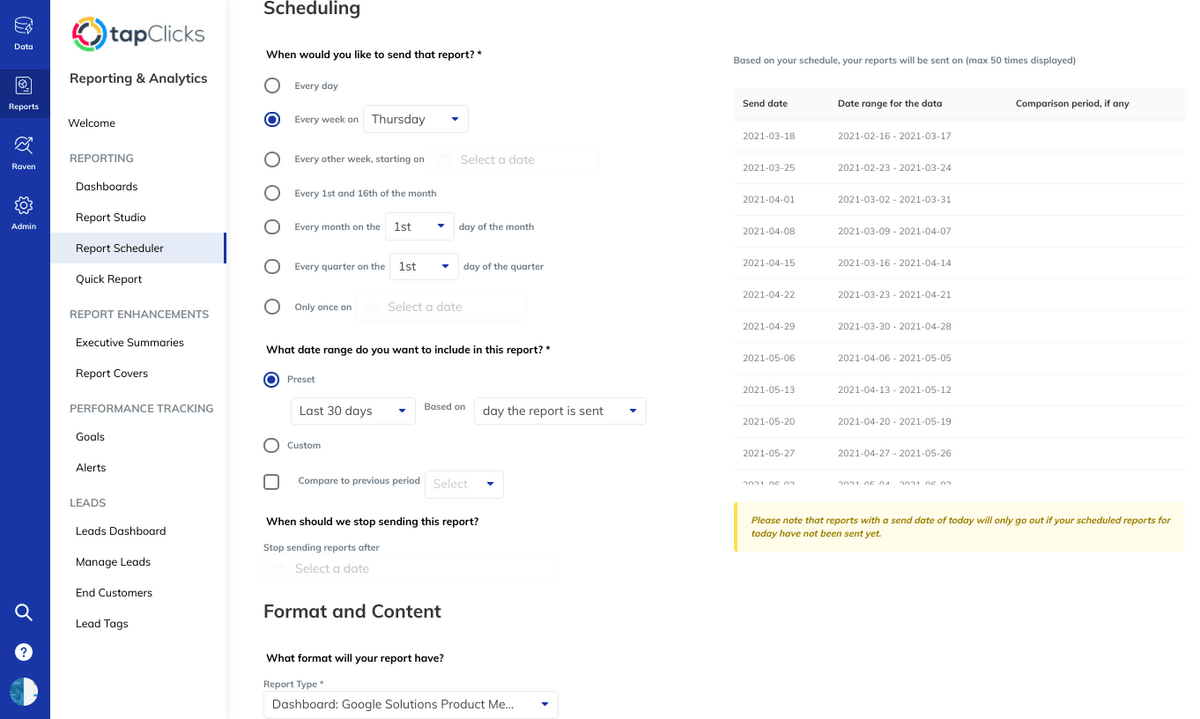
And, unlike other similar marketing platforms, we don't limit you to specific days.
When creating a recurring report, you can select how often you want reports to be sent out: every day, every week, every other week, on specific days of the month, and so on.
Reports can be scheduled for a set period of time (like if you signed a 3-month statement of work) and can be sent in all the main file types (PDF, PPT and CSV).
This level of customization and automation gives you a significant amount of flexibility which will allow for scalability while keeping your clients happy.
Examples of Our Most Popular Digital Marketing Dashboard Templates
We offer a deep suite of predefined dashboard templates. Some of the most popular include:
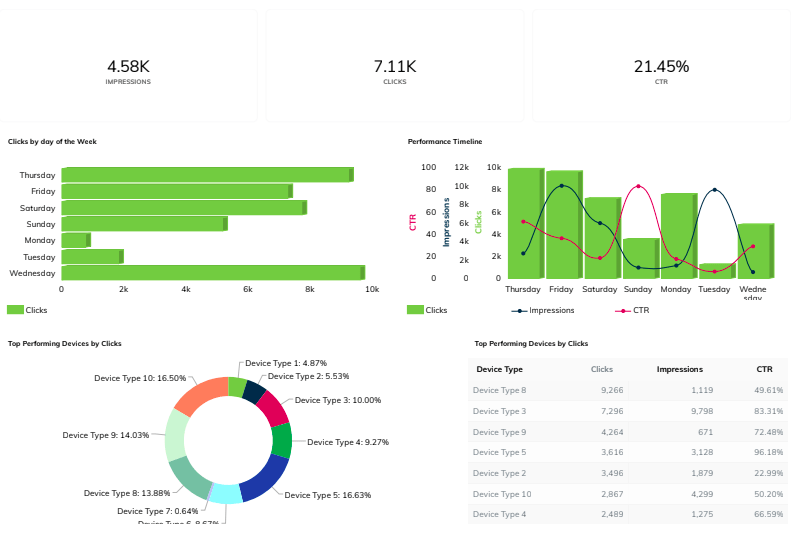
Google Ads Dashboard

Facebook Ads Dashboard

Google Analytics Overview Dashboard

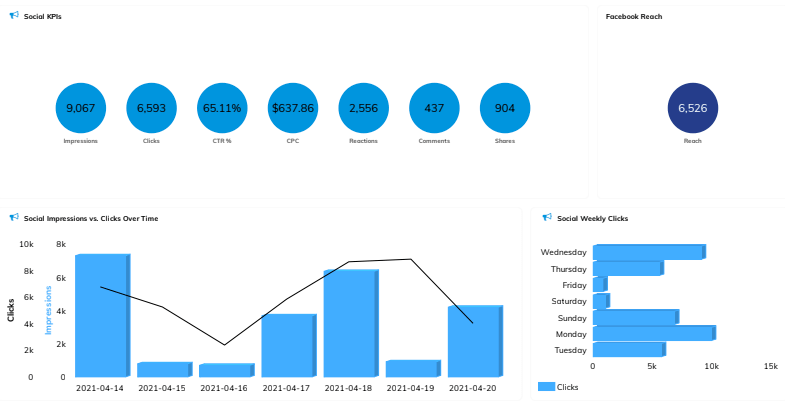
Social Media Dashboard
Web Analytics Dashboard

eCommerce Marketing Dashboard

Email Marketing Dashboard
In Summary
Agencies who use several different tools and manual processes to manage their data instead of a customizable marketing performance dashboard are not operating efficiently.
They are restricted in the marketing intelligence they can offer their clients. They are also not able to provide scalability.
The TapClicks marketing dashboard offers agencies and their clients a superior customizable solution which can operate seamlessly across all channels while automatically providing valuable information.
Want to see how easy it is to use the TapClicks marketing dashboard and ReportStudio features? Try our free 14-day trial.