
A reporting dashboard for Google Ads is a natural step for agencies and enterprises whose client base and operations have grown beyond the point where manually creating and managing ad campaign data in Google Sheets, PowerPoint, or Excel is sustainable/cost-effective.
But the key question for these organizations is: Which Google Ads dashboard is best for us?
After helping 3000+ companies over 12 years, we think a scalable, enterprise-grade Google Ads (formerly Google Adwords) dashboard solution should include:
- Native Visualizations: Ability to make any visualization in the tool itself without exporting Google Ads data to a spreadsheet or CSV.
- Easy Reports: Ability to turn those visualizations, charts, and tables, into a presentable report without having to take screenshots and manually build a slide deck.
- White Label: Ability to white label reports.
- All Platforms: Ability to also be a dashboard for all marketing campaigns across all platforms, not just Google ads(e.g. Facebook Ads, Linkedin, etc.).
Google has some native reporting tools itself (specifically Google Data Studio and Google Analytics), but they're limited in their options to visualize data (#1 and #2, above), don't have white label reporting (#3), and don't easily let you report on non-Google ads data without manual exporting and importing of that data (#4).
In this article, we'll show you how easy it is to create a Google Ads Dashboard in TapClicks and how it scales better than the competition because customizations can be automated to update all live dashboards with a few clicks.
We'll also walk you through some of our customizable templates to give you an idea of how powerful TapClicks is as a data visualization tool.
If you're ready to see how easy it is to build dashboards for Google Ads and every other marketing platform with TapClicks, try our free 14-day trial today.
Table of Contents
- How to Create a Google Ads Dashboard in TapClicks
- How TapClicks Scales Dashboard Reporting for Google Ads and Other Channels
- Examples of TapClicks' Customizable Dashboard Templates for Google Ads
- Additional Features for Managing and Reporting on Google Ads
How to Create a Google Ads Dashboard in TapClicks
TapClicks users can simply navigate to their dashboard and click on Manage Data Sources on the left sidebar.

Note: From the dashboard view above, you can see the live API feeds from all the major marketing platforms. Creating a dashboard for any of these platforms follows the same simple steps outlined for Google Ads.
Click on the Google Ads icon and log into the specific Google Ads account you want. Then, simply authenticate TapClicks to start extracting performance data.
One key benefit of TapClicks' Google Ads integration is that it allows clients to pull data from the last 12 months into TapClicks to analyze and visualize.
In fact, pulling historical data from the last 12 months is possible for all 250+ platforms with which we integrate, not just Google Ads. More on this below.
Past data provides context for new marketing campaigns going forward and a benchmark of past performance metrics so marketers can clearly see where improvements have been made or need to be made.
Create or Customize a Google Ads Dashboard Template
TapClicks allows you to create a Google Ads Dashboard from scratch by simply choosing a selection of native visualization or widgets that best display the metrics you want to monitor. Because these are pulling data from your live campaigns, they update automatically so your reporting is always current.
To save time, many users begin by selecting one of the pre-existing templates we offer and then customize the widgets as the campaign progresses. We offer over 20 dashboard templates from ad platforms like Google and Facebook to eCommerce platforms like Shopify.

TapClicks provides almost twice the amount of native visualizations as Google Ads Manager does, allowing you to provide more insights to your clients with the data you pull.
Customizing Dashboards and Editing Widgets
In the top right-hand corner of your dashboard, click the plus (+) sign.

This will take you to a widget creation screen where you have the option of which data sources you want (which Google Ads account), how that data is organized (ad groups, ad cost), which metrics you want to display (CPM, CTR, PPC, etc.) and how you want them displayed (graphs, tables, bar charts, etc.).

When you have finished customizing the widget to the specific KPIs you want to monitor, just click save and the widget will be displayed in your Google Ad dashboard.
Now, you can use this widget (a chart, graph, or any visual) in as many dashboards and reports as you wish, and if you want to update the widget itself, you can do that one time and it will automatically update every dashboard where it's used.
The Benefits of a TapClicks Dashboard for Google Ads(Scalability, Automation, and White Labeling)
TapClicks dashboards were designed to be scalable to the enterprise levels of Google Ads management (and marketing reporting in general), by:
- Allowing you to create dashboards in minutes for data from hundreds of different marketing and ad platforms, including Google Ads, so that all marketing data analysis and reporting is done in one place.
- Supporting unlimited campaigns per client. Other dashboard reporting tools require you to purchase higher pricing tiers for more campaigns which gets expensive as your marketing scales. Not with TapClicks.
- Allowing users to automate dashboard customizations across all campaigns, or just some campaigns, with a few clicks.
- Automated and white label reporting so your clients stay informed, and all reports are in their branding with no extra work for your marketers.
All Dashboards are Maintained and Displayed on a Single Platform
TapClicks connects to 250+ marketing and ad platforms in addition to Google Ads. We call these instant-on connectors'' and it includes Facebook, Twitter, and LinkedIn.
But even non-social platforms and specific media systems like Verizon Media, Adroll, AppNexus, etc. So, enterprise-level marketing that uses a mix of digital and traditional advertising has the software to conduct media buys on niche channels directly, without a broker.
Having a single view of all live campaign data from hundreds of markets and dozens of dashboards saves time because there is no toggling between dashboards and other reporting tools.
So, if you want to see how impressions in one channel directly affect the overall campaign CPC, or if you want to show your client what the total ad spend is across multiple channels, all of this can be done in TapClicks.
With this many data integrations, software maintenance can be a problem. However, TapClicks users never have to build and maintain data feeds and API-based connections to those platforms, which can be a massive development and resource drain.
Our development team has done the work of building the data integrations to these platforms and, since APIs and data integrations often break, it also means your development team doesn't have to deal with fixing it or talking to the ad platform (e.g. Facebook). We have those relationships and we'll ensure the data integration is always up to date and maintained.
This can be a massive resource saving for companies that do enterprise-level advertising.
Unlimited Accounts Per Client
Some marketing reporting tools like AgencyAnalytics tie the number of accounts you can connect in the tool to higher pricing tiers. So if you're an agency that wants to connect hundreds of Google Ad accounts to your reporting tool and keep adding more as you grow, you'll have to pay accordingly.
In contrast, TapClicks supports as many campaigns as you need, so users are not penalized with rising costs as their client base and marketing needs grow.
To check out our full article on the differences between AgencyAnalytics and TapClicks, click here.
Automating Dashboard and WidgetCustomization
Let's say an agency is managing 20 Google Ads dashboards for a variety of clients and has identified a new metric they want to report for all clients. To update their Google Ads dashboards, most reporting tools in the market require you to go into each dashboard to make the update.
In contrast, with TapClicks, you can make a single update to your dashboard template and have the changes reflected across all live campaign dashboards automatically.
TapClicks Report Studio: Automating Client Reports and White Labeling
TapClicks offers a suite of professionally designed reporting templates. Similar to the functionality of our dashboards, the templates are white-label, so they are easily customized to your branding (whether that's yours or your customer's).

Automating Reports Delivery
Manually creating and sending reports is one of the most time-intensive tasks in an agency, sometimes requiring hundreds of hours a month.
TapReports (TapClicks' reporting feature) can give your marketing team all that time back by automating report delivery:
- At any frequency you prefer (daily, weekly, monthly).
- In the recipient's preferred format.
- Branded to the recipient's company.
- Segmented by groups and relevant stakeholders.
Reports can also be triggered by metricsor milestones, too. This means decision-makers and busy executives are only involved when necessary.
Last Minute Reports

Most agency reports are built manually and are therefore time-intensive to make. The account manager or analyst has to get data from each marketing platform on which the agency is running campaigns for this client. They have to analyze that data and combine or manipulate it into charts and graphs. Then they have to arrange those visuals in a report and make it all look good and on-brand.
Since TapClicks is directly connected to your marketing platforms, you can insert data and visuals into reports extremely quickly.
If you want to place a graph of total ad spend overtime on a page, you can do it in a few clicks. There are no intermediate steps for downloading data from an ad platform, creating the graph in Excel, and pasting it on a slide.
This means it's easy for the team to build ad-hoc last-minute reports for clients because building them in TapClicks takes a fraction of the time as normal.
Examples of TapClicks' Customizable Dashboard Templates for Google Ads
Let's walk through a few examples of common types of charts and visuals (widgets) that TapClicks users can use for Google Ads Dashboards.
Google Ads: KPIPerformance
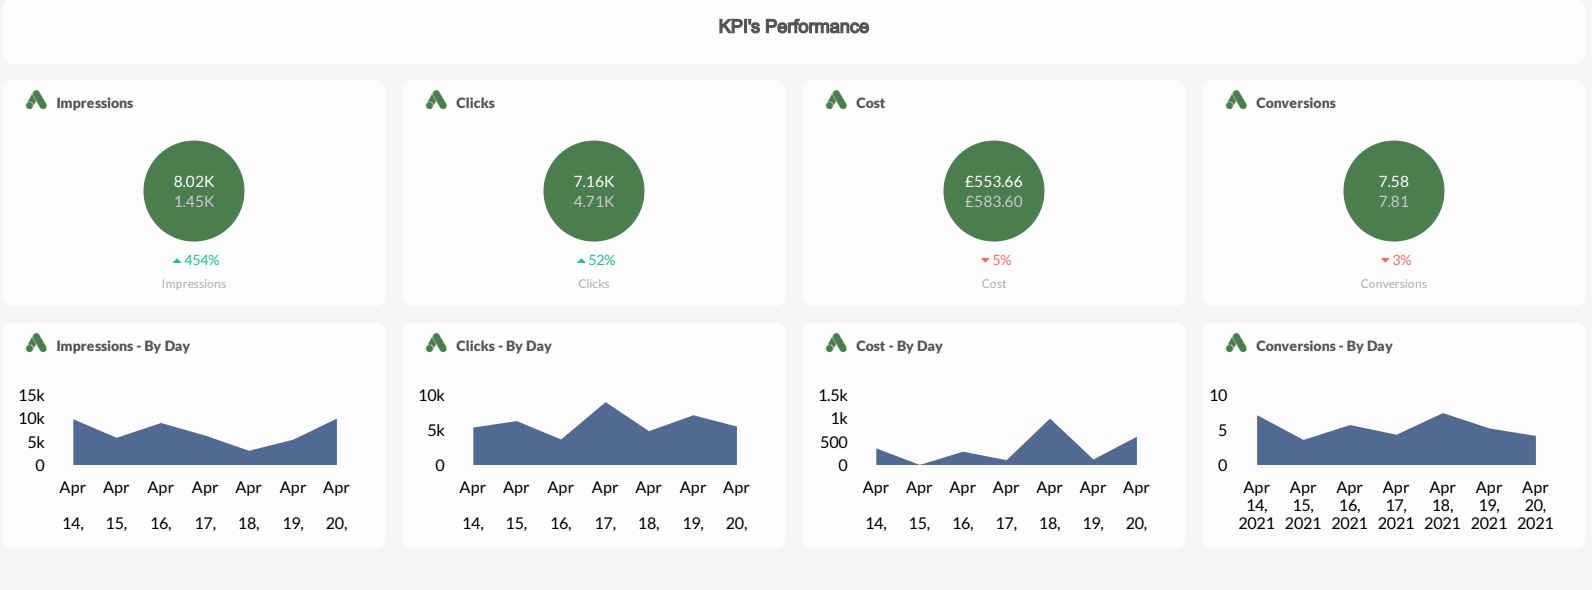
This is an example of some of the standard visualizations that TapClicks offers. These are useful to provide a quick overview of how a campaign is progressing with metrics like total number of clicks, impressions, conversion value, etc.
Google Ads: Performance Trends

The use of both line and bar graphs to show the relationship of two metricsover a 7 day period enables you to pinpoint exactly when a campaign performancebegan to trend up or down, and when campaign spend was optimized.
If you viewed these metricsseparately, you could conclude that the day with the highest conversion ratewas the best performing day. But when you add cost per click, the metricsbecome more insightful because days with a lower conversion ratebut also a lower cost per conversion are clearly a better return on investmentfor the campaign.
By combining metricstogether in one visualization, you can use your data to tell more compelling stories to stakeholders, and gain deeper insights.
Google Ads: Brand Campaign Performance
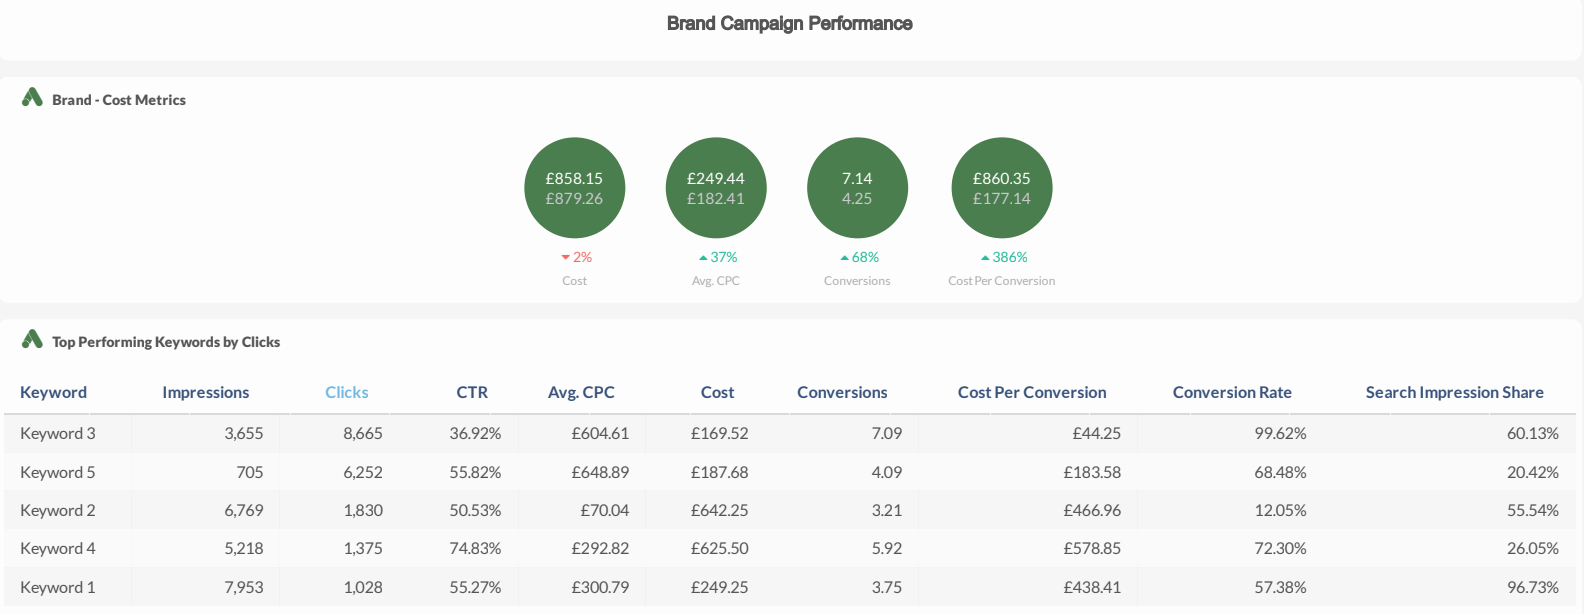
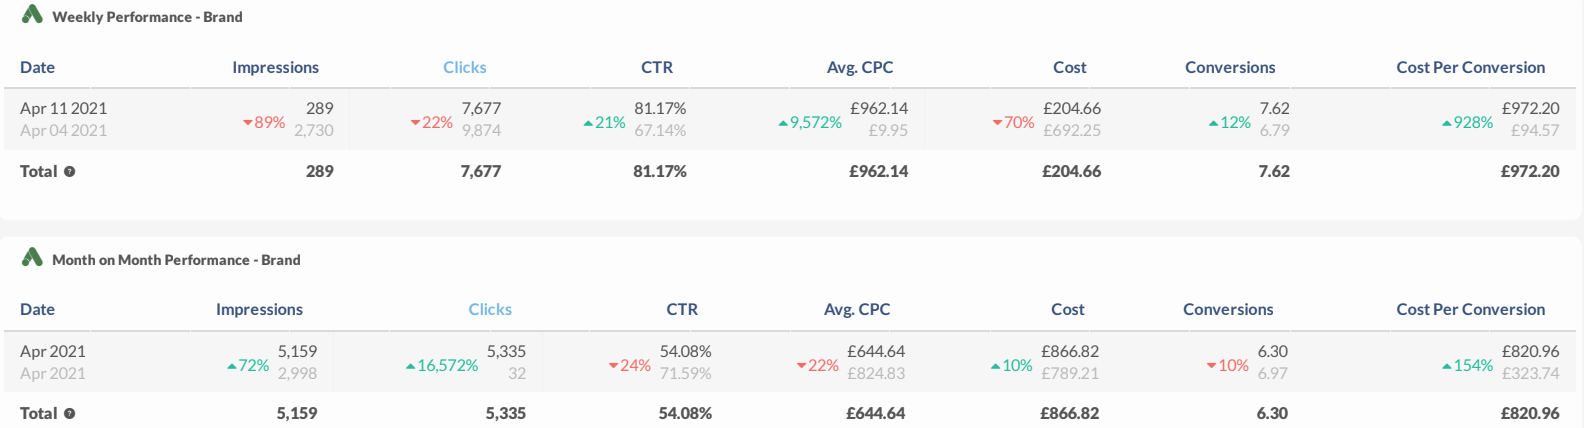
The brand campaign template shows you how data can be segmented by different brand campaigns. This is especially useful for agencies wanting to take stock of their performance across a number of brand accounts.
As you can see, it begins with overview metrics visualized at the top and then breaks down keyword performance by CPM, click-through rate, conversions, etc. This helps to focus your research for future campaigns.
TapClicks' Marketing Operation platform allows you to pause underperforming Google Ads dashboards and increase spending in high-performing dashboards, right within the platform itself.
This gives you the data and control you need to make better campaign decisions in real-time.
Google Ads: Generic Campaign Performance

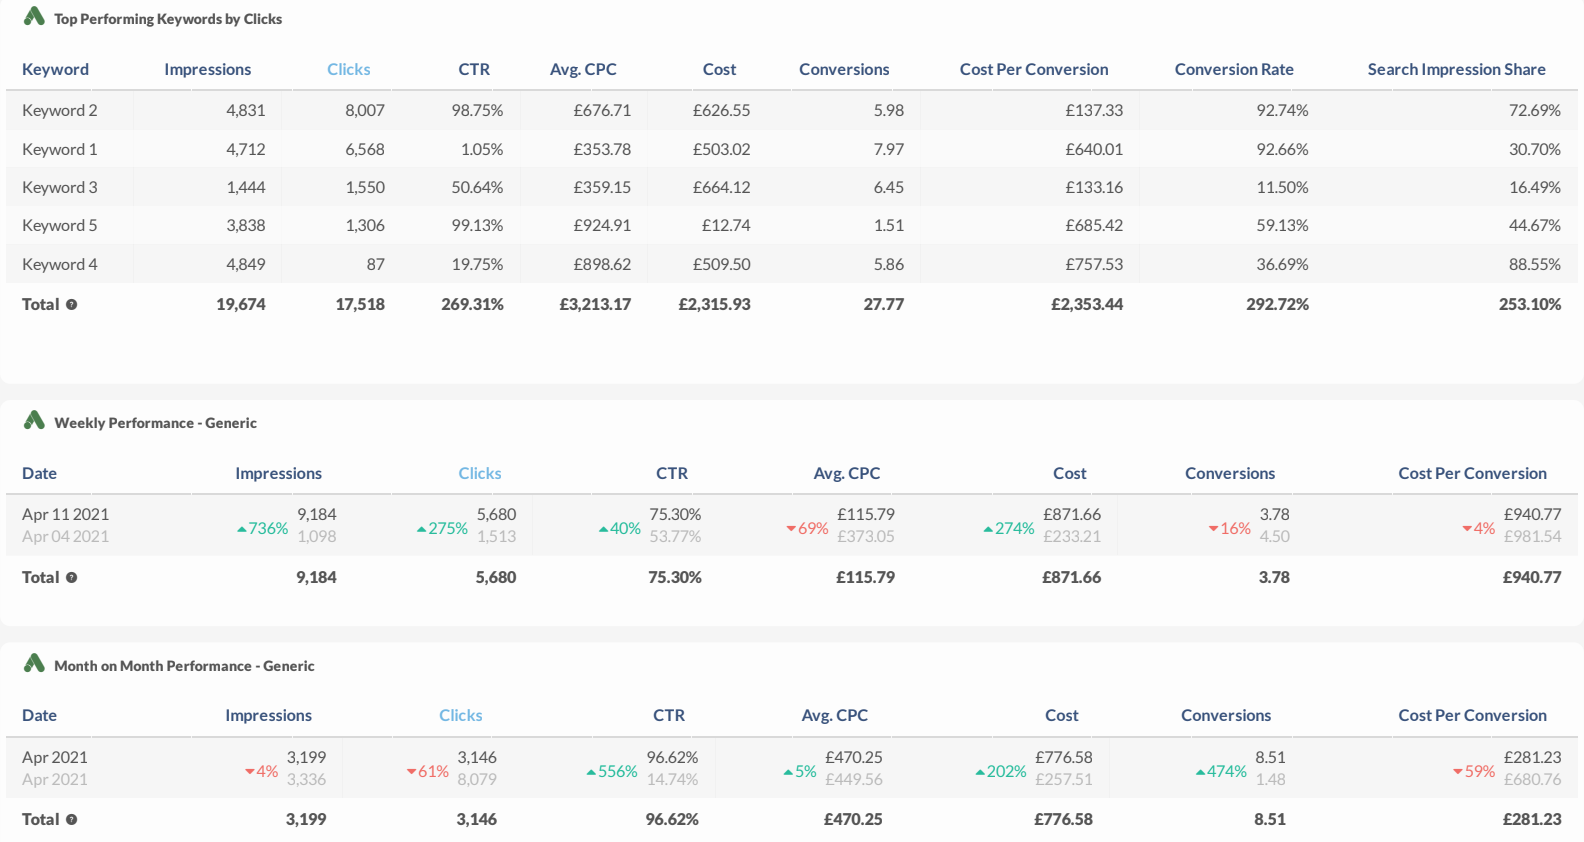
Generic Campaign Performance breaks down keyword performance across all live dashboards with metrics like Clicks, Avg. CPC, Search Impression Share, etc. This way you can see which keywords you should prioritize for future campaigns.
As we said before, if you need to report on a new insight, you can customize the template in minutes and the changes will be reflected across all dashboards at once.
Google Ads: Overall Campaign Performance
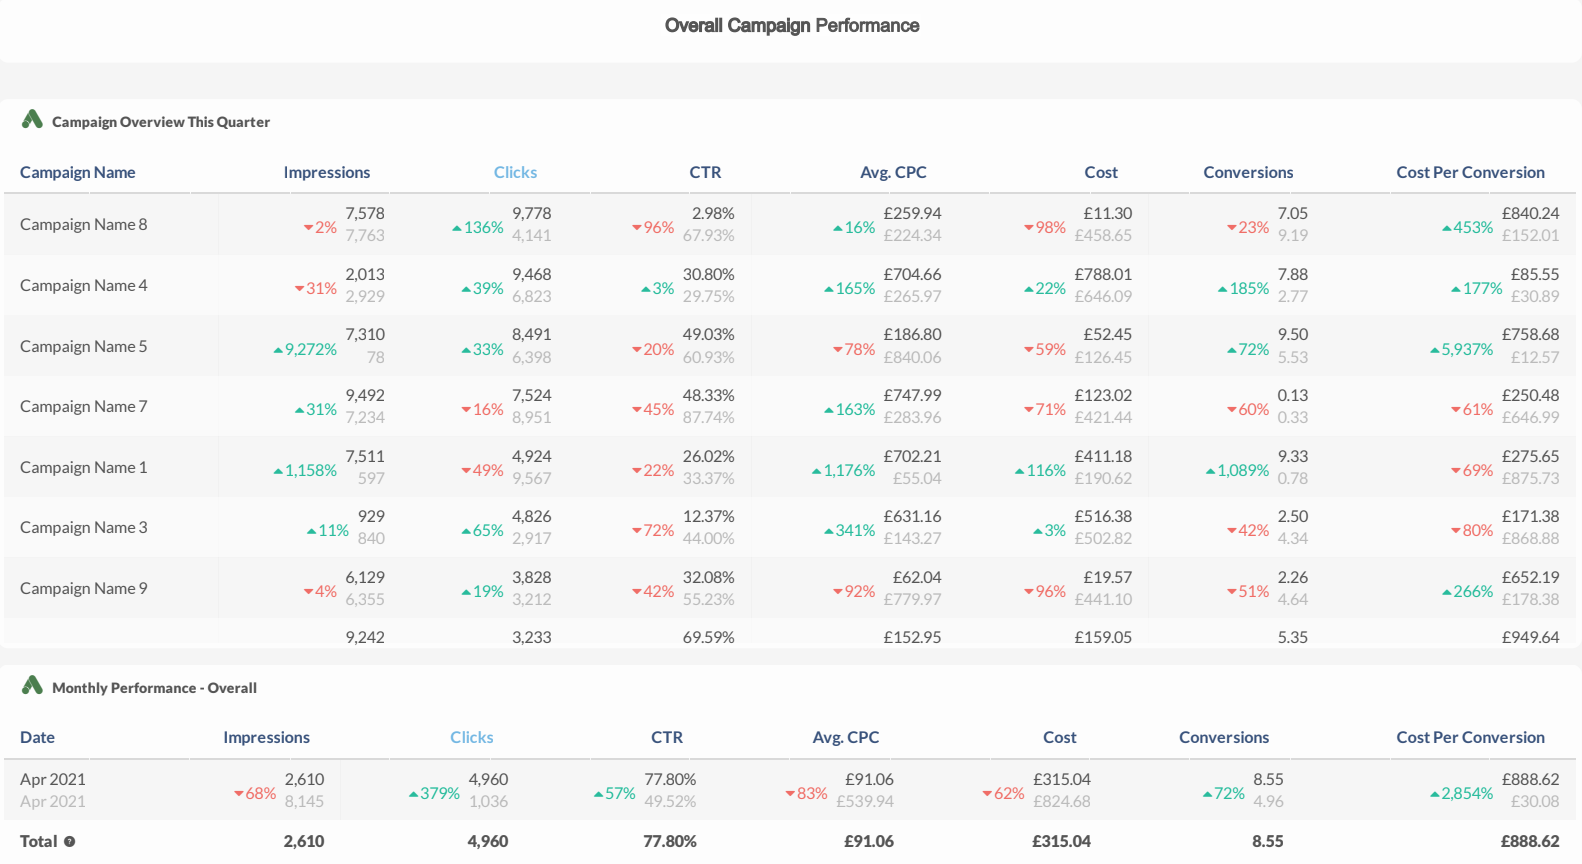
This widget shows you all campaigns for the quarter in a spreadsheet format so you can see which performed better, the metrics that were responsible for its success or failure, and how they contributed to your overall online marketing spend.
TapClicks customers appreciate the benefit of viewing combined campaign data because it allows them to make data-driven decisions for all future marketing.
Additional Feature: Google AdsPush Integration
Another useful feature is TapClicks' Google Ads push integration.
With this feature, campaign Ad Ops can launch Google Ads campaigns from directly within TapClicks. This further reduces the number of platforms you need to use to execute a marketing campaign.
While this feature is only available for Google Ads, Google AdManager, and a generic Webhook that can be connected to other tools, the equivalent push integrations for Facebook Ads and other top channels will soon be available.
Want to see how easy it is to build Google Ads dashboards in TapClicks and prove the return on investment of your marketing efforts to all of your clients? Try our free 14-day trial.