
What Is Enterprise Reporting and How It Drives Smarter Strategies
Enterprise reporting gives you a way to turn complex business data into reports. It connects numbers from across departments and systems to help you track goals, measure progress, and take action faster. Everything stays visible, organized, and aligned with real business needs.
Understanding what enterprise reporting is shows how structured reporting supports better planning. You don’t need to rely on outdated spreadsheets or scattered tools. A connected system lets you stay focused, act quickly, and build strategies backed by real data.
In this article, you’ll learn how enterprise reporting works, how to choose enterprise reporting tools, and why it leads to smarter results.
Turn raw data into decisions that move your business forward. Book a demo with TapClicks!
What is Enterprise Reporting?
Enterprise reporting lets you turn raw numbers into clear reports that support real action. It pulls business data from across departments, systems, and platforms into one place. With everything connected, you can create reports that focus on progress, results, and measurable outcomes.
A proper setup starts with a clean, unified data set. That foundation helps reduce time spent switching between tools or searching for missing numbers. You can track business performance in real time and stay focused on the goals that matter most. When reports reflect current data, decisions move faster.
Some reports follow a schedule. Others are built as ad hoc reports for a specific event or request. You can measure marketing efforts, compare results across multiple channels, and look at patterns that affect customer retention.
What are the Benefits of Enterprise Reporting?
Clear reporting helps you make better choices, stay focused on priorities, and move faster when things change. Each report gives you more than numbers. It shows patterns, supports decisions, and helps the entire team stay aligned.
The benefits below explain how enterprise reporting leads to smarter strategies and stronger performance across the business.
Real-Time Decision-Making Support
Enterprise reporting supports fast, confident decisions. Reports update with relevant data from across systems, so you act on what’s current, not outdated. Everything loads into one platform, keeping your attention on what matters now.
A survey by Deloitte found that 62% of small businesses rely on real-time data to manage and improve decision-making. With up-to-date information, key decision makers react quickly and move forward with fewer delays.
You can improve resource allocation by focusing effort where performance dips or results stall. A unified data set gives your team one source of truth. No time is lost switching between dashboards or chasing updates.
Live reporting builds trust in numbers. You spend less time validating data and more time taking action.
Cross-Department Alignment
Reporting keeps every team on the same page. With a shared system, sales, marketing, finance, and operations follow the same metrics. No one needs to dig through files or ask for updates.
McKinsey says that companies with tight alignment see 30% better results compared to competitors. When teams focus on shared goals, they avoid duplication and improve execution.
Reports help leaders track performance across teams without logging into five different tools. Every group sees how its work affects the outcome.
Alignment removes barriers. Projects move faster, teams talk more, and decisions support the bigger picture.
Time-Saving Automation
Manual reporting burns hours on low-value tasks. You can deliver reports automatically, so the team spends more time acting on results and less time formatting slides.
According to Forbes, 80% of data scientists’ time accounts for data preparation. That number drops when reports run on a schedule.
It’s easy to create customized reports for each team. Everyone sees only the numbers that matter. Cleaner layouts lead to clearer decisions.
Routine tasks vanish, and employee productivity improves.
Smarter Strategy Development
Strategy needs data to work. Enterprise reporting offers a full, comprehensive view of what’s happening. Reports show trends, compare progress, and give facts that support action.
You can gain marketing insights that shape next steps. Teams optimize processes by spotting what slows things down. Time and energy go where they matter most.
Reports built for direction bring actionable insights to the front. Each one pushes the strategy forward with clarity and speed.
What Makes Enterprise Reporting Different from Traditional Reporting?
Traditional methods focus on static reports and disconnected tools. Enterprise reporting takes a broader, more dynamic approach built for scale and speed. The difference becomes clear when you compare how each one handles data, access, and outcomes.
Unify your reporting process across campaigns and regions. Book a demo with TapClicks now!
Standard vs. Enterprise Reporting
Standard reporting depends on static files, manual exports, and siloed processes. Most teams use spreadsheets or disconnected tools to gather information, then spend hours formatting charts. Each department builds reports differently, which creates confusion and slows down decisions.
Enterprise reporting solves those problems with a connected system. You can analyze data from a single platform that updates automatically. Everyone works with the same information, and that reduces errors and improves clarity.
Different users need different views. Enterprise platforms support different stakeholders by customizing access without extra work. Executives, managers, and analysts all see what’s relevant to their role.
Reporting capabilities also support automation, role-based access, and real-time visibility. For enterprise companies, that difference improves speed, accuracy, and decision-making across the business.
Enterprise Reporting vs. Business Intelligence (BI)
Enterprise reporting and business intelligence software solutions support better decisions, but each one serves a different purpose. Enterprise reporting focuses on presenting data that reflects current activity. BI digs into patterns, builds forecasts, and supports long-term planning.
Enterprise reporting helps you act on real-time performance. Every report tracks progress, identifies trends, and connects directly to operational goals. You can also distribute reports automatically across teams without editing or reformatting.
BI systems go deeper. Analysts use BI tools to uncover root causes, model scenarios, and explore relationships across large datasets. These insights support broader strategies but often take longer to produce.
Enterprise reporting delivers meaningful insights that support action today. A well-structured platform will also provide actionable insights tied to budgets, campaigns, and timelines. Those outputs help teams align with daily goals and move projects forward.
How Enterprise Reporting Actually Works
Enterprise reporting follows a process that turns raw information into clear direction. Each step supports better visibility, faster action, and smarter alignment with goals.
-
Collect data from business tools – CRM systems, ERPs, ad platforms, and financial apps provide essential inputs. Pulling from these sources captures accurate customer data and performance numbers across departments.
-
Clean and normalize the data – Standard formats support strong data management. Normalization fixes inconsistencies and creates input for reporting.
-
Aggregate and visualize the data – Dashboards group metrics into clear visuals. Thoughtful report design helps teams connect the data to daily work and long-term company goals.
-
Share insights with stakeholders – You can share reports directly with managers, departments, or clients. Reports reach the right people at the right time without extra formatting.
A defined enterprise reporting strategy supports each step. When the structure works, the insights do too.
Leading enterprise reporting solutions improve data discovery by helping users explore trends, spot gaps, and surface new opportunities. The entire process turns complex inputs into reports people can use with confidence.
Types of Enterprise Reports
Enterprise reporting supports a range of business needs. Each report type has a specific role in tracking progress, improving operations, and reaching defined business goals. The list below outlines the most common types used across teams.
-
Strategic reports - High-level summaries used by executives to align direction and measure long-term growth. These reports often bring together performance metrics from multiple departments.
-
Operational reports - Day-to-day reporting that supports internal teams. These reports focus on process efficiency, resource use, and immediate decision-making across key functions.
-
Financial reports - Statements that organize financial data, budgets, forecasts, and spending across the business. These reports help finance teams maintain accountability and support company-wide planning.
-
Marketing and sales performance reports - Reports that track campaign outcomes, lead activity, sales data, and user engagement. Teams use these insights to adjust strategies and improve results. Clear visibility into customer behavior and engagement rate helps teams identify what works across each touchpoint.
Who Uses Enterprise Reporting Tools?
Enterprise reporting supports decision-making across the entire organization. These tools help people stay focused on results, manage performance, and connect data to action, such as:
-
Executives - Use reporting to align direction with results and communicate a cohesive narrative. Reports support planning and keep progress tied to strategic outcomes.
-
Finance and operations teams - Depend on an enterprise reporting system to track budgets, spending, and workflows. Data should stay accurate and current to support decisions tied to time and resources.
-
Marketing and sales teams - Monitor engagement, conversions, and revenue. Reports reveal trends in customer behavior and campaign effectiveness across multichannels.
-
Analysts and managers - Use enterprise reporting tools for faster data analysis and easier access to meaningful performance metrics.
Main Features to Look For in Modern Enterprise Reporting Software
Enterprise reporting needs more than templates or exports. You need tools that help your teams move fast, stay aligned, and make decisions with confidence, and every feature below supports that purpose.
Data Integration from Multiple Platforms
Reliable reporting starts with data that flows into one place. You need a platform that connects to your data sources, like CRM systems, finance tools, ad platforms, and more. When those connections work, you spend less time fixing errors and more time reviewing the numbers.
Switching between disconnected tools slows you down. Strong integrations bring your performance data together in one system, so your team focuses on analysis, not patchwork exports. Each team gets a clearer view of what’s happening without waiting for manual updates.
Many platforms claim integration, but only some deliver it well. You want real-time sync, consistent formatting, and clean access. That foundation keeps reports accurate and current across departments.
Custom Dashboards
Each team has different priorities. Your sales lead wants pipeline visibility. Your finance team watches expenses. Your marketing lead tracks leads and ad returns. Custom dashboards help business users focus on the key metrics that matter to their work.
Custom layouts let you build focused views. You don’t need to scroll past dozens of unrelated charts. You can create clean dashboards that help each role stay informed and take action without delay.
These views also support executives. You can track key performance indicators (KPIs) at the company level while giving departments their own reporting space. That separation keeps reports clean and lets teams focus on what they control.
You don’t need coding skills or developer help. The right system lets non-technical teams build and share what they need, right from the dashboard.
Automation and Scheduling
You don’t want to send the same report every day or remind teams to update metrics. Automation saves time by pushing reports to the right people on a schedule that fits your workflow.
You can send daily summaries to marketing, weekly updates to finance, and monthly performance reviews to leadership. The platform handles timing, and you spend less time managing files and more time using the results.
Automation also reduces errors. You don’t need to rebuild charts or track delivery by hand. Reports land in inboxes, dashboards refresh automatically, and decisions move forward.
End users always know when to expect updates. That rhythm builds trust and improves follow-through. With fewer delays, your team stays on track and aligned.
Good enterprise reporting software treats automation as a default, not an upgrade. It gives you a process that runs in the background and keeps the data flowing.
Permissions and Access Control
Strong permissions help you limit access, protect data, and keep reports relevant. That means fewer distractions and safer sharing.
You can assign access by team, role, or project. Your operations lead gets detailed numbers, the marketing manager sees campaign metrics, and key stakeholders get full visibility without sifting through irrelevant results.
Access settings also support data security. You don’t need to split files manually or worry about who sees what. Each report adjusts to the viewer’s role, so sensitive data stays protected.
You can update permissions as teams shift or projects evolve. No coding or admin request needed. You make the changes directly inside the tool.
Permissions matter when reports scale. Enterprise reporting software helps you manage access without creating bottlenecks. When people see only what they need, your reports stay clean, focused, and useful.
White-Labeling
Your reports should reflect your brand, not the software behind it. White-labeling lets you add logos, change colors, and apply custom layouts to every report you send. That helps your reports look polished and familiar.
Agencies often use white-labeling to present client results. Internal teams apply it to match department standards or company themes. These changes don’t require designers or developers. Non-technical users handle the edits on their own.
When reports match your visual identity, people read them more closely. They trust the content and connect it to your team’s work. That makes conversations easier and helps stakeholders focus on results.
You don’t need to build templates in Word or hire outside help. Strong platforms offer design tools inside the dashboard.
White-labeling turns raw data into a branded, professional report. Your team looks sharp, your results stay clear, and every document supports your brand’s message.
Predictive Insights and Trend Spotting
Knowing what happened matters. But knowing what may happen next can make or break a strategy. Predictive features help you spot changes before they affect outcomes. You don’t need to wait for monthly results to make smart calls.
You can use predictive analytics to surface patterns, track campaign fatigue, or notice when engagement drops. These signals help your team pivot early, adjust tactics, or reassign budget.
Reports that include forward-looking analysis save time and reduce risk. Rather than asking “What went wrong?” you start asking “What should we do next?”
You don’t need a data science team. The right platform gives you tools that explain trends in clear language. That means more people across the business can use trends to support their goals.
When you combine past results with future signals, you build a stronger reporting process. Enterprise reporting software that offers predictive tools gives you the power to plan ahead, not just report what has already happened.
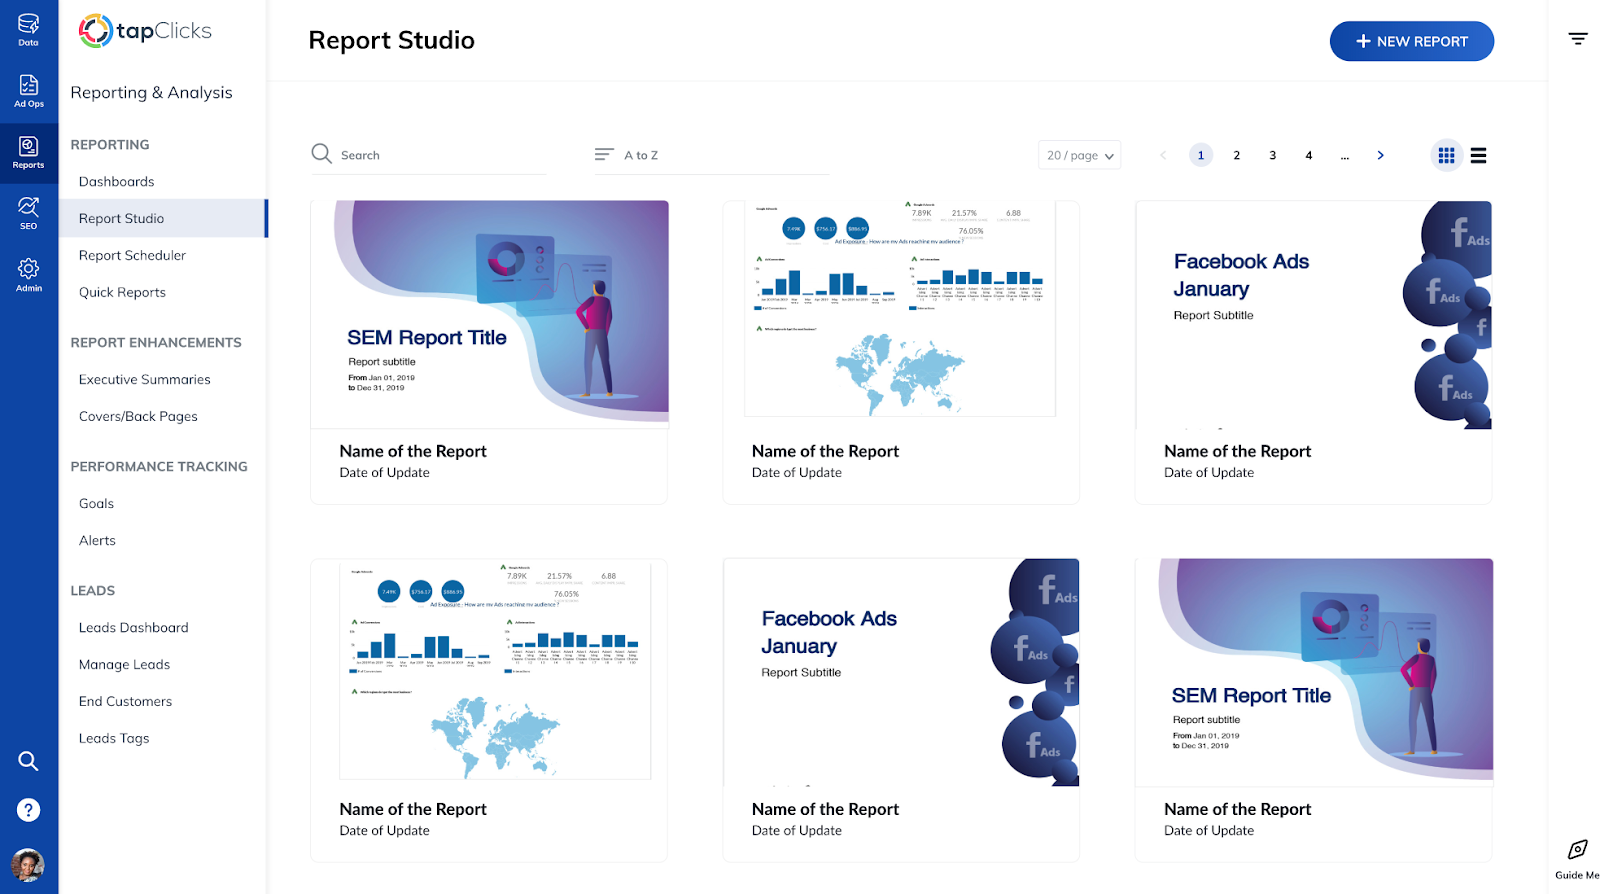
See How Your Business Operations Are Doing Using Data Visualization With TapClicks

Enterprise teams usually waste hours juggling spreadsheets, slides, and disconnected platforms. TapClicks replaces fragmented reporting with a solution built that allows you to get real-time visibility, faster execution, and more meaningful outcomes.
Use TapClicks to improve your enterprise reporting in six key ways:
-
Unified dashboard - Track all campaigns, departments, and platforms from one real-time view.
-
Connected data sources - Pull in data from over 250 platforms using instant-on and smart connectors.
-
Interactive data visualizations - Highlight key metrics and performance trends with customizable charts and graphs.
-
Scheduled delivery - Set recurring reports that reduce time spent on repetitive tasks and help share reports consistently.
-
Role-based access - Give filtered access to business users, non-technical users, and clients with full control over visibility.
-
Real-time alerts - Flag underperformance early. Help you adjust quickly and align with broader company goals.
TapClicks lets you replace manual work with automation, fragmented dashboards with unified reporting, and stale PDFs with live updates. Visualize progress, simplify analysis, and make every decision smarter.
Use real-time dashboards to uncover trends and adjust fast. Book a demo with TapClicks now!
FAQs About What is Enterprise Reporting
What is the meaning of enterprise reporting?
Enterprise reporting means collecting, organizing, and presenting business data to support decisions at the organization-wide level. It creates a structured view across departments, unlike most reporting tools that only focus on isolated data.
What is enterprise-level reporting?
Enterprise-level reporting refers to large-scale reporting systems that consolidate data across all functions of a company. It supports strategic planning by turning complex data into clear enterprise stories for decision makers.
What is considered enterprise data?
Enterprise data includes any structured or unstructured data generated across departments such as finance, sales, marketing, operations, and customer service.
How much does an enterprise reporting cost?
Enterprise reporting costs vary based on features, users, and data volume. Pricing usually starts at a few hundred dollars per month and scales to thousands for larger teams with advanced needs.
Why is enterprise reporting important?
Enterprise reporting is important because it helps teams track business performance, improve planning, and make faster, data-driven decisions across departments.