Supermetrics vs Datorama: Which Should You Choose?
Marketing teams aren’t short on data. They’re dealing with numbers from dozens of platforms, and that usually means spending hours each week gathering data and putting reports together.
That’s why comparisons like Supermetrics vs Datorama come up so often. Both tools promise to make reporting easier, but they go about it in very different ways.
In this guide, you’ll see what each platform offers, where they fall short, and what to look for before choosing a marketing tool.
Want to cut down time spent on reporting? Book a TapClicks demo and see how it can work.
TL;DR
-
Supermetrics and Datorama take different approaches to data integration, reporting, and analytics.
-
Supermetrics sends data to tools such as Google Sheets, dashboards, and data warehouses.
-
Datorama stores and analyzes data inside its platform with built-in dashboards in Salesforce.
-
Both tools still require manual reporting work or technical setup.
-
TapClicks connects data, automates reports, and delivers AI-generated insights and presentations in one platform.
What Is Supermetrics?
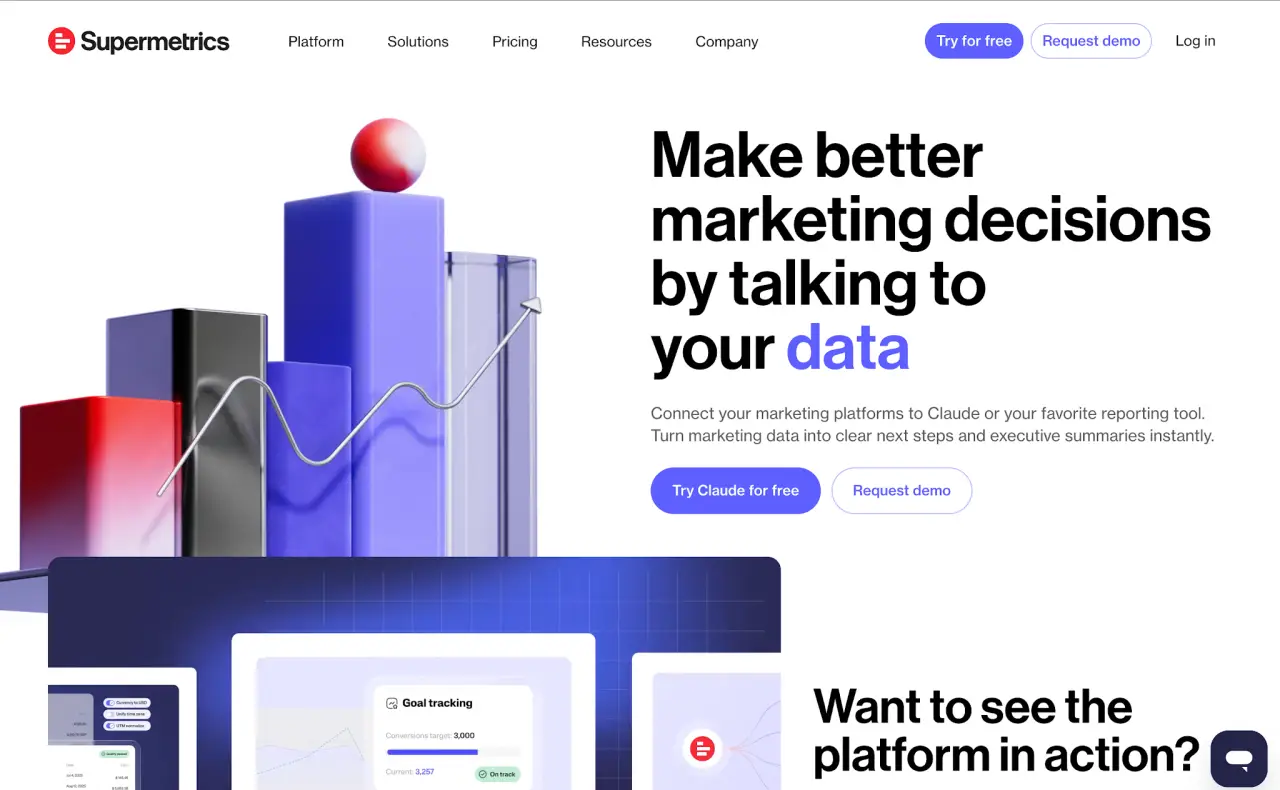
Image source: supermetrics.com
Supermetrics is a marketing intelligence platform that focuses on data integration and reporting. It helps teams connect data from tools like Google Analytics, Facebook Ads, Shopify, and HubSpot.
You can choose your data sources, pick the metrics you need, and send that data into Power BI, Google Sheets, Excel, Looker Studio, or a data warehouse. From there, teams analyze performance and create reports using tools they already know.
Key Features of Supermetrics
-
Prebuilt data connectors for major advertising platforms and analytics tools
-
CSV, Excel, application programming interface (API), and custom imports for offline or unsupported data sources
-
No-code tools to clean and organize raw data
-
Data blending to combine multiple sources
-
Naming rules and business logic for consistent reporting
-
Custom metrics and dimensions
-
Data quality alerts for tracking issues and anomalies
-
Storage and replay for historical data
-
Built-in dashboards and Data Explorer for quick data analysis
When to Use Supermetrics
Supermetrics is commonly used by marketers and analysts who rely on spreadsheets or external dashboards for reporting. They connect data sources and send that data into tools like Google Sheets, Excel, or Looker Studio.
It’s often used by marketing agencies managing multiple clients and campaigns. In-house marketers who work daily in spreadsheet-based reporting setups also use it to keep their data updated.
Analysts who work with connector-based data pipelines also use Supermetrics to move data into their reporting environment.
Strengths of Supermetrics
Supermetrics connects multiple data sources and sends data into the tools marketers and analysts already use. It supports spreadsheets, business intelligence (BI) tools, and data warehouses as destinations.
It also includes options like naming rules, transformations, and custom metrics, which help keep reporting consistent when working with data from multiple channels.
Drawbacks of Supermetrics
Supermetrics focuses on data extraction and preparation. Marketing teams still rely on separate tools to design reports, write summaries, and share results.
Costs may increase as more data connections are added or when access to additional features requires higher pricing plans. Connector limits, such as restricted data ranges or missing fields, can also affect reporting.
When issues occur, resolving connector problems can take time. Marketers may need to review data before sharing reports, especially when combining multiple sources.
Supermetrics Pricing Structure
Supermetrics offers different pricing plans based on data access, refresh frequency, and account limits. Here are the available plans:
-
Starter ($55/month): Covers 1 user and allows 3 accounts per data source. Data refreshes run weekly.
-
Growth ($222/month): Supports 2 users and allows up to 7 accounts per data source. Data updates run daily.
-
Enterprise (custom pricing): Provides custom user limits and account access. Data refreshes run on demand.
All plans include dashboards, single sign-on, and no data volume fees. Pricing increases as you connect more data sources or need more frequent updates.
What Is Datorama?
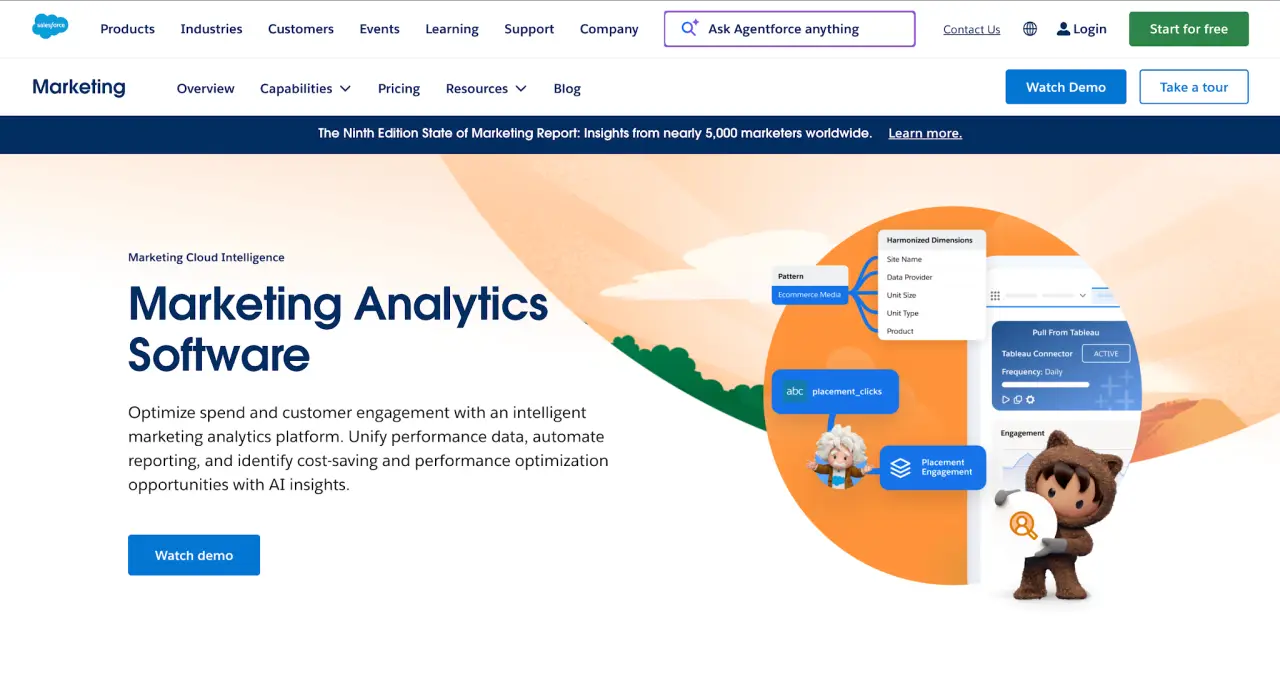
Image source: salesforce.com
Datorama, now called Marketing Cloud Intelligence, is Salesforce’s platform for marketing data integration and analytics. It helps companies bring campaign, customer, and business data into a shared system for reporting.
Organizations use this comprehensive marketing intelligence platform to review campaign performance, track spend, and analyze results using data from multiple systems.
Key Features of Datorama
-
170+ data source integrations for advertising, commerce, customer relationship management (CRM), and database platforms
-
Universal Connector for importing data from files, folders, or systems without APIs
-
Automated data model for organizing metrics, naming, and taxonomy
-
Data harmonization tools for standardizing marketing data
-
Dashboards that use drag-and-drop widgets for data visualization
-
Einstein Marketing Insights for identifying trends in campaign performance
-
Media planning and pacing tools
-
Export options for Tableau, Snowflake, PostgreSQL, and Google BigQuery
-
Slack integration for sharing updates
-
Connections with Salesforce products like Data Cloud and Marketing Cloud
When to Use Datorama
Datorama is used in organizations that manage large volumes of marketing and customer data. It’s common in companies already using Salesforce products, where reporting connects marketing performance with sales and customer activity.
It’s also used in setups where teams need a structured data model to organize and analyze data from multiple systems.
Strengths of Datorama
Datorama organizes large data sets into a defined structure using its data model. This helps standardize metrics, naming, and reporting when data comes from multiple systems.
Its integration with Salesforce products allows companies to connect campaign performance with customer data, sales activity, and revenue reporting.
Einstein Marketing Insights analyzes performance data and highlights patterns related to engagement, spend, and campaign results.
Drawbacks of Datorama
Initial setup can require technical expertise, especially when configuring data models and integrations. Organizations without dedicated data engineers may need additional support.
Tasks such as audience segmentation or troubleshooting may still involve SQL. This can make reporting more complex for non-technical users.
Managing integrations and reporting can also require ongoing effort when working with many data sources.
Datorama Pricing Structure
Salesforce provides transparent pricing information for Marketing Cloud Intelligence. Their plans include:
-
Marketing Intelligence: Starts at $10,000 per organization per month, billed annually
-
Marketing Cloud Intelligence+: Starts at $11,000 per organization per month, billed annually
Additional costs may apply for Data Cloud, Tableau licenses, or usage-based credits depending on the configuration.
Supermetrics and Datorama Feature Comparison
Here’s how Supermetrics and Datorama compare in core areas like data integration, reporting, and automation.
Data Integration
Supermetrics focuses on getting data out of different marketing data sources and sending it to tools you already use. You connect your accounts, choose fields, and move that data into spreadsheets, dashboards, or a data warehouse.
Datorama works more like a central data hub. It collects data from many systems, organizes it inside its own structure, and prepares it for deeper marketing analytics inside the platform.
Data Transformation
With Supermetrics, you clean and adjust data before sending it out. You can rename fields, combine datasets, and create custom metrics using simple rules. Most of that happens before the data reaches your reporting tools.
Datorama organizes data inside its own model. It standardizes naming, formats, and structure so data teams and data analysts can work with consistent data sets. This approach focuses more on long-term data management than quick edits.
Reporting and Dashboards
Supermetrics depends on external reporting tools. You use platforms like Looker Studio or Excel to create dashboards and track performance.
Datorama includes its own dashboards with widgets for creative data visualization. Users can create dashboards directly in the platform and review performance without switching tools.
AI and Insights
Supermetrics connects your data to tools where you can run your own analysis. If you want AI insights, you rely on external platforms or add-ons.
Datorama includes Einstein Marketing Insights, which reviews campaign data and helps identify trends in performance, spend, and engagement.
Automation
Supermetrics automates data collection and updates. It keeps reports updated by sending fresh data into your dashboards on a schedule.
Datorama automates data organization and parts of reporting. It also includes features that track campaign pacing and performance inside the platform.
Ease of Use
Supermetrics feels more familiar to digital marketers who already use spreadsheets or dashboards. You connect your accounts, send data out, and continue working in your usual tools.
Datorama takes more effort during setup. It often requires technical skills to configure data models, integrations, and workflows, especially in larger environments.
Why Supermetrics and Datorama Aren’t the Best Choice for Most Marketers
Supermetrics sends data into your reporting tools, but it doesn’t finish the job. You still review data rows, write summaries, and prepare updates for clients or your sales team. That keeps marketing reporting dependent on manual work even after the data is ready.
Datorama organizes large datasets and offers advanced features, but it often requires hands-on setup and ongoing management. Data teams usually maintain the system, which can slow down marketers who need quick answers to manage campaigns.
Most teams don’t just want to extract data. They want a system that fixes fragmented data, keeps reporting consistent, and delivers insights they can share without rebuilding dashboards every time.
TapClicks brings that together in a single marketing platform. It unifies data, connects automated reporting with data visualization tools, and gives you a clean user interface to share results right away.
TapClicks: A Smarter Alternative to Supermetrics and Datorama
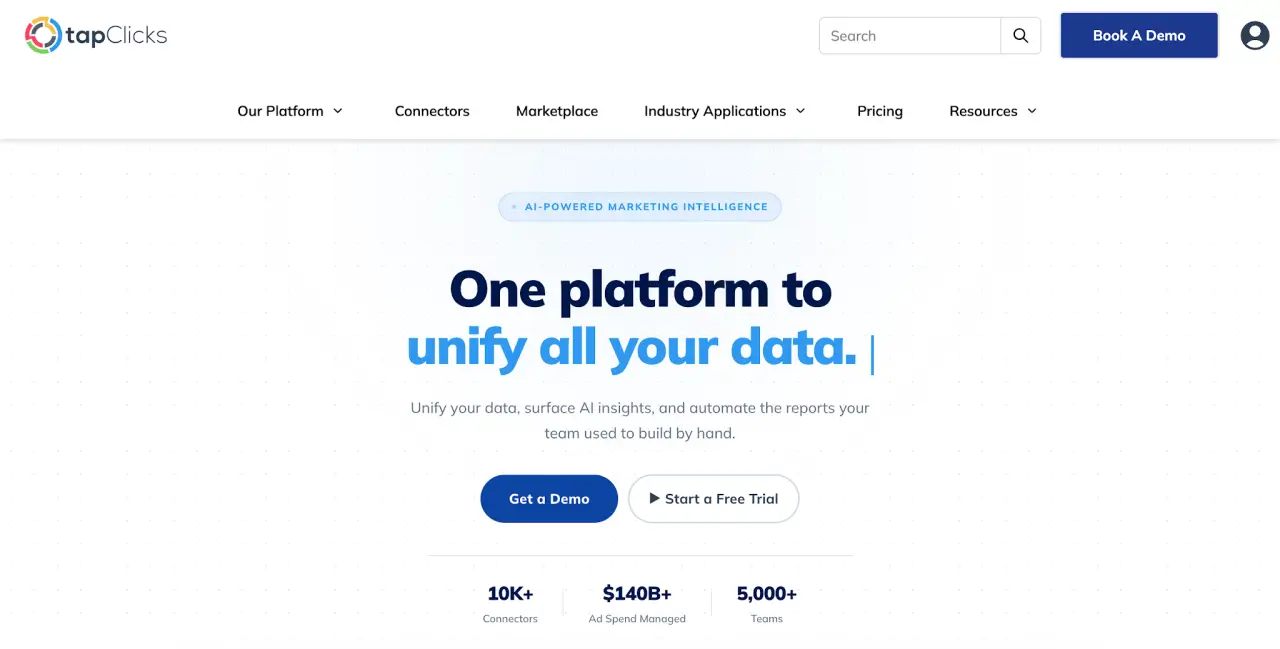
TapClicks gives you one platform to handle reporting from start to finish. You can pull data, build reports, and share insights without switching between tools like Google Data Studio or spreadsheets.
It brings your reporting process into a single system so you don’t have to piece everything together each month.
Connect and Organize Marketing Data Without Manual Work
TapClicks lets you pull data from 10,000+ sources, including ad platforms, web analytics tools, customer systems, and offline files like CSV or Excel.
You can use native connectors, SmartConnector, or APIs, depending on your setup.
TapData organizes that data into a structured system. It standardizes metrics, keeps naming consistent, and gives teams better data control when managing campaigns, clients, and reporting.
Create and Deliver Reports Without Rebuilding Them
TapClicks lets you create report templates and schedule them to send with updated data. You don’t have to rebuild reports for every cycle.
Report Studio uses a drag-and-drop editor, so you can build reports with charts, tables, and visuals without writing code. You can export reports as PDF or editable PowerPoint files and apply your own branding before sharing them.
Turn Performance Data Into Insights You Can Share
TapClicks doesn’t stop at dashboards. It helps you explain what’s happening in your campaigns.
-
SmartStory and SmartSlides turn report data into presentations with written summaries and visuals
-
SmartEmail sends short performance updates directly to stakeholders
-
SmartAnalytics shows performance trends so you can review results without leaving the platform
-
SmartSuite uses AI agents to flag performance changes and suggest next steps
AI Context lets you upload strategy documents, key performance indicators (KPI) definitions, and brand guidelines. That way, the platform uses your business context when generating insights and reporting outputs.
Switch to TapClicks for Unified Marketing Analytics
Supermetrics focuses on moving data into tools you already use. Datorama focuses on enterprise reporting within the Salesforce ecosystem. Both solve part of the problem, but they don’t cover the full reporting process from data to delivery.
TapClicks brings your data sources, reporting, and insights into one system. It gives marketers a strong data foundation for consistent reporting, along with a user-friendly interface that makes it easier to review and share results.
Your team can manage campaigns and marketing efforts without rebuilding reports each cycle.
FAQs About Supermetrics vs Datorama
Who are Supermetrics competitors?
Supermetrics competes with Datorama and TapClicks. Both connect marketing data from platforms like Google Analytics and ad networks, but they approach reporting and analytics differently.
What is Datorama now called?
Datorama is now called Marketing Cloud Intelligence. Salesforce renamed it to reflect its role in reporting, analytics, and campaign performance within the Marketing Cloud.
Is Supermetrics an ETL tool?
Supermetrics is an extract, transform, and load (ETL) tool. It collects data from platforms, applies transformations like renaming fields or combining datasets, and sends that data into a data warehouse for reporting.