
How to Build an SEO Reporting Dashboard Clients Love
If you work on search engine optimization (SEO), you know the hardest part isn’t fixing technical issues or finding new keywords. It’s proving that your work drives results.
Most clients don’t have time (or knowledge) to dig through Google Search Console, so they rely on you to show favorable results.
A well-built SEO reporting dashboard does that in seconds. It highlights key metrics and shows exactly where performance is trending.
This guide will show you how to build a dashboard that answers client questions before they ask and gives them a clear view of their SEO performance.
What Is an SEO Reporting Dashboard?
An SEO reporting dashboard shows the key SEO metrics that explain a website’s performance. It brings organic traffic, keyword rankings, ranking position, and visibility trends into one place.
The dashboard focuses on metrics that help you determine top-performing pages and give a concise view of organic search performance.
SEO teams use these dashboards to track performance and show how SEO efforts affect key results.
If the dashboard reveals a drop in keyword rankings or organic traffic, you can adjust your strategy before the issue affects your SEO campaign.
What Should an SEO Dashboard Include?
Your SEO reporting dashboard needs to focus on the metrics that show how search contributes to performance.
These are the elements your dashboard should include.
-
Organic search results: Track the volume of SEO traffic. You can review traffic trends and link shifts to updates on the site.
-
Keyword position: Shows where key queries appear in search results. You can track rankings and see which pages gain or lose search visibility.
-
Landing page performance data: Highlights the pages that attract visitors from search. You can find pages that need content updates or technical fixes.
-
Engagement metrics: Shows how visitors interact with each page. Low engagement can point to weak relevance or unclear page structure.
-
Traffic sources: Display the channels that drive traffic to the site. You can compare organic search to Google Ads, social platforms, or other marketing channels.
-
Backlink profile: Lists referring domains that influence authority. You can monitor new links and catch link losses that affect performance.
-
Key performance indicators (KPIs): Connect actions to business goals, such as form submissions or purchases.
These items give your dashboard practical value. They help marketing agencies explain how SEO data supports business success and guide decisions based on up-to-date data.
4 Essential SEO Reporting Dashboards
A single dashboard can’t show how an SEO strategy performs across the site. Each view uncovers a different part of the story and helps you explain why performance changes.
These four dashboards give you a full picture of what drives your results.
1. Top Search Query Performance Dashboard
This dashboard groups pages by clicks and lists the queries that lead visitors to each page. You can see which queries match the topic of the page and which ones point to a mismatch in intent.
It also shows when multiple pages appear for the same query. This often means the content overlaps and needs separation.
Use this dashboard to decide where to revise titles or headings. You can also review search patterns and plan future content from the terms people use most often.
2. Technical SEO Dashboard
A technical SEO dashboard tracks indexation, crawl activity, and page rendering.
You can see which pages enter the index, which pages drop out, and which templates load poorly. These signals often appear before you notice shifts in rankings.
You can add data from site audits to track broken links, redirect loops, slow templates, and other structural issues.
This view helps you decide which pages require developer attention and which updates support stronger search visibility.
3. Landing Page Performance Dashboard
This dashboard shows how each landing page performs after a user arrives from a search. It brings ranking position, impressions, clicks, and on-page metrics together in one place.
Metrics such as bounce rate and time on page help you understand how visitors react to the content.
You can compare groups of pages, such as product pages, resource pages, or local SEO pages. These comparisons highlight which sections match visitor expectations and which ones need a cleaner layout.
4. Organic and Paid Search Comparison Dashboard
This dashboard reviews how organic search and paid campaigns interact. You can see where organic visibility reduces the reliance on paid keywords.
You can also see when Google Ads sends most of the traffic for a term that lacks organic coverage.
This view helps SEO agencies avoid overlapping efforts. You may find marketing keywords that receive high paid spend even though organic visibility is strong.
You may also find keywords where paid traffic dominates because organic content is weak or missing.
How to Create an SEO Reporting Dashboard in TapClicks
The four dashboards above define the views you need to monitor search performance. TapClicks converts these views into fully structured layouts through widgets, data profiles, and client filters.
Users build custom SEO dashboards from a blank canvas or start with an SEO dashboard template created by the TapClicks analytics team.
Agencies reuse these layouts and filter them for different clients to maintain consistent reporting across accounts.
Step #1: Select the Dashboard Creation Path
Open Reports and select Dashboards. The page lists your dashboards and any folders you’ve created. Select Add New and then Add New Dashboard.
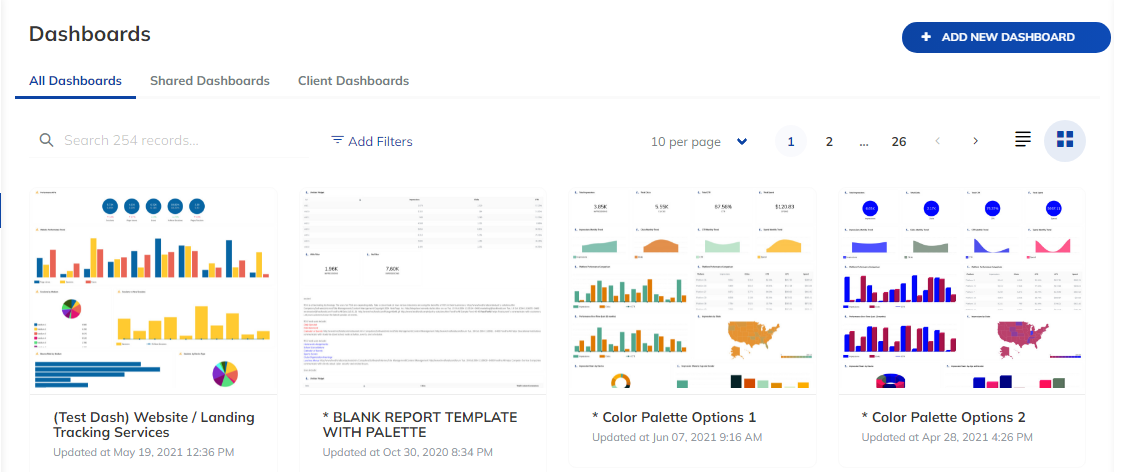
TapClicks then shows two creation modes. Freehand opens a blank canvas. Dashboard Template loads predefined layouts based on channel-specific KPIs.
These layouts act as SEO dashboard examples that you can copy and adapt to your own data.
Use the search field to find a specific template. You can refine the list with Add Filters. Select the template that aligns with the reporting structure you want.
Step #2: Configure Dashboard Settings
TapClicks opens the configuration panel. Enter a title for the dashboard.
Select one or more data profiles that contain SEO data, organic search traffic, keyword performance, or website traffic. You can remove a profile by selecting the X next to it.
Choose a business unit if your account manages several client groups. Turn on Demo Mode to preview the layout with sample values.
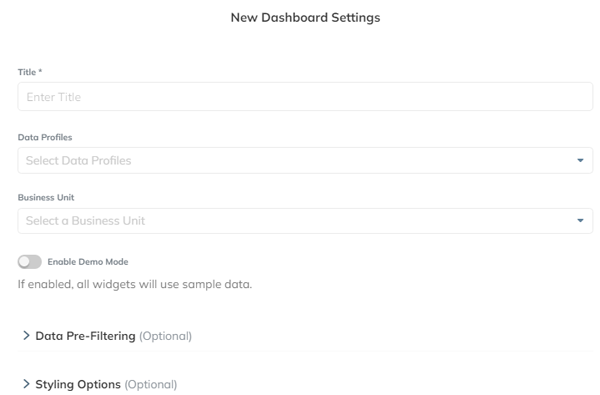
Use Data Pre-Filtering to show data for a single client while keeping one shared structure.
Open Styling Options to adjust fonts and color settings. These options support white-label dashboard requirements. Select Save to confirm these settings.
Step #3: Build and Arrange Widgets
TapClicks loads the dashboard canvas after you save the configuration. The widget library contains charts, tables, text blocks, and images.
Select a widget and connect it to a metric from your chosen data profiles.
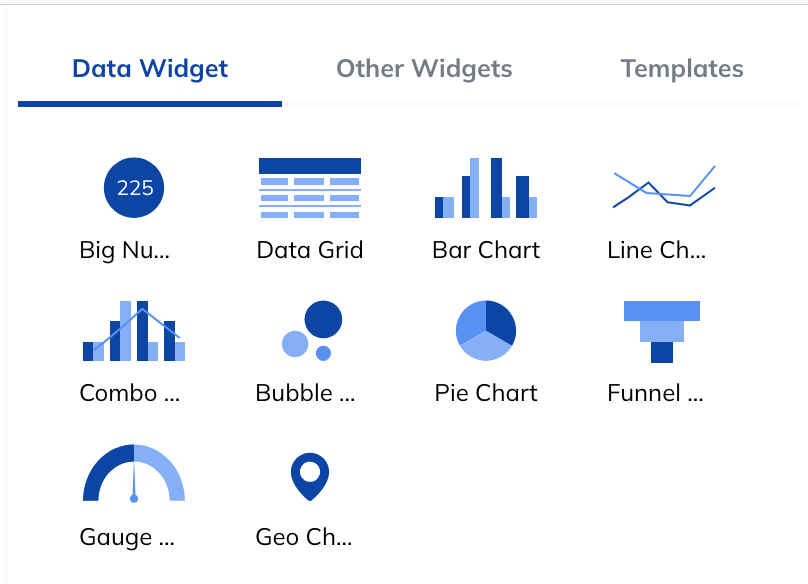
You can track organic search traffic, keyword performance, user behavior, and technical performance. TapClicks refreshes each widget when new data arrives.
Agencies often combine widgets into custom dashboards that monitor ranking position, landing page activity, and engagement signals. This structure keeps important SEO metrics in one place.
Step #4: Save and Prepare the Dashboard for Client Use
Select Save to store the dashboard. TapClicks then updates each widget as integrations refresh. Access controls restrict each viewer to the correct data profile.
Branding settings support a full white-label presentation, so the dashboard matches client design standards.
Use TapClicks to Deliver Branded and Accurate SEO Reporting
TapClicks centralizes SEO data and organizes it inside one workspace that clients can review.
The platform connects to Google Search Console and Google Analytics 4. It updates each SEO analytics dashboard with current records during every fetch.
Data Source Overview consolidates connected sources. It protects dashboard highlights by identifying entries that need review before teams share results.
Interactive dashboards display SEO metrics, website traffic trends, and user behavior on a single screen.
Agencies create dashboards that match their brand through custom logos, fonts, and colors. White-label SEO reports help clients understand their progress at a glance.
Report Scheduler sends recurring summaries, and Quick Reports support fast updates when clients need new data. EZ Login links also give clients access in just a few clicks.
TapClicks functions as a dependable marketing dashboard tool for agencies that manage SEO strategy-based reporting. It supports actionable insights by keeping performance data organized.
Book a demo with TapClicks to see how a complete reporting system supports your workflow!
FAQs About SEO Reporting Dashboard
What is an SEO dashboard?
An SEO dashboard displays search performance in one place. It tracks metrics such as organic traffic, keyword rankings, landing page activity, and user behavior.
Agencies use it to review marketing trends and explain results to clients without switching tools.
What is SEO reporting?
SEO reporting summarizes the impact of your search efforts. It highlights ranking gains, traffic movement, and conversions tied to organic search.
The goal is to show what changed and what contributed to those changes.
How to create an SEO dashboard?
You start by connecting your data sources, such as Google Search Console or Google Analytics 4. Then you choose a layout and add charts that track essential SEO metrics.
Some teams build dashboards in Google Data Studio or use a Looker Studio template. TapClicks streamlines this work and updates the data automatically.
What is the best SEO reporting tool?
The best tool depends on your workload and reporting needs. TapClicks works well for agencies that manage many clients and need white label dashboards.
It centralizes SEO data and reduces the manual work behind reporting.