Marketing Data Pipeline: What It Is and How It Can Help Enterprise-Level Marketing Agencies

For marketers running multiple campaigns for enterprise-level agencies or brands, a marketing data pipeline is essential. But what is it and why do you need one?
A marketing data pipeline is the process or system by which your marketing data moves from its sources to a central destination, often a data warehouse.
Data pipelines are important in marketing because marketers typically deal with a lot of data from different sources (web analytics, search ads, social ads, display ads, etc.). Without a process to move this disparate marketing data to a central location, marketing teams at large agencies or brands end up spending a lot of time gathering data, doing manual calculations and analysis, creating visuals, and building reports.
A data pipeline is meant to help speed up that process by at least placing all this marketing data in a single database, often organized in a consistent or systematic way. The team can then access this data when they want, analyze it, and build reports as they need.
But most marketing data pipeline solutions simply do the basics of pulling data sets from disparate marketing sources and moving them to a database or data lake. That's helpful and it does save some time, but it doesn't help with another huge timesuck: analyzing and reporting on that data.
A lot of this analysis and reporting work is repetitive for marketers (e.g. monthly marketing reports, updating numbers on the same campaigns as last month), so finding a marketing data pipeline tool that goes beyond just gathering data but one that can also automate the analysis and reporting process can be a huge time saver.
Our marketing data pipeline platform, TapClicks, does exactly this. Our solution handles the entire marketing data management lifecycle in one place, providing an automated central hub for all your marketing data from data collection to distribution.
Specifically, TapClicks automates the following:
- Connecting to all your marketing data sources along with sales and proprietary data (e.g. Amazon, CRM, etc.).
- Automating complex calculations as well as transformations, so your team doesn't have to do repetitive number crunching every week or every month.
- Providing a data warehouse facility where your data is stored centrally and can be pushed out to anywhere from there.
- Creating powerful marketing reports which are automatically updated with the latest data and distributed to clients and stakeholders.
In this post, we'll define what a marketing data pipeline is and why it is helpful for marketers. Then, we'll explain how TapClicks fulfills each of the 4 features above.
If you think TapClicks could work as a marketing data pipeline solution for your organization, you can try it free for 14-days or schedule a demo to learn more.
What is a Data Pipeline?
As we've mentioned above, in simple terms, a data pipeline is a process or series of actions which moves data from one place to another. Businesses use a data pipeline to collect data from several different sources and streamline it to a specific destination, for example, a data warehouse or data lake (e.g. Snowflake).

There can be many steps involved in the process, including the transformation of the raw data where it is cleaned to make it uniform (e.g. deleting excess columns, changing titles so they're the same across different data sets). This is where ETL tools (extract, transform, load) play a part in the pipeline, acting as connectors between data sources and data warehouses or BI (business intelligence) tools.
The data can also be transformed after it's reached its destination, which would effectively be switching the transform and load steps (ELT instead of ETL).
Businesses often choose open-source data pipelines (e.g. Bonobo and Metabase) as a low cost solution or have an on-premise system built if they have specific requirements. Both options can be complex to navigate which is why cloud platforms (such as TapClicks) are more popular.
How Data Pipelines Help Marketers
Marketing Pain Points
As we've said, marketers tend to handle a large amount of disparate data from all the different campaigns that are being run (e.g. social media, TV, radio, etc.) but also other types of data such as eCommerce (e.g. AWS) and sales data (e.g. CRM) that's relevant to their work.
To gather this amount of data from multiple sources without a solution such as an ETL tool is a hugely time-consuming process involving going into each platform and pulling the data manually (into Excel spreadsheets, for example). And this has to be done every week or month, or whenever a reporting period falls, for each campaign and client.
The data then needs to be transformed so that it is uniform before any kind of analytics can be done. To do this manually in spreadsheets or using a separate tool is tedious and takes up dozens or hundreds of hours of employee time.
Yet, despite this tedium, many marketing teams and agencies we've talked to over the years say their team spends dozens of hours doing this manual data collection and analysis step every month or even every week. This is an extremely inefficient use of employee time.
The Limitations of Most Marketing Pipelines
Data pipeline solutions, of course, are designed to help automate the gathering portion of this time drain. But not all data pipeline tools are the same, and many have limitations. For example, many data pipelines or ETL tools only connect to a limited set of marketing data sources. Tools like that give you little benefit as you would still need to manually collect data from some of your data sources separately.
Also, many data pipeline solutions push data out to a data warehouse (typically a database) that's separate from the marketing team's reporting and visualization toolset. Not only does this make the data process unnecessarily complex, it is often not marketer-friendly, requiring the marketing team to call on data scientists or database programmers whenever they need some data.
And, while ETL tools do transform data, they don't have the capability to do the complex calculations, analytics, and visualizations needed by marketers in order to create reports. That's all still done manually by the marketing team despite most of this analysis and reporting being repetitive. (For example, updating the same campaign's numbers every month.)

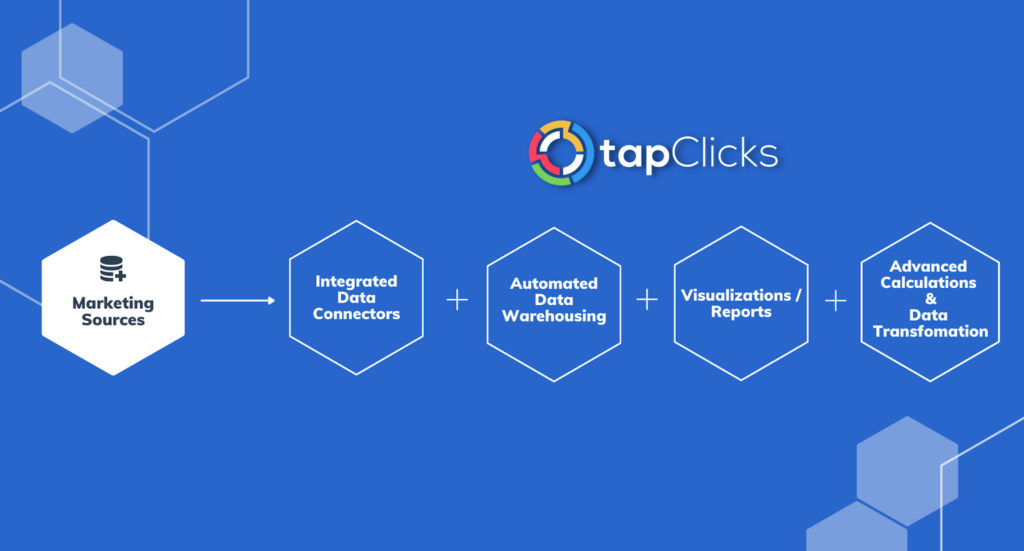
Our marketing pipeline solution, TapClicks, fulfills all of these functions in one tool by:
- Gathering data
- Automating repetitive calculations
- Acting as a data warehouse
- Automating visualization and report building
The combination of all of these functions in one is extremely powerful and can save dozens of employee hours typically wasted on tedious reporting tasks.
Let's explore each step in detail.
Feature #1: TapClicks Automatically Connects to All Your Marketing Data
We've mentioned that most ETL tools connect to only a limited number of data sources. In contrast, TapClicks was designed to be able to connect to essentially any marketing data source as well as many other data sources relevant to marketers (e.g. AWS, CRM).
To date, we have built connections to over 6,000 data sources via our Smart Connector, including proprietary and offline data sources. Our Smart Connector tool is essentially a feature in TapClicks that lets the user build a connection to any data source they may have.
That way, unlike tools where you're limited to the pre-built API-based connections they already have (and are out of luck if you have a data source not on their integrations list), TapClicks users can build their own connection (or our team can help build one) to essentially any data source you have.
We also have hundreds of pre-built API-based data integrations to all the marketing platforms you would expect (e.g. Facebook Ads, Twitter Ads, etc.) as well as many lesser known ones (e.g. Genius Monkey and Tiger Pistol).
Once you've set up your data connectors, your data will be pulled through immediately. TapClicks will then extract data automatically every day, or whenever you choose, to refresh it. In some cases, we can extract 12 months of historical data, too.
And, unlike building your own ETL or data pipeline solution in-house, TapClicks manages the API connections. This means you don't need to worry about your developers managing a connection if it breaks because the TapClicks team will take care of it for you.

Being able to pull data from all your marketing sources (as well as your other data sources) means you don't have to use a third party tool or do anything manually, saving your team hours of tedious work.
Feature #2: With TapClicks, You Can Set Up Complex Calculations and Transformations Once and Have Them Available Forever
Most marketing data pipelines incorporate some level of data transformation, that is, ensuring labels and schemas are consistent and that any unstructured data is mapped and organized.
That's usually where the transformation process ends. The data is pushed out to a data warehouse or another tool (e.g. a BI tool) where marketing teams are left to do any further analysis or creation of visualizations and reports.
In contrast, TapClicks allows users to set up or define advanced calculations just once, and have those calculations automatically executed anytime in the future.
Here are a couple of examples.
Customize and Combine Metrics
Marketers often deal with metrics from different marketing platforms with unique names which effectively mean the same thing. For example, a social media agency may track follows on Twitter or Facebook and subscribes on YouTube as simply engagement and want to report that to clients.
Normally, reporting on a Total Engagement metric like that is tedious: every month, the team has to add up likes here and follows there, and track it in a spreadsheet.
But with TapClicks, you can define an umbrella term once and it will remain available and updated with the latest data for all future reports you want to create.
For example, you could create a new term inside TapClicks called Total Social Engagement and define it as the sum of post-reactions on Facebook, views on YouTube, or click-throughs on LinkedIn (see below).


Once that custom metric is defined, it will be available in TapClicks forever, with updated data, so you never have to manually add up those engagement metrics again in order to report on them.
In any dashboard or report you build in the future, you can just drop in the metric Total Social Engagement (or a graph of this metric over time) and TapClicks will automatically calculate it based on how you defined it and have the number or graph ready for you.
This is a massive time saver.
Easily Set Up Repetitive Calculations
In addition to defining custom metrics, you can also automate more advanced calculations in TapClicks.
For example, if you are a tire manufacturer and you want to view your data by brand, but you have multiple ad campaigns running for different brands, you can set up advanced calculations that find the specific brand names in the campaign names and aggregate stats across all of these into single metrics for that specific brand.
In our example below, we can see that there are 266 Facebook Ad campaigns, all pulling in data from our data sources.
We've decided to name a certain segment of those campaigns HNP Campaigns' (see arrow on the right-hand side).
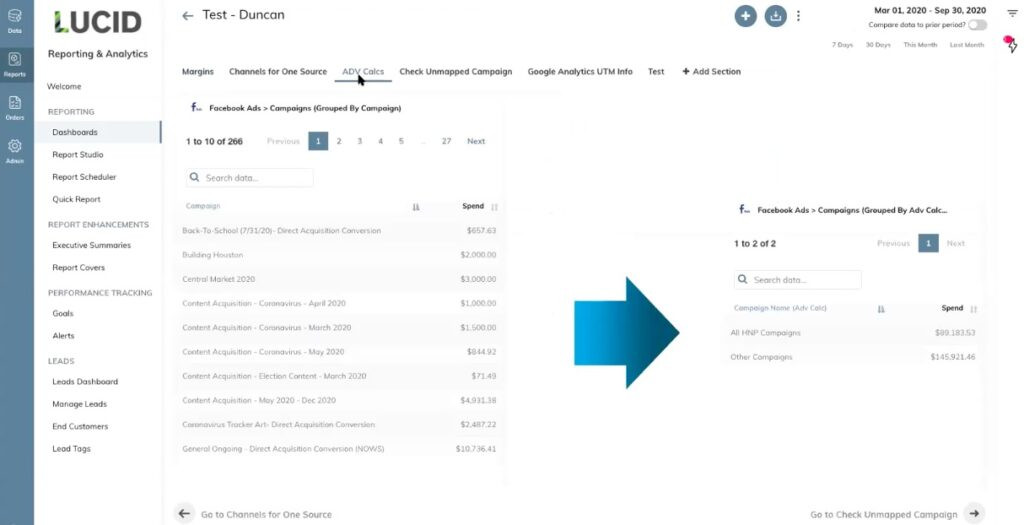
This means we can now pull data for just those HNP campaigns into any report or dashboard we want to create.
In this example, there are 191 of them and it pulls the data for all of those campaigns into one line (see arrow on the right-hand side).
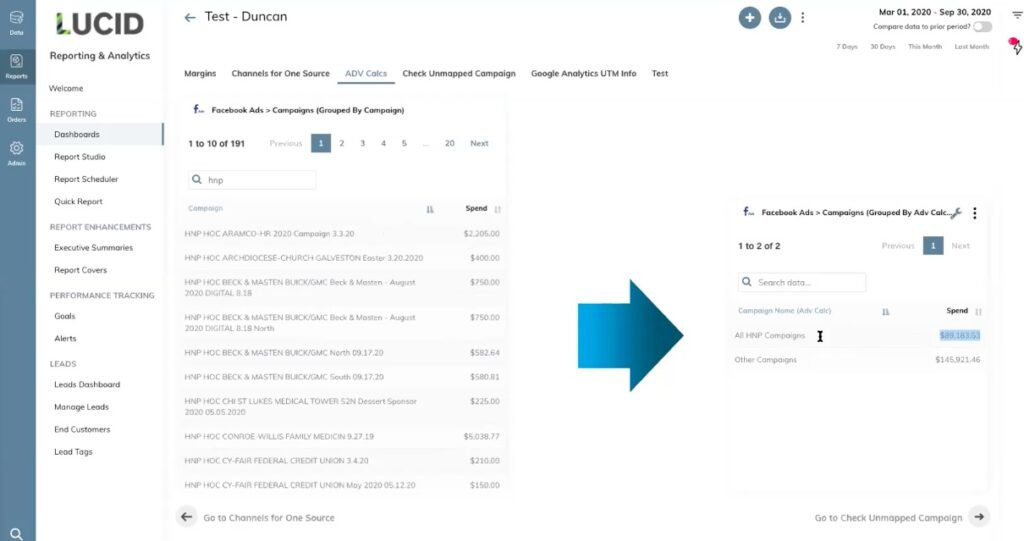
You can use this function to group and view data by all types of location or by any segment you like product, campaign type, or group, and zoom in and out as you need to.
You can also calculate the overall click-through rate by adding up clicks across many campaigns and dividing by total impressions. You could calculate cost per click for campaigns across a region or specific product lines by adding up total spend and dividing by total clicks. The possibilities are endless and are not something that could be achieved by a simple data pipeline tool that only cleans up or transforms data fields.
And, as with everything in the TapClicks solution, you only have to set these up once. From there, calculated metrics are up-to-date and ready for you to report on every week or every month.
Feature #3: TapClicks Is Your Data Warehouse, and Data Can be Extracted without Database Programming
Most marketing data pipelines move your data to a separate data warehouse facility either after it's been transformed (via ETL tools) or before (via ELT tools). Typically, these data warehouses require data engineering experience to use and are not user-friendly for marketers.
TapClicks not only collects all your data and allows you to create custom metrics and do advanced calculations (#1 and #2), it also stores all your data in your own fully managed TapClicks data warehouse. Having TapClicks as your central hub means you can do everything you need to within the TapClicks platform including pushing the data out to other locations.
You can read more about our TapClicks marketing data warehouse in this article.
Having TapClicks as your data warehouse means that your data is stored safely forever and can be accessed by any marketer with no data engineering skills required.
Feature #4: With TapClicks, You Can Create Powerful Marketing Reports That Are Automatically Updated with Your Latest Data
The main pain point of most marketing data pipelines is that they don't allow you to do your analytics and reporting. You have to use separate tools to do this for you.
But with TapClicks, you can create powerful visualizations and reports in two ways and you can push your data out to other platforms, too.
Dashboard Visualizations
You can create dashboards so you can view campaign data in near real-time (typically updated daily).
TapClicks dashboard tools are designed to be scalable, meaning single dashboards or visualizations can easily be turned into templates and applied across dozens or hundreds of dashboards.
Marketing agencies can create one dashboard for a specific type of report and filter the data for each client. This has the advantage of letting you make a change to this report in one place and having it instantly apply to all clients.
Here's a video that shows you how to create a dashboard:
PowerPoint-Style Reports That Are Always Up-to-Date
Our reporting solution, ReportStudio, automatically populates PowerPoint-style reports. These can be scheduled to be sent out to your chosen audience whenever you want (e.g. daily, weekly, monthly, etc.).
Here's a short video on how to schedule reports with TapClicks:
TapClicks Delivers Data to Any Other Platform
If you prefer to analyze and visualize data in a third-party tool, you can also push data from TapClicks to any other destination.
For example, if you use Tableau for analysis and visualization, you can push data from TapClicks there or likewise with Google Sheets.
You can read more about TapClicks integration with Google Sheets in this piece.
These are just a few examples. With ReportStudio, you can schedule and automate when the data is sent out.
Want to Try TapClicks as Your Marketing Data Pipeline?
TapClicks takes the concept of a marketing data pipeline to a whole new level. By providing an end-to-end solution for the entire marketing lifecycle, from data collection through to report distribution, TapClicks offers a flexible and scalable solution for enterprise-level marketers.
If you think TapClicks could work as a marketing data pipeline solution for your organization, you can try it free for 14-days or schedule a demo to learn more.