8 Best Data Integration Tools for Marketing Teams
You open Google Ads, export numbers from each, paste them into a sheet, and hope everything lines up. Then a client or stakeholder asks why this month’s report doesn’t match the last one.
That’s the daily reality for most marketing teams.
Data integration tools solve this problem by connecting your data sources, standardizing your numbers, and making reporting far more reliable.
In this guide, you’ll see the best data integration tools for marketing teams and what each one helps you accomplish.
TL;DR
These are the best data integration tools in 2026:
-
Funnel
-
Supermetrics
-
Adverity
-
Improvado
-
Windsor.ai
-
Zoho Analytics
-
Databox
What Are Data Integration Tools?
Data integration tools collect data from platforms like Google Ads, Meta, customer relationship management (CRM) systems, and spreadsheets. They clean, organize, and send that data to dashboards, reports, data warehouses, or data lakes.
Marketing teams use data integration software because each platform reports data differently. Campaign names, metric definitions, and file formats don’t match, which makes manual reporting unreliable.
A consistent data integration process improves data quality before teams analyze data. It also helps business intelligence (BI) tools and AI systems produce reports, forecasts, and summaries that reflect accurate performance.
Common data integration methods include extract, transform, load (ETL) and extract, load, transform (ELT). Teams also rely on application programming interface (API) connections, data replication, and real-time syncing to keep data updated.
Some platforms include metadata management to standardize how data fields are labeled. Others use change data capture (CDC) to track updates like new records or edits, then send only those changes to reporting systems.
8 Best Data Integration Tools in 2026
Below are the best data integration platforms for marketing teams that need reliable data pipelines, clean reporting, and better visibility into performance.
1. TapClicks
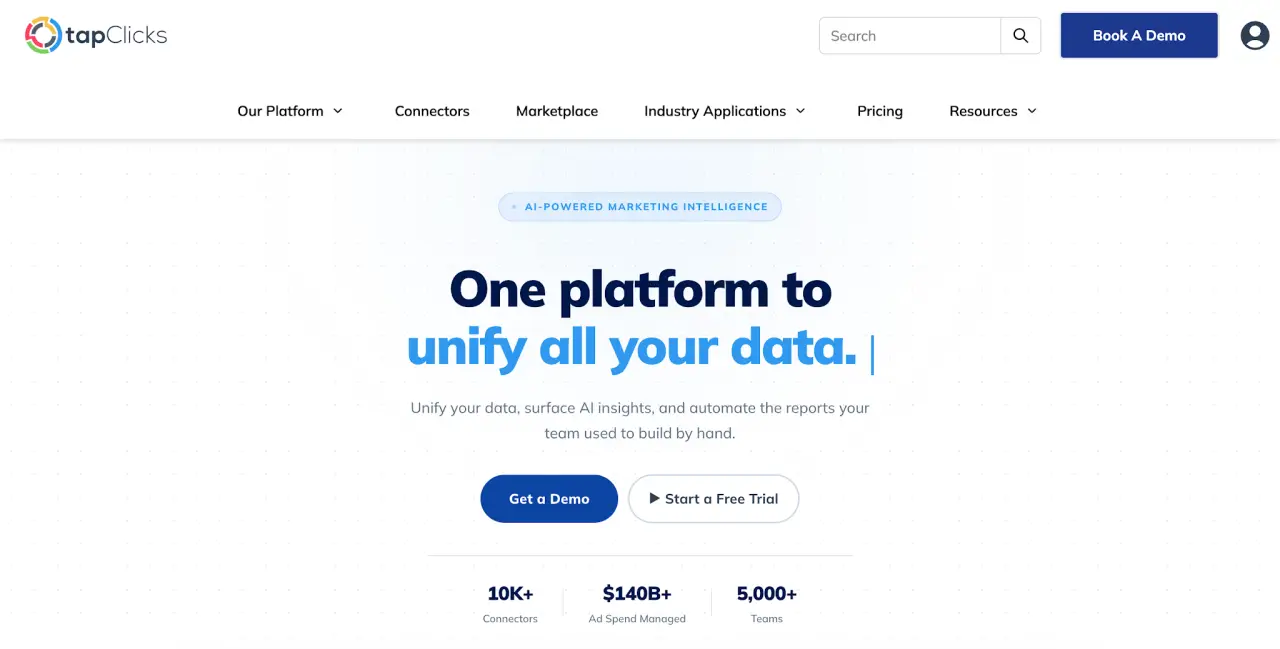
TapClicks brings your entire data integration process into one system, from data ingestion to reporting. It connects data from platforms like Google Ads, Meta, CRM tools, and spreadsheets, then prepares that raw data so it’s ready for analysis.
Key features include:
-
250+ native connectors for major marketing data sources
-
SmartConnector for custom, offline, CSV, XLS, and third-party data
-
Instant-On connectors for historical data storage
-
On-Demand connectors for near-real-time data access
-
Transformation Hub for cleanup, normalization, segmentation, and pacing
-
Channels for organizing integrated data into reporting views
-
Data blending for combining multiple sources into unified datasets
-
Data Exporter for Snowflake, BigQuery, Redshift, Amazon S3, Tableau, Looker Studio, and Power BI
-
Data Load Status for monitoring data activity and validation
-
Enterprise hierarchy, role-based access control, audit trails, and client data isolation
-
Native delivery into SmartReports, SmartStory, SmartAnalytics, and SmartSuite
Connects, Prepares, and Organizes Marketing Data
TapClicks connects data from multiple systems using three connector types. Instant-On connectors store historical data for trend analysis, while On-Demand connectors retrieve fresh data during campaign reviews.
SmartConnector integrates data from sources without native connections, including offline files and custom systems.
After data ingestion, TapClicks standardizes the data before it reaches reporting tools. Marketing data often arrives with inconsistent naming and conflicting metrics, which can lead to reporting errors.
Transformation Hub applies repeatable rules for data transformation, cleanup, and segmentation, so you don’t have to fix the same issues every reporting cycle.
Extends Data Integration Into Reporting and AI Outputs
Once data is structured, TapClicks sends it directly into reporting and analytics tools within the platform.
SmartReports automates report delivery using integrated data, while SmartStory turns that same data into presentation-ready outputs with written insights.
SmartAnalytics provides dashboards for performance tracking, and SmartSuite adds AI-driven insights based on the integrated dataset.
2. Funnel
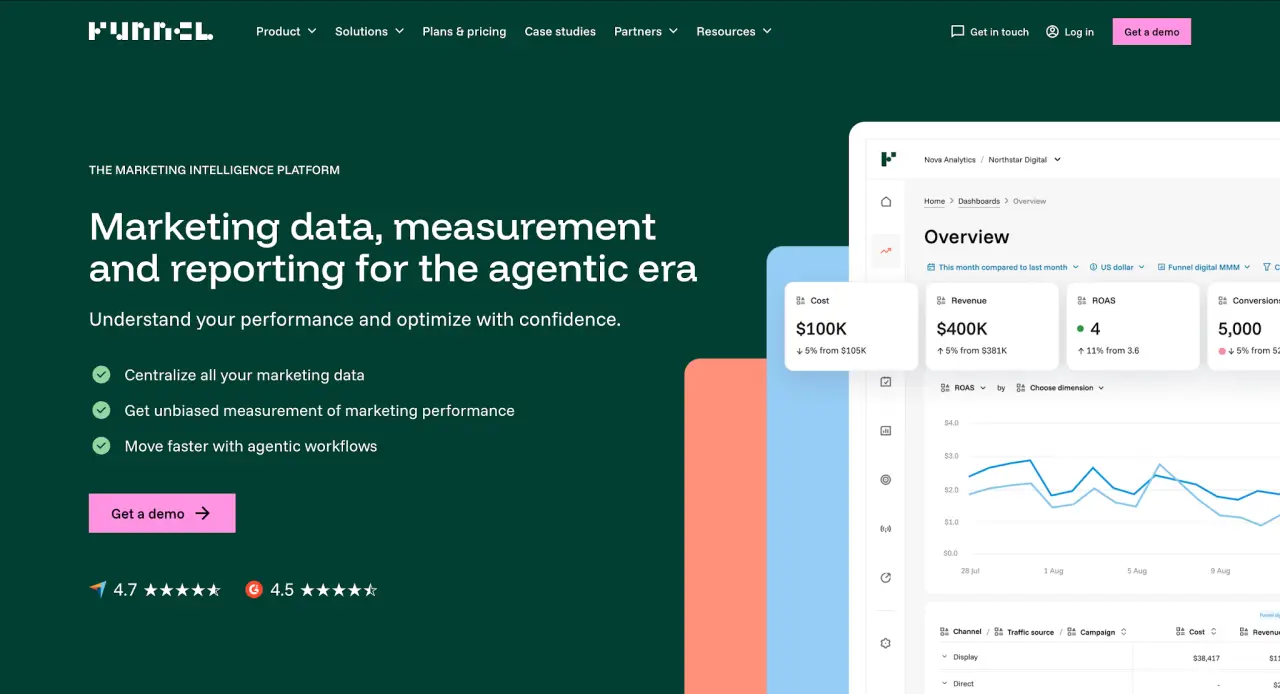
Image source: funnel.io
Funnel helps marketing teams collect data from multiple systems and prepare it for reporting without relying on dedicated engineering support.
It pulls data from ad platforms, analytics tools, and cloud apps, stores that raw data, then sends it to destinations like cloud data warehouses or BI tools.
Key features include:
-
Extract, store, transform, and load workflow
-
200+ marketing connectors with native integration
-
Central raw data storage for historical tracking
-
Data validation checks before loading data
-
Automatic handling of API updates and schema changes
-
Destinations for cloud data warehouses, spreadsheets, and BI tools
-
No-code data transformation for business users
Funnel Strengths
Funnel gives teams control over how they handle data without managing complex data pipelines. Since it stores raw data first, teams can adjust transformation rules later without losing historical records.
It also takes care of maintenance. Funnel adapts to API updates, checks incoming data for errors, and keeps data pipelines consistent over time.
Funnel Limitations
Funnel’s pricing model can increase as more destinations like Snowflake or Tableau get added. This can make long-term budgeting harder as data volume grows.
3. Supermetrics
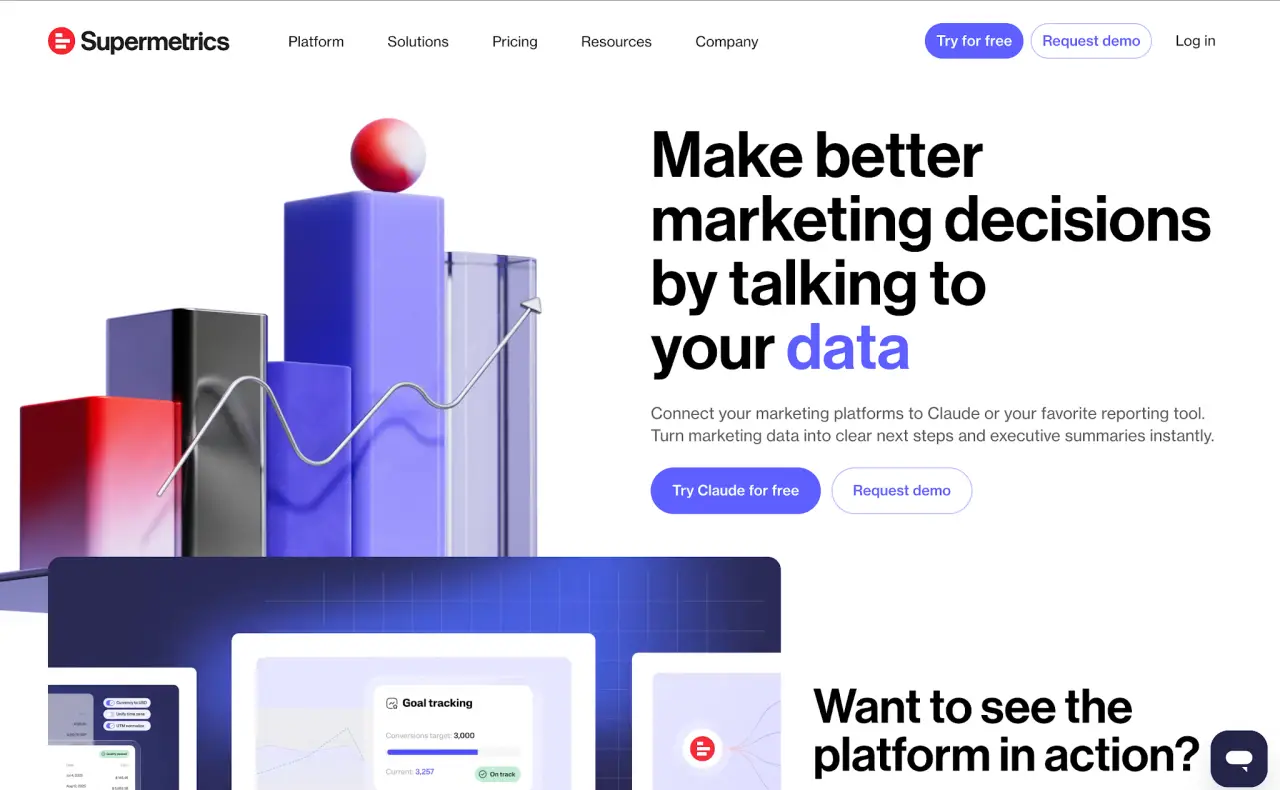
Image source: supermetrics.com
Supermetrics helps marketing teams collect data from different platforms and send it directly into tools like Google Sheets, Excel, or Looker Studio.
It focuses on data extraction, light data transformation, and delivery, so teams can review performance without relying on data engineers.
Key features include:
-
Connectors for Google Analytics 4, Facebook Ads, Shopify, HubSpot, and more
-
CSV, Excel, API, and custom data imports for offline or unsupported sources
-
No-code data transformation, mapping, and data blending
-
Naming rules, business rules, and custom metrics
-
Data storage, replay, and historical backfill
-
Data quality monitoring and alerts
-
Proprietary APIs for custom data integration workflows
Supermetrics Strengths
With Supermetrics, you can send campaign data from multiple systems into a spreadsheet or dashboard in a few clicks, then combine data from different platforms into a single dataset.
It’s also easy to use. Teams can clean, map, and organize data using a visual interface, which makes it accessible for business users who don’t manage complex data pipelines.
Supermetrics Limitations
Supermetrics can become limiting as your data setup grows. Some connectors are missing or restricted, and certain integrations only allow short historical lookbacks.
Pricing also increases as you unlock more connectors and destinations. Teams with larger data volumes or more complex needs may need additional tools for deeper data transformation and governance.
4. Adverity
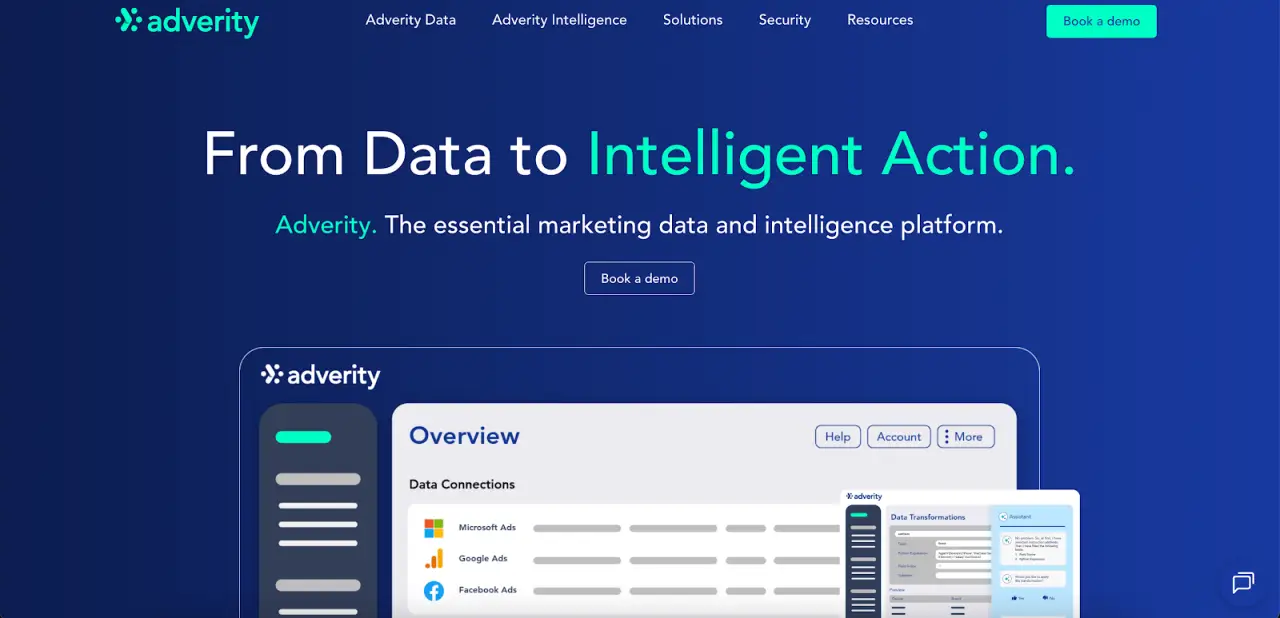
Image source: adverity.com
Adverity connects data from marketing platforms, ecommerce systems, databases, and file uploads, then prepares it for reporting and analysis.
It’s useful for agencies that deal with complex data integration, where data from multiple sources needs to be standardized before it’s usable.
Key features include:
-
600+ pre-built connectors for marketing and business data sources
-
Custom data ingestion through webhooks, secure file transfer protocol (SFTP), APIs, and file uploads
-
Data transformation, harmonization, and enrichment
-
Schema mapping for a consistent data structure
-
Destinations for data lakes, data warehouses, cloud storage, databases, and BI tools
-
Scheduled data updates
-
Data governance and source management
Adverity Strengths
Adverity centralizes data into a structured dataset that’s ready for analysis. It works well for handling complex data pipelines where multiple systems use different formats or naming conventions.
It also simplifies data pipeline management. You can connect sources, apply transformation rules, and send data to your warehouse or BI tool without rebuilding your setup each time.
Adverity Limitations
Users report occasional interface issues, especially when updating connections or permissions. These can interrupt workflows and take time to resolve.
Customization can feel limited. Adjusting field names or formatting data isn’t always straightforward, so teams may need to make changes after exporting the data.
5. Improvado
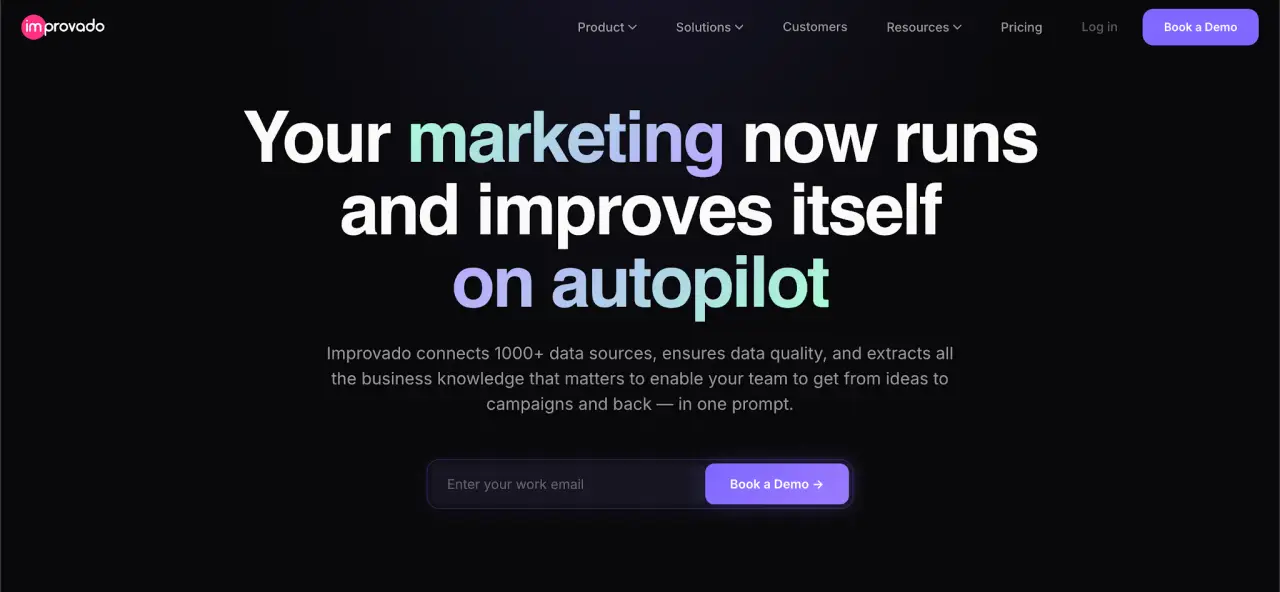
Image source: improvado.io
Improvado connects marketing, sales, and revenue data from ad platforms, analytics tools, CRM systems, spreadsheets, and databases, then prepares that data for warehouse analysis.
It focuses on managing data pipelines that feed structured datasets into reporting and analytics tools.
Key features include:
-
500+ data sources
-
40,000+ metrics and dimensions
-
20+ enterprise-grade destinations
-
Marketing and revenue data pipelines
-
Managed or customer-owned warehouse options
-
No-code transformations
-
Templates for multi-touch attribution (MTA) and marketing mix modeling (MMM)
-
Hourly data refresh options
Improvado Strengths
Improvado helps consolidate large volumes of marketing and revenue data into datasets ready for warehouse use. It’s useful for teams working with many ad accounts, CRM records, and performance metrics that need to follow a consistent structure before analysis.
It also supports ongoing data flow into cloud services like Google BigQuery, Snowflake, and Amazon S3. Teams can apply transformation rules and prepare datasets for attribution analysis without relying entirely on dedicated data engineering resources.
Improvado Limitations
The platform takes time to learn, especially for teams new to warehouse-based reporting. Users also report issues with connection and live updates, and limited flexibility when creating reports.
6. Windsor.ai
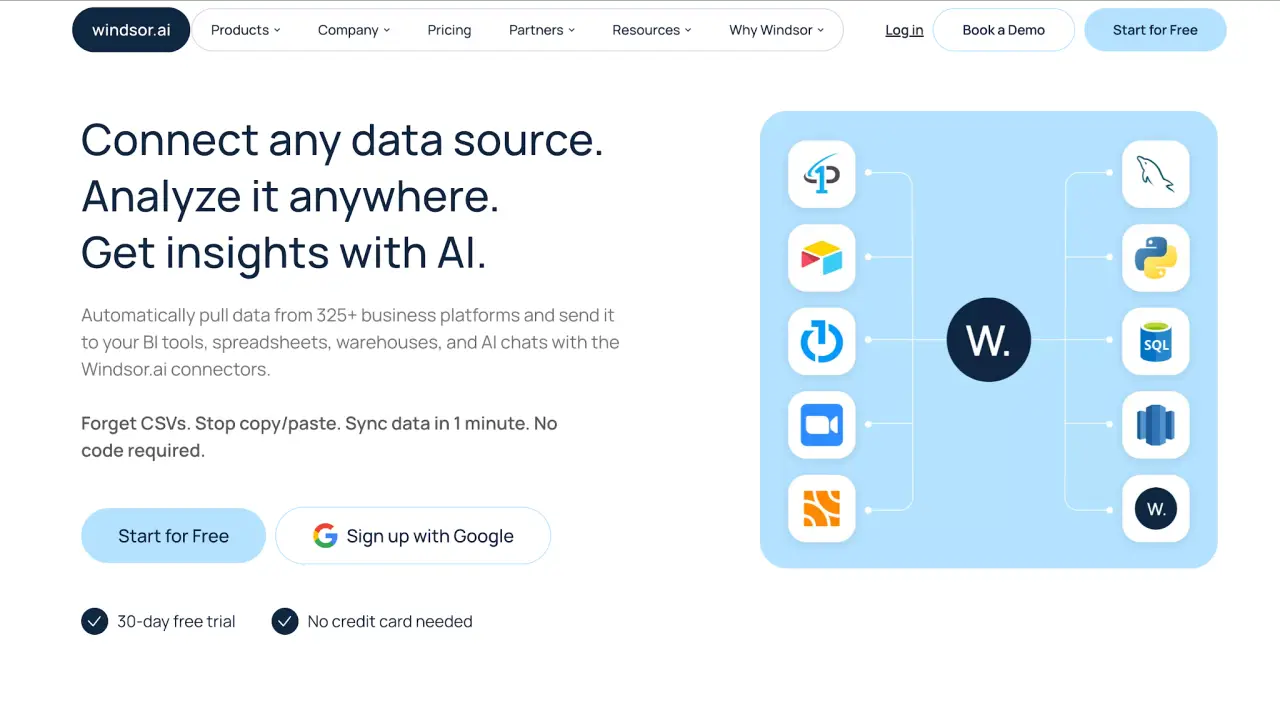
Image source: windsor.ai
Windsor.ai pulls marketing data from 325+ platforms and sends it directly to tools like Google BigQuery, Power BI, Tableau, and Google Sheets.
It helps teams consolidate data from ad platforms, analytics tools, and business systems so they can analyze cross-channel performance without exporting files.
Key features include:
-
325+ data sources
-
20 destinations
-
6,500+ unique integrations
-
No-code ELT connectors
-
Destinations for BI tools, spreadsheets, data warehouses, and AI chats
-
Agency workflows for multi-account reporting
-
Data blending for cross-channel analysis
-
Unlimited users and data blending on every plan
Windsor.ai Strengths
Windsor.ai supports real-time data processing for performance tracking. Marketing teams can send data into dashboards or analytics tools and use it for data visualization without relying on engineers.
Windsor.ai Limitations
Advanced setups can take time to learn, especially when configuring custom transformations or pipelines.
In some cases, connector reliability depends on external APIs, which can affect how often data updates.
7. Zoho Analytics
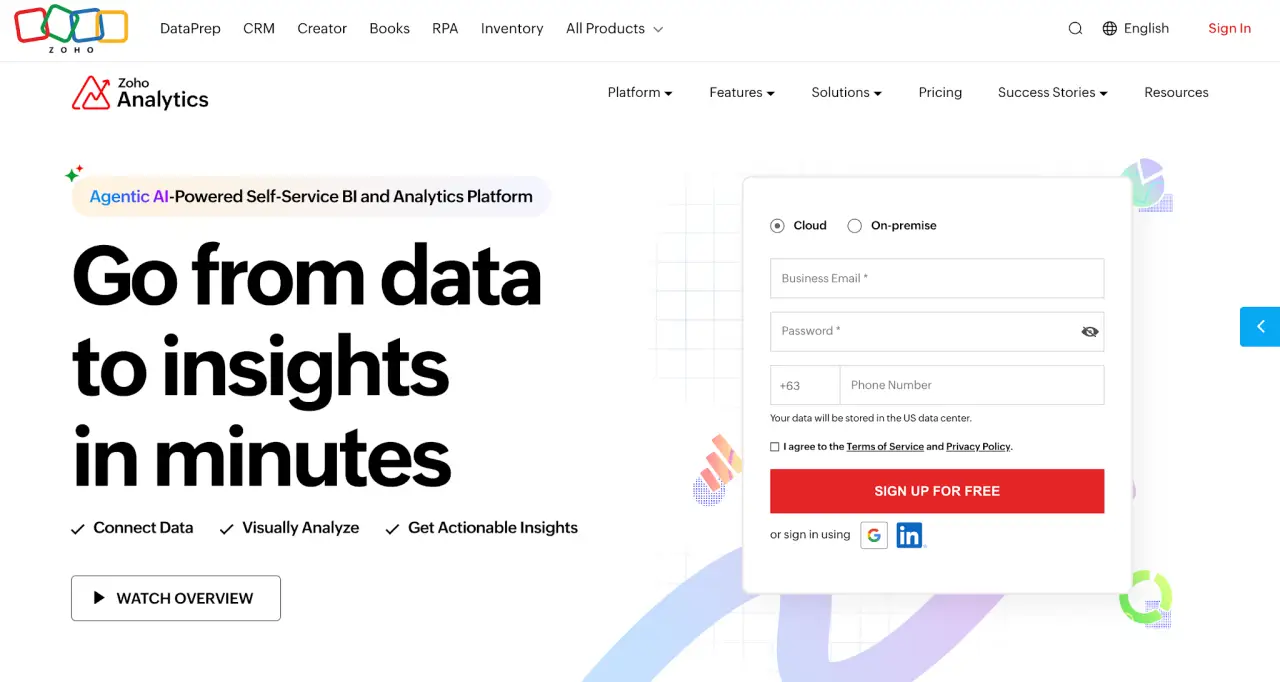
Image source: zoho.com
Zoho Analytics collects data from spreadsheets, cloud storage, databases, and business apps, then prepares it for reporting and analysis. It helps combine structured and unstructured data, so reports don’t rely on manual uploads or disconnected systems.
Key features include:
-
File imports from Excel, CSV, JSON, XML, and text files
-
Cloud storage integrations like Google Drive, Dropbox, and OneDrive
-
Connections to cloud and on-premises systems, including relational databases
-
Ready-made connectors for sales, marketing, finance, and support apps
-
Custom no-code connector builder
-
Scheduled data sync for consistent updates
-
Live Connect for querying databases without storing data
-
Zoho Databridge for secure data transfer
-
Ask Zia for data preparation, modeling, and structured query language (SQL) generation
-
Drag-and-drop dashboards and reports
-
Encrypted columns for sensitive data
Zoho Analytics Strengths
Zoho Analytics is often used by companies already working within the Zoho ecosystem. It extracts data from multiple systems into a shared dataset that feeds dashboards and reports.
The interface allows business users to connect sources, prepare datasets, and create reports without heavy reliance on data engineers. Scheduled syncs and built-in connectors help automate reporting workflows.
Zoho Analytics Limitations
Performance can drop with large datasets, especially during report generation.
Users also mention limited customization and less intuitive integrations in certain setups. Some tasks still require SQL, which can slow down non-technical users.
8. Databox
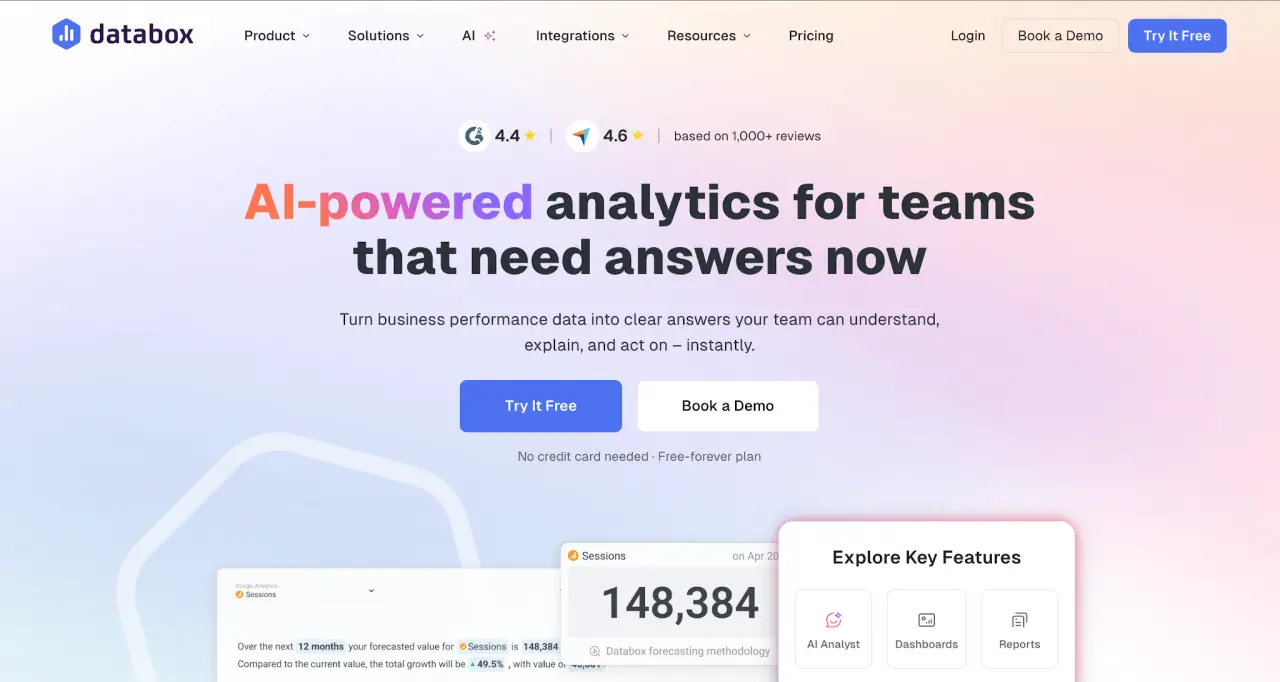
Image source: databox.com
Databox pulls data from marketing platforms, sales tools, spreadsheets, databases, and APIs, then feeds that data into dashboards for reporting. It connects different systems, so performance metrics update automatically without manual file handling.
Key features include:
-
130+ native integrations
-
Connections to Google Sheets, Excel, SQL databases, and custom APIs
-
Zapier and Make for workflow automation
-
Sync frequency options range from near real-time (every 15 minutes) to daily
-
Dashboards and automated reports
-
Datasets and custom metrics
-
Goals, alerts, and AI summaries
Databox Strengths
Databox supports application integration by connecting common business tools, spreadsheets, and APIs into a single reporting layer.
It keeps data availability consistent by updating metrics on a set schedule, so dashboards reflect recent performance without manual updates.
It also helps automate workflows linked to reporting. Users can set update intervals, generate reports, and monitor key metrics in one view, which helps streamline business processes around performance tracking.
Databox Limitations
Teams using niche tools may need to rely on API connections or external automation.
Users also note that AI summaries lack depth. Updating templates or managing multiple accounts can take time as reporting requirements expand.
Why TapClicks Is the Top Choice for Marketing Data Integration
TapClicks stands out when marketing data needs to be prepared before anyone uses it. It covers the entire data lifecycle, so raw campaign data doesn’t end up in reports with mismatched names or conflicting metrics.
For example, Google Ads and Meta often label campaigns differently. TapClicks standardizes those fields before they reach dashboards. That’s where its transformation capabilities come in.
You can define rules once, like renaming campaigns, grouping channels, or calculating blended metrics, and those rules apply every time new data enters the system.
It also handles schema changes without forcing updates to existing reports. When a platform adds or modifies fields, TapClicks adjusts the data structure so dashboards and exports continue to work as expected.
This matters in cloud and hybrid environments where data comes from ad platforms, CRM systems, and warehouses. TapClicks keeps those data assets consistent and ready for analytics-focused reporting.
Data quality and governance happen before reporting. Marketing analysts and data scientists don’t need to correct datasets later. They can work with data that’s already prepared for reporting and analysis.
Turn Raw Campaign Data Into Usable Reports With TapClicks
Reports fall apart when campaign data doesn’t match. One platform tracks conversions one way, another labels campaigns differently, and the numbers don’t line up.
A data integration tool fixes those issues before the data reaches a dashboard.
The right platform does more than connect sources. It uses data profiling to catch missing fields, applies rules while transforming data, and keeps reports usable when platforms introduce schema changes.
Real-time data integration keeps dashboards updated without manual refresh cycles.
Marketing organizations working with modern cloud platforms often handle large datasets from many sources. A user-friendly interface lets marketers review data, adjust rules, and check outputs without relying on a separate data build tool (DTB).
TapClicks prepares data before it reaches reporting. Reports match source data the first time, so there’s no need to trace errors back to exports or recalculate metrics.
Book a TapClicks demo to see how data can flow from source to report without repeated cleanup.
FAQs About the Best Data Integration Tools
What are the best data integration tools?
The best data integration tools include TapClicks, Funnel, Supermetrics, Adverity, Improvado, Windsor.ai, Zoho Analytics, and Databox.
TapClicks is a strong enterprise integration platform for marketing teams since it prepares data for reporting instead of only transferring it between systems.
Will ETL be replaced by AI?
AI won’t replace extract, transform, load (ETL). It can help map fields, suggest transformations, and adapt to automated schema updates, but teams still need ETL to collect, prepare, and deliver data.
What's the best data movement tool for integration?
The best data movement tool depends on the destination and use case. For marketing reporting, look for integration capabilities that include data extraction, transformation, syncing, and delivery to dashboards or warehouses.
Is DBT an ETL tool?
Data build tool (DTB) isn’t a full ETL tool. It transforms data after another system loads it into a warehouse, so teams usually pair it with tools that handle extraction and loading.