
Smaller marketing agencies often use Google Data Studio (GDS) a free tool to show results to their clients in the form of graphs and dashboards.
However, there are only 17 free Google connectors, and they're for platforms within Google's ecosystem Google Ads, Google Sheets, Google Analytics, BigQuery, etc. But the agencies we work with also handle data sets from outside of their Google account, such as marketing reports from platforms like Facebook Ads and Microsoft (Bing) Ads. This means that for many agencies, just using Google Data Studio on its own is not a viable solution.
From here, an agency has three choices:
- Use Google Data Studio for Google-based metrics, such as your Google Analytics data, and use Excel/Sheets and Powerpoint for collecting and reporting data sets from platforms such as Facebook Ads and LinkedIn Ads.
- Export the desired data as a CSV file, rearrange it in Google Sheets, and then upload that file into Google Data Studio, where you can create more engaging marketing reports.
- Use community connectors that bridge the gap between Google Data Studio and the platform you need.
In this post, we're going to look at these options, focusing mostly on the two methods of importing data sources into your Google Data Studio dashboard. First, we'll look at what that's like without using third-party community connectors (this means just relying on Google sheets as a way to import data from non-Google platforms). Then, we'll look at what the process is like when you're using community or partner connectors.
Using Google Sheets for Data Analysis and Reporting
Plenty of agencies let their reporting live within Google Sheets perhaps because they don't want to pay for (or are not aware of) community connectors available within Google Data Studio.
Or it could be that they're sticking with the in-house reporting system that one of their marketers made from the very beginning, which could be a case of, if it isn't broken, why fix it?
Well, there are three reasons:
- Even when it's working, it's inefficient. Working in Google sheets for reporting and data analysis requires a lot of manpower. There's upkeep, plus the added risk of human error as your marketers edit columns and rows and enter in long and complex formulas. Even the smallest mistake can lead to a significant misunderstanding, where you think a campaign is working when really it isn't worth the ad spend.
- If you're using Google Sheets for one set of metrics and Google Data Studio for another, your process is fragmented. This means it's difficult for you (and your clients) to see the whole picture of your digital marketing efforts because you're toggling back and forth between two different systems to get an overall view of the effectiveness of your marketing platforms.
- You cannot send out scheduled updates. A good reporting tool saves your team time so they can focus on more result-driven tasks. Plenty of marketing agencies have reporting days. These are entire workdays dedicated to gathering reports, analyzing reports, and sending them out to clients. This time-drainer could be heavily reduced if your team was working with a tool that sent out reports automatically on a schedule.
These are typically the reasons why agencies start ditching Google Sheets and instead try exporting their data from a Google Sheet into Google Data Studio.
But let's say your agency has three clients, all of which are paying for SEO and paid ad services.
For your Google-based work, such as your Google search ad campaigns, you've been using Google Data Studio to pull and organize data. This process has been relatively simple and intuitive.
But your marketing team is also handling Facebook data. And up until now, that process has looked like this:
- Your account manager logs into Facebook Ads Manager and exports the relevant data into a CSV file.
- They take the CSV file and upload it to Google Sheets.
- From there, they spend a significant amount of time organizing the data within Google Sheets. This means adjusting columns and rows, deleting data points that are not relevant, highlighting data points that show value, and renaming headers.
- Once they have finished polishing up the spreadsheet, they go to Data Studio and click Data Sources.
- After clicking Data Sources, they click the Create icon and select Google Sheets from the list of Google Connectors.
- From there, they select the Google sheets file that they just finished editing.
- Now the data from the Google Sheets file is imported into Data Studio.
True, this process gets data into Google Data Studio, which saves you some time, but it doesn't do much for increasing efficiencies even after you've completed those seven steps, you're not done.
Your Facebook ad specialist still needs to organize the data, creating a custom Data Studio dashboard to highlight chosen metrics such as impression rate and engagement rate. If there was an issue in importing if they mislabeled a metric or chose the wrong time-frame they need to start again at the beginning.
In short, using Google Sheets as a way to import data from third-party platforms like Facebook gets all your metrics into one tool, but you're still not reaping the benefits from using Google Data Studio because your advertising data is tied to a Google sheet and not directly to your marketing platform.
To get the benefits of using GDS, you need to leverage community connectors.
Community connectors serve as a bridge between your non-Google affiliated data and your Google Data Studio dashboard.
By using community connectors, your data is seamlessly connected to Google Data Studio. All of your marketing tasks can not happen within Google Data Studio you don't have to organize it first in a spreadsheet. You simply organize the data within an easy to navigate dashboard.
How Megalytic Goes Beyond Being Just Another Community Connector Option

Using community connectors to import data is the faster and better solution as long as the connector you're using helps you organize, analyze, and report on the data you need. Not every community connector functions in the same way. For example, if you're looking at importing marketing data from Facebook Ads, Megalytic can import ~700 Facebook metrics and dimensions, whereas Supermetrics tops off at ~500.
Plus, our Megalytic connectors help your agency tell a story around its marketing. We do this by offering templates catered towards the most common reporting needs, custom branding features, automated data updates, and scheduled data delivery.
Templates for Quick and Easy Reporting
While it's true that getting data from your platform into Google Data studio through a connector saves you time, your marketing team still needs to build a dashboard.
At Megalytic, we have ready-made templates catered towards SEO, PPC, website performance, and more.
So if you're using our Facebook Ad data connector, you'd have access to our PPC templates. You can add widgets for your monthly CPC next to your monthly ad spend. Then you can add widgets for your engagement rate and click-through rate.
This is very helpful as you scale. The more clients you get, the more you'll see some overlap in what metrics are being monitored. Yes, each client is different, and yes, you'll want to customize reporting for each client (more on this below), but by using our ready-made templates, most of the work is already done your marketers just need to fine-tune it to their needs.
Custom Branding So Your Reporting is Associated with Your Agency
To help you demonstrate value and stand apart, you want to impart brand recognition to your clients. This way, when they see the results you're delivering, they register it as results that your agency brought them. This is why white label branding is so important, and why we offer it with our connectors.
You can upload logos, create cover pages, and customize colors to match your style (or your client's).
Automated Data Updates to Help Save Time
We talked a little bit above about how marketing teams will sometimes create reports one day a week. That may seem extreme to some agencies, but here's some data pulled from our actual customers.
Our customer base has shown us that using Megalytic connectors saves them at least 90 minutes per report each month. So, if you have 100 reports, that's 150 hours per month or nearly a full-time job worth of hours. That means eliminating that work can save your agency around $4,000-$6,000 per month.
But more than that, eliminating that work can keep your marketing team hyper-focused on delivering results for your clients.
We make this possible, in part, by letting you automate data updates. You can choose if you want your data in the report updated every month, week, quarter, and so on. This way, you don't need to hit refresh or re-export data it just happens automatically, saving you time.
Plus, you can choose how often you want your clients to get a report. This saves you even more time, as you don't need to login, download a pdf, and send it to the appropriate parties.
Using Megalytic to Import Data into Google Data Studio
Here's how easy it is to get started with a Megalytic community connector. Let's say you wanted to add Facebook Ads data to your GDS.
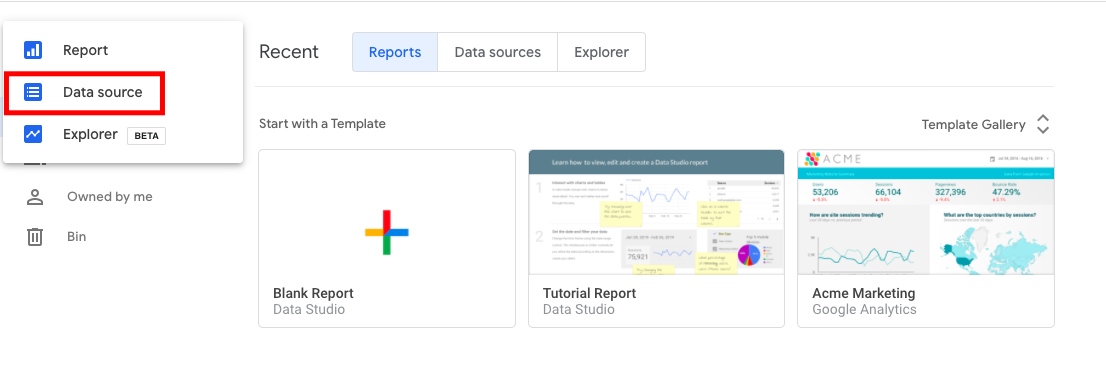
First, you'd log into Google Data Studio, and click on Create.

From there, you'd click on Data Source, which would take you to a list of all data sources in the connector gallery.
 When you're in the connector gallery, you can just search the platform whose data you want to be imported.

From there, you just need to authorize your Facebook account, and then you're taken to a screen that shows the available data.
Once you've done that, you can create your data studio report. Like many data connectors, Megalytic uses drag and drop widgets that allow you to easily create a report that has graphs, charts, and other visual representations of data.
Plus, you can edit the report, including changing the colors, fonts, and other style choices.

And that's it! From there you can set a schedule to send out an automated report to your clients, and re-allocate reporting day hours to working on developing more marketing strategies.
Final Thoughts
Google Data Studio as far as free tools go is pretty solid. It allows agencies who don't yet need a full-service marketing operations platform to use their data to create charts, graphs, and marketing reports.
And, thanks to community connectors, your agency can use these features with the platforms they work with the most. In particular, with Megalytic's connector, ready-made templates, custom branding, and automated data updates give you an easy, professional-quality way of reporting to clients.
By bringing in data from your various marketing platforms, you can connect your digital marketing strategies and build omnichannel reports that give a clearer picture of how your agency is performing.