
To improve PPC reporting in 2025, you need to give clients more than numbers. Reports should connect ad performance with real business goals.
That means focusing on the right data, using clear visuals, and explaining what the results actually mean. Templates, automation, and cross-channel dashboards make the reporting process faster and easier.
In this article, you’ll learn how to improve PPC reporting for clients in 2025 with better structure, smarter tools, and clearer insights.
Centralize your PPC data and simplify reporting for every client. Schedule a TapClicks demo today!
What is PPC Reporting?
PPC reporting is the process of showing clients how their paid campaigns perform across ad platforms like Google Ads and Microsoft Ads.
Instead of handing over spreadsheets or rows of numbers, marketers now organize campaign data into visual summaries. These reports often include charts, KPIs, and written explanations.
A strong PPC report gives clients a clear view of their budget, results, and next steps. The main goal is to present performance metrics in a format that’s easy to understand, including what worked, what didn’t, and how to move forward.
For example, a report might show how changes in ad targeting improved conversions or reduced cost per acquisition. It may also break down return on ad spend across multiple platforms.
A proper report also explains the context behind the data. If ad spend increased last month, the report should explain why.
If click-through rates dropped, it should suggest a fix. This combination of numbers and commentary is what makes a report valuable.
When done well, PPC reporting builds trust. It shows the client that you’re not only tracking the numbers, but also thinking strategically. You’re looking at more than just raw data. You’re connecting actions to outcomes.
4 Ways to Improve How You Report PPC Performance to Clients
The four methods below focus on making PPC reports more useful, accurate, and client-friendly.
1. Add All Essential Elements in Your PPC Campaign Report
A good PPC report starts with the right data. It should include the metrics that matter most to the client, presented in a format that’s easy to understand.
Each section of the report should serve a purpose and help explain how the campaign is performing. Below are the key parts every effective PPC report should cover.
Date Range
Setting a clear and consistent date range is one of the first steps in building a useful PPC report. Without it, the data loses meaning.
Clients need to know exactly when the results occurred to judge if trends are positive or negative, and whether outside events may have influenced campaign performance.
A clear date range helps with comparison, tracking progress, and understanding how long it took to achieve specific results. It also provides structure to the entire report.
Here’s what to include when defining the date range:
-
Start and end dates - Mark the exact timeframe the report covers (e.g., April 1–30, 2025).
-
Comparison periods - Include previous timeframes (like last month or last year) to help measure growth or decline.
-
Reporting frequency - Specify whether this is a weekly, monthly, or quarterly report so clients know what cycle they’re reviewing.
-
Date of last data pull - Let clients know how recent the numbers are, especially if some platforms have delays.
Using a consistent format across reports helps reduce confusion and keeps your reporting process organized. It also supports more accurate conversations around campaign performance and future campaigns.
Campaign Goals
Every PPC report should begin with a reminder of what the campaign was trying to accomplish. Goals set the context for all the numbers that follow. Without them, the client may not understand how to judge the results.
When a campaign starts, goals might focus on lead generation, sales, app installs, or increasing visibility. That goal shapes which metrics matter most in the report.
If a client wants leads, the report should highlight conversions, form submissions, and CPA. If the focus is brand awareness, then impressions, reach, and engagement might take priority.
Make sure each goal is specific and tied to a result that can be measured. Avoid vague terms and connect each number in the report back to the original objective.
Use clear labels like:
-
Primary goal - The main outcome the campaign aimed to achieve.
-
Supporting key PPC metrics - The performance metrics that show progress toward the goal.
-
Result summary - A one-line update on whether the goal was met, exceeded, or missed.
Outlining goals helps clients see how the PPC strategy supports their larger marketing initiatives.
Cost per Acquisition (CPA)
Cost per acquisition tells clients how much they spent to gain one paying customer or lead. It’s one of the first numbers most clients look for in any PPC report.
When CPA is too high, it suggests the campaign may not be working efficiently. When it’s low, it usually means the PPC advertising and messaging are aligned with the audience.
Track this number closely and compare it to past reports. Show how CPA has shifted over time and include a brief comment explaining what likely caused that change. If CPA improved after adjusting keywords or ad groups, make that connection clear.
What to include in your CPA breakdown:
-
Current CPA - The most recent cost per lead or sale.
-
Previous CPA - From the last comparable report (month, quarter).
-
Change over time - Show if it dropped, increased, or stayed steady.
-
Possible cause - Briefly explain what might have affected the result.
Clients don’t want to read between the lines. Spell it out for them. If you’re testing new targeting or adjusting bids to lower CPA, include that update in the report.
Return on Ad Spend (ROAS)
ROAS shows how much revenue the campaign generated for each dollar spent.
Clients use this figure to judge if their investment paid off. A high ROAS signals that ads are driving real value. A low ROAS suggests the campaign needs changes.
Include both the revenue and cost when showing ROAS. Make it clear if the calculation includes only ad spend or also covers related costs like tools, creative, or staff time.
That way, clients understand what the return actually reflects. Report this section with:
-
Revenue from ads - Total income directly linked to the ad campaign.
-
Ad spend used for ROAS - State if it includes extras or just media spend.
-
ROAS ratio - For example, $5 earned for every $1 spent.
-
What influenced ROAS - Add a note explaining what raised or lowered it.
Don’t leave clients guessing. Explain the numbers in plain terms and show how they connect to their goals.
Conversions
Conversions track the actions people take after clicking on an ad, like signing up, calling, or buying. This number tells clients if the PPC campaign drove real results, not just clicks.
Break conversions into types to show where the value came from. A lead form may matter more than a page view. Use this section to show which ads or audiences delivered the most value.
Include:
-
Total conversions - Clear number of completed actions.
-
Conversion types - Separate leads, purchases, calls, etc.
-
Conversion rate - Percent of clicks that turned into conversions.
-
Top sources - Highlight which ads, platforms, or campaigns performed best.
-
Context - Mention any changes that impacted results, such as a new offer or landing page tweak.
Focus on what matters. Show which actions helped the client reach their goals, and explain why certain results stood out.
Ad Targeting
Ad targeting shapes who sees your ads and how well they perform. If the ads don’t reach the right people, even the best content or creative won’t produce strong results.
Your PPC report should break down targeting by audience traits, like age, location, interests, or behaviors, and tie that to campaign results.
Clients want to know which audience segments delivered the most conversions and which ones wasted spend. Reports should connect audience details with campaign performance, not just list them. Use real data to highlight what’s working and what needs improvement.
In this section, include:
-
Target settings - Geography, age, interests, device, etc.
-
Audience match performance - Which groups clicked and converted.
-
New test segments - Any new targeting options added during the period.
-
Next steps - Suggestions for tightening or expanding segments in future campaigns.
Advertisement targeting directly affects return on ad spend. A focused audience delivers better results at lower costs.
Cost per Click (CPC)
CPC shows how much each ad click costs. It’s one of the most basic yet essential metrics in PPC reporting. While it doesn’t measure conversion quality, it gives a clear view of ad efficiency.
Track how CPC changes over time. A drop might signal better audience alignment or improved ad copy.
A spike could mean more competition or broader targeting. The context behind the number helps clients decide what changes to make next.
Include the following in your CPC section:
-
Current average CPC - The latest cost per click for the reporting period.
-
Historical comparison - Past CPC from a similar timeframe.
-
Top and bottom performers - Ads or keywords with the highest and lowest CPC.
-
Commentary - Explain what likely caused changes and what actions to take.
CPC isn’t just about cost. It also hints at how well the campaign connects with the audience. Pair CPC with conversion data to get a better picture of ad quality.
Ad Click-Through Rates (CTR)
CTR measures how often people click on your ads after seeing them. It reflects how well the ad copy and creative speak to the audience. If impressions are high but CTR is low, something in the message, visual, or targeting may need attention.
In your PPC report, show CTR by campaign, ad group, or keyword level. A strong CTR doesn’t always guarantee conversions, but it often points to high interest or relevance.
Include these elements:
-
CTR by campaign or ad group - Highlight the top and bottom performers.
-
Device breakdown - Compare CTR on mobile vs. desktop if possible.
-
Ad copy test results - If you ran split tests, show which version earned higher clicks.
-
Next actions - Recommend which ads to pause, refine, or scale.
Clients can’t fix what they don’t understand. Use CTR data to help them see where the ad experience connects with the right audience and where it doesn’t.
General Traffic Metrics Overview
Beyond conversion numbers and ad clicks, your report should include traffic insights that show how people behave after landing on the site. These metrics explain why a campaign did or didn’t perform as expected.
Include basic website performance data such as:
-
Bounce rate - Percentage of users who leave the site without taking action.
-
Pages per session - How many pages visitors view on average.
-
Session duration - How long users stay on the site.
-
New vs. returning visitors - Shows how well the campaign drives new traffic.
These general traffic metrics won’t replace conversion data, but they help complete the picture. For example, a low bounce rate may suggest the landing page supports the ad message. A short session time might mean it doesn’t.
Add one or two lines that connect these metrics back to your PPC marketing campaigns. That way, your client sees the full path, from the click to on-site behavior.
Key KPI Definitions
Many clients see PPC terms in reports but don’t always know how to read them. A short section that explains your most-used metrics can prevent confusion and avoid extra back-and-forth.
Instead of defining every term again, highlight the key performance metrics that relate most directly to the PPC ad campaign’s goal.
For example, a lead generation campaign should spotlight CPA and conversion rate, while an e-commerce campaign may focus more on return on ad spend and total revenue.
Also, group key metrics by function:
-
Engagement indicators - Metrics like CTR and bounce rate help show how well the ad or landing page connects with the visitor.
-
Cost-based metrics - CPC and CPA reveal what it takes to bring in traffic and conversions.
-
Outcome-based metrics - Conversions and ROAS tell you what the campaign returned on the investment.
When you group relevant metrics, you help clients see what each number tells them about the overall campaign performance.
Month-over-Month Data Analysis
Comparing one month to the next helps show if performance is steady, improving, or sliding. Clients rely on this to decide if they should adjust the budget, change the message, or scale successful ads.
Start by showing total advertising campaign performance over the past two or three months. Highlight sharp changes and point out where the results stayed consistent.
Then explain what caused those changes, such as new ad copy, tighter audience targeting, or even outside factors like seasonality.
A clear month-over-month section includes:
-
Visual comparisons - Use simple graphs or side-by-side numbers to show movement.
-
Short commentary - One or two sentences that explain the shift.
-
Next steps - Note what to test, fix, or repeat in the next cycle.
Clients want to know what’s working and what to improve. Month-over-month analysis keeps the reporting process focused on results, not just numbers.
2. Use Digital Marketing Reporting Templates by Industry or Client Type
Not every client needs the same report. A local business and an e-commerce brand care about different results.
Using marketing reporting templates that match the client’s industry or goal keeps the focus on what matters most. These templates save time, improve clarity, and help build client trust from the first page.
Performance Report Summary

Clients often want a quick overview before reviewing the full breakdown. A summary that shows progress on goals, top outcomes, and any major shifts helps set the tone. Use clear visuals and direct language to highlight the numbers that matter.
Focus on total spend, number of conversions, return on ad spend, and whether the campaign met its primary goal. Keep commentary short but meaningful. Mention one area of strength and one opportunity for improvement.
Channel-Specific Report
Not all platforms serve the same purpose. Google Ads may bring in direct conversions, while another channel may support awareness. Breaking performance down by channel helps clients understand where results come from.
Compare spend, CTR, CPA, and conversions across platforms. Briefly explain why certain channels performed better than others, and recommend where to shift the budget based on those results.
Ad Group or Keyword-Level Report
When clients want more detail, this view provides it. Reviewing results at the keyword or ad group level helps explain the why behind campaign performance. It shows what terms brought in quality traffic and which ones wasted spend.
List top keywords, their click-through and conversion rates, and any changes in search volume or competition. Highlight what to pause, adjust, or scale based on the data.
Conversion Tracking Report
Clicks don’t matter unless they lead to something. The conversion tracking report should connect activity to action, showing where leads or sales came from and what it costs to get them.
Break down conversions by channel, ad group, or campaign. Show trends over time and mention any issues with tags or tracking setup. Clients want confidence that the data is accurate and tied to real outcomes.
Budget and Spend Report
Clients want to know how ad costs impacted campaign results and whether their investment paid off. A well-structured budget and spend report compares projected and actual spending, broken down by platform or campaign. It also tracks how efficiently that money produced conversions.
By reviewing this data over time, clients can spot where budget shifts led to better results. For a PPC agency managing several accounts, this report supports stronger budget control and makes client reports easier to digest.
When clients can trace every dollar back to a result, they gain more confidence in your strategy.
A/B Test or Experiment Report
When running split tests, the goal is to make decisions based on performance. An A/B test or experiment report presents a direct comparison of two variables, such as audience segments, messaging, or landing pages.
Instead of simply stating which version performed better, the report explains why the difference matters. Results should include relevant ad data such as CTR, CPA, and conversion volume.
These findings often reveal subtle shifts in user behavior and support PPC reporting goals tied to continuous improvement. One test can reshape how you approach future messaging or audience targeting.
Cross-Channel Dashboard Report
Campaigns running across multiple channels often generate fragmented insights. A cross-channel dashboard consolidates that data into one report, which makes it easier to evaluate performance across Google Ads campaigns, Microsoft Ads, and social media.
This report helps identify trends in channel efficiency, spend, and conversion value. It also clarifies which channels support different stages of the customer journey, such as awareness, engagement, or final conversion.
Geographic or Demographic Report
Results vary across regions and audiences. A geographic or demographic report shows where campaigns perform best and which segments generate stronger returns. When tracked over time, these patterns help shape smarter targeting strategies.
Highlight performance by city, device, age group, or gender. Look at metrics like CPA and ROAS for each segment.
For businesses managing multiple PPC campaigns, this view shows where future spend will drive the highest return. Reports like this also support actionable insights that go beyond surface-level performance to guide deeper campaign planning.
3. Automate Data Collection and Report Generation
Reporting takes time when done by hand. Automating the PPC reporting process removes that delay and helps teams scale their efforts without sacrificing quality.
What Automation Fixes in the Reporting Process
Smart automation improves consistency, reduces mistakes, and frees up time for analysis and campaign planning. For PPC agencies managing multiple clients, automation replaces dozens of hours spent building manual reports.
Automation can support several key goals:
-
Consolidate ad metrics - Pull live data into platforms like Google Sheets using built-in connectors or APIs.
-
Build templates once - Create a custom PPC report per client that refreshes automatically with updated KPIs.
-
Reduce errors - Use automated reporting tools to avoid copying incorrect numbers between tabs.
-
Schedule delivery - Send reports with just a few clicks at the end of each week, month, or campaign.
-
Add depth with blended insights - Combine PPC campaign results with Google Analytics data to highlight on-site actions like bounce rates and conversion paths.
Advanced PPC reporting strategies often rely on custom reports that blend visual dashboards with clear goals. These reports not only show what happened but also support performance recommendations with real-time accuracy.
When the PPC reporting process runs on automation, teams can focus less on formatting and more on delivering actionable insights.
4. Create Unified Cross-Channel Dashboards
When campaigns run across several PPC platforms, it’s easy for performance data to get scattered. Without a central view, teams lose time switching between tools and miss patterns that could improve results.
A unified dashboard brings all metrics together to help you evaluate your advertising efforts more clearly and optimize campaigns with fewer steps.
With the right setup, dashboards make it easier to compare channels, track conversions, and spot trends faster. TapClicks offers a simple way to build these views, even for agencies managing dozens of clients.
TapClicks helps agencies scale PPC reporting with ease. Start your free 14-day trial!
How to Set Up a PPC Dashboard in TapClicks
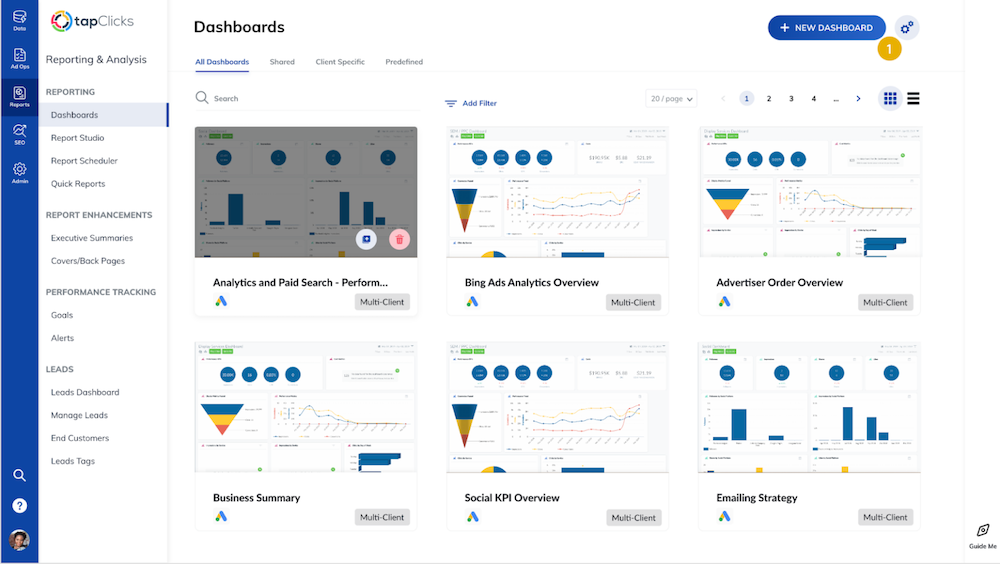
You can begin with one of TapClicks’ pre-built dashboard templates or build one from scratch. Most agencies prefer starting with a template and then tailoring it to match each client’s reporting goals.
Popular templates include:
-
Paid search and analytics – Covers core PPC performance metrics
-
Social KPI overview – Tracks performance across Facebook, LinkedIn, Twitter (X), and more
-
Executive overview widget – Displays high-level KPIs like CTR, average CPC, and conversion rate
What sets TapClicks apart is the ability to use a master template across all client dashboards. When you update the master, changes apply everywhere. That means no manual edits across dozens of accounts.
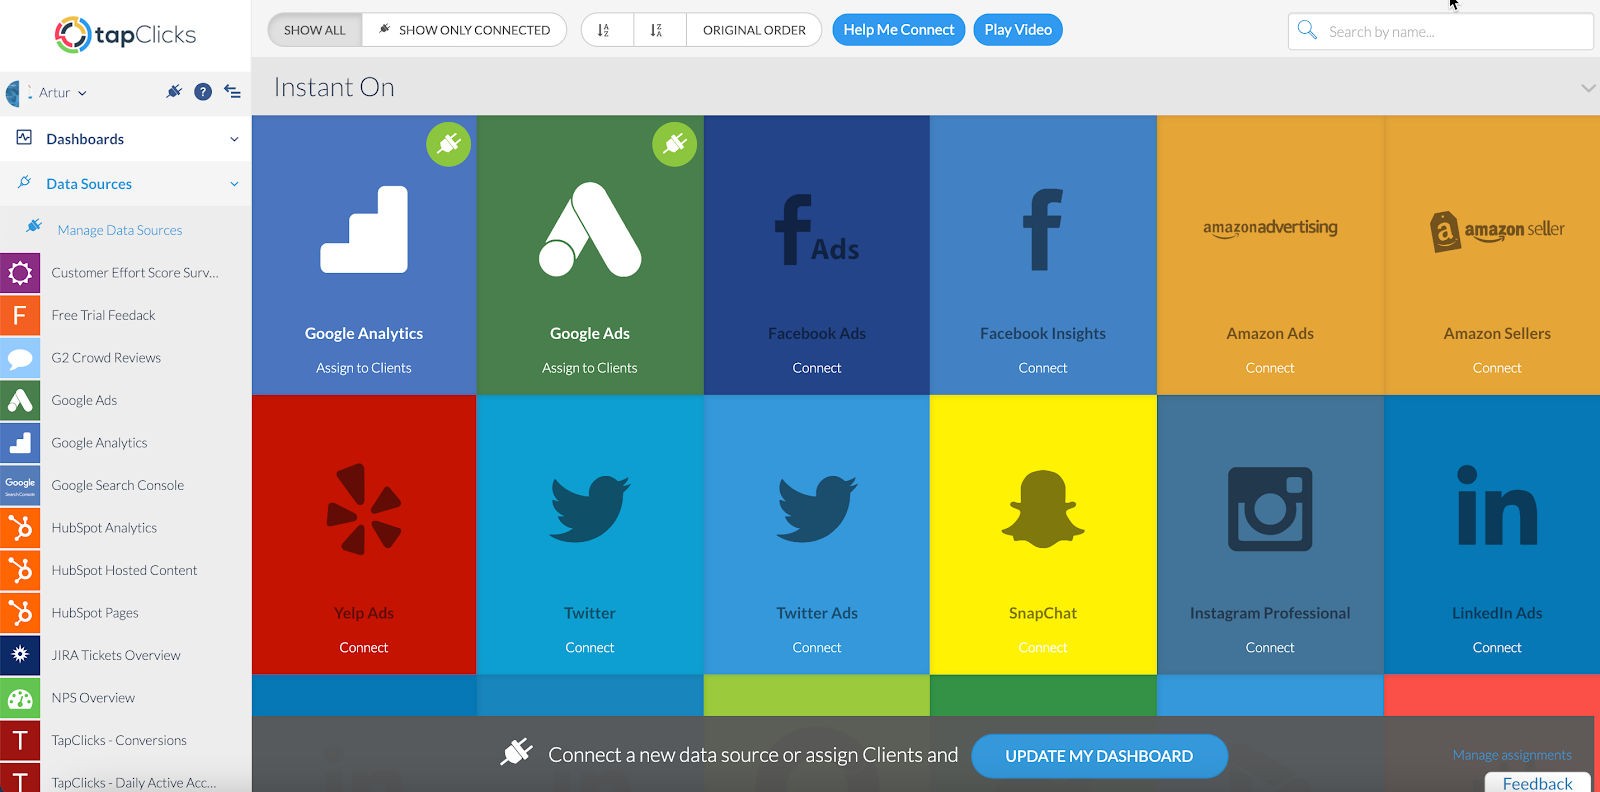
Connect Your Data Sources to Start Pulling in Data
After your template is in place, the next step is to link your ad platforms and tools. TapClicks supports more than 250 live integrations with marketing sources.
Key connections for PPC reporting include:
-
Google Ads and Google Analytics
-
Facebook Ads and LinkedIn Ads
-
Bing Ads and Twitter (X) Ads
-
eCommerce platforms, SEO tools, and CRM systems
To connect, log into each account through TapClicks. The platform begins pulling in campaign data the same day, with no need to manage APIs or monitor for platform changes.
You can also import up to 12 months of historical data to start with performance context.
Creating and Editing Dashboard Widgets
Dashboards in TapClicks are built using widgets, each showing a specific set of metrics in a format you choose. You have full control over layout, style, and data source.
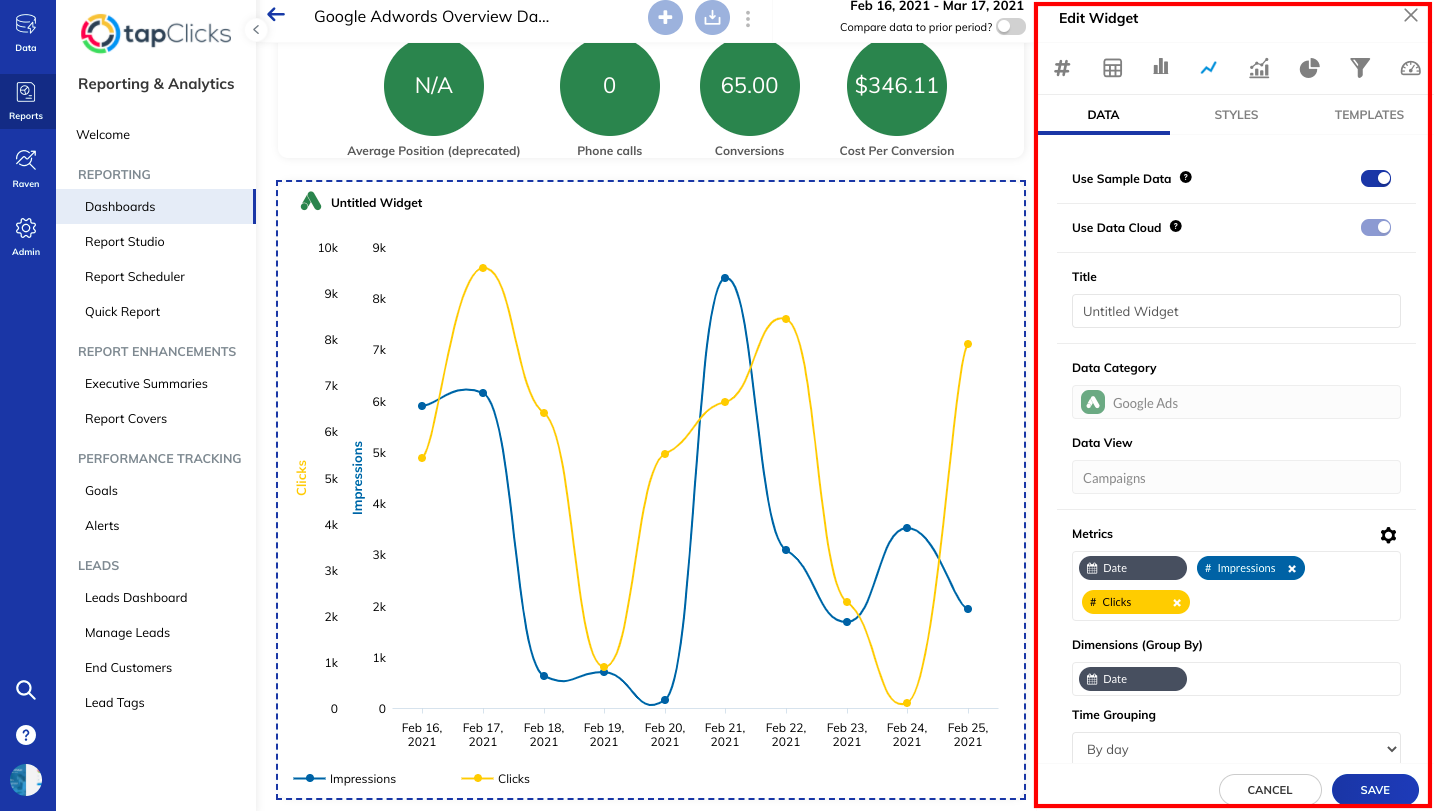
To create a new widget:
-
Choose the platform you want to pull data from
-
Select the metric or KPI to display
-
Set a time range (e.g., last 30 days, this month, custom date)
-
Pick a visualization type (chart, graph, table, etc.)
-
Add it to your dashboard layout
Each widget updates automatically and becomes part of your custom PPC report. You can organize them by campaign, audience, or any structure that fits the client’s goals.
Create White-Label Reports
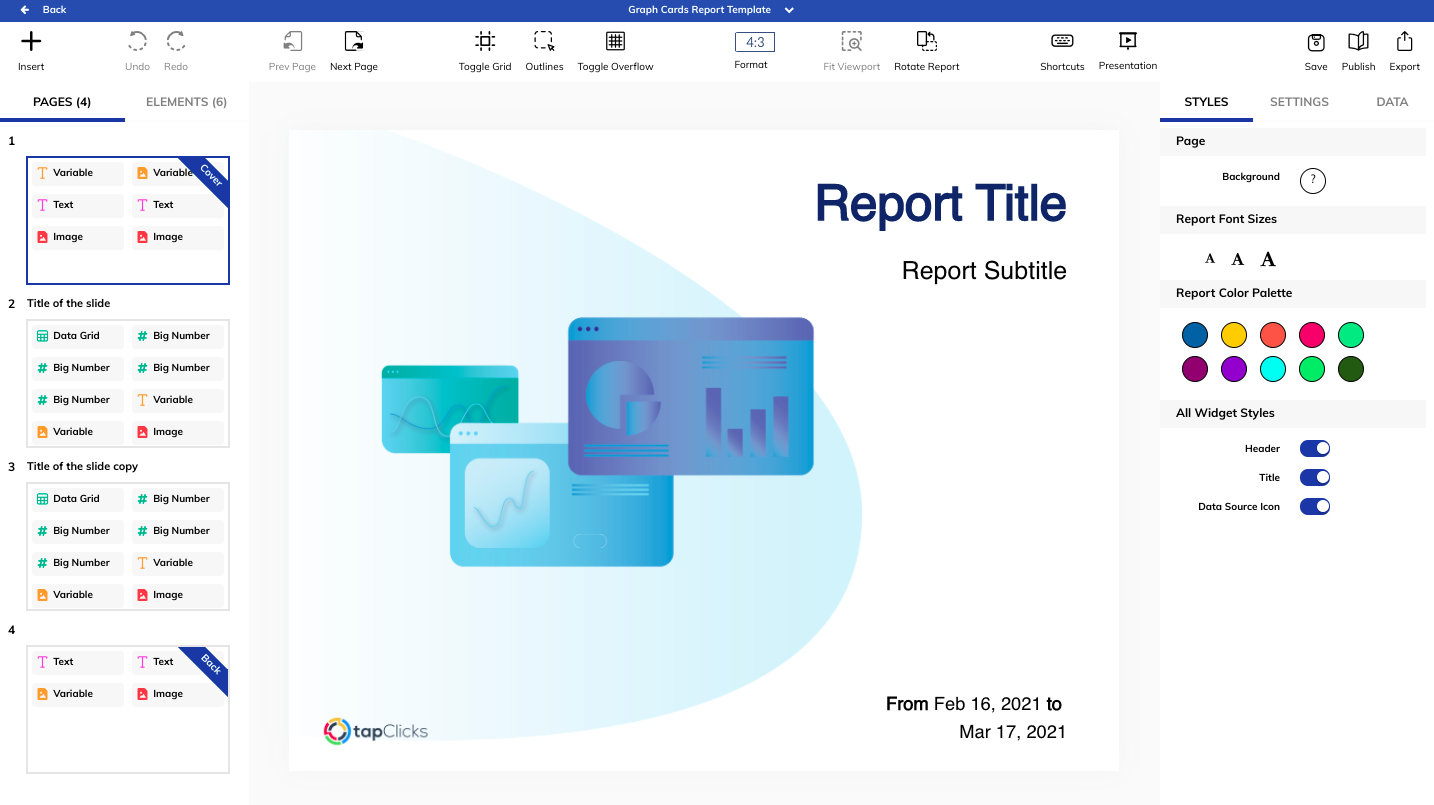
With your PPC data already organized and refreshed in real time inside TapClicks, building and delivering reports is fast and straightforward.
You can generate reports that are fully white-labeled, structured for clarity, and focused on performance goals.
To build a client-ready report:
-
Start from scratch or choose from a pre-designed report template
-
Use channel-specific layouts for platforms like Facebook Ads or YouTube
-
Pick service-based templates for PPC marketing, SEO, or multi-channel reporting
-
Drag and drop data blocks using Report Studio, just like slide creation in PowerPoint
-
Add both visuals and live data, not just static graphics
-
Use executive summary slides to add context, recap client goals, or highlight strategy updates
-
Tailor each report to reflect client expectations, previous performance, and current KPIs
These reports help tell the full story behind the numbers.
Schedule Your Reports to Send Automatically
After finalizing the report, you can schedule it to send on a recurring basis. It helps maintain consistent communication without repeating manual tasks.
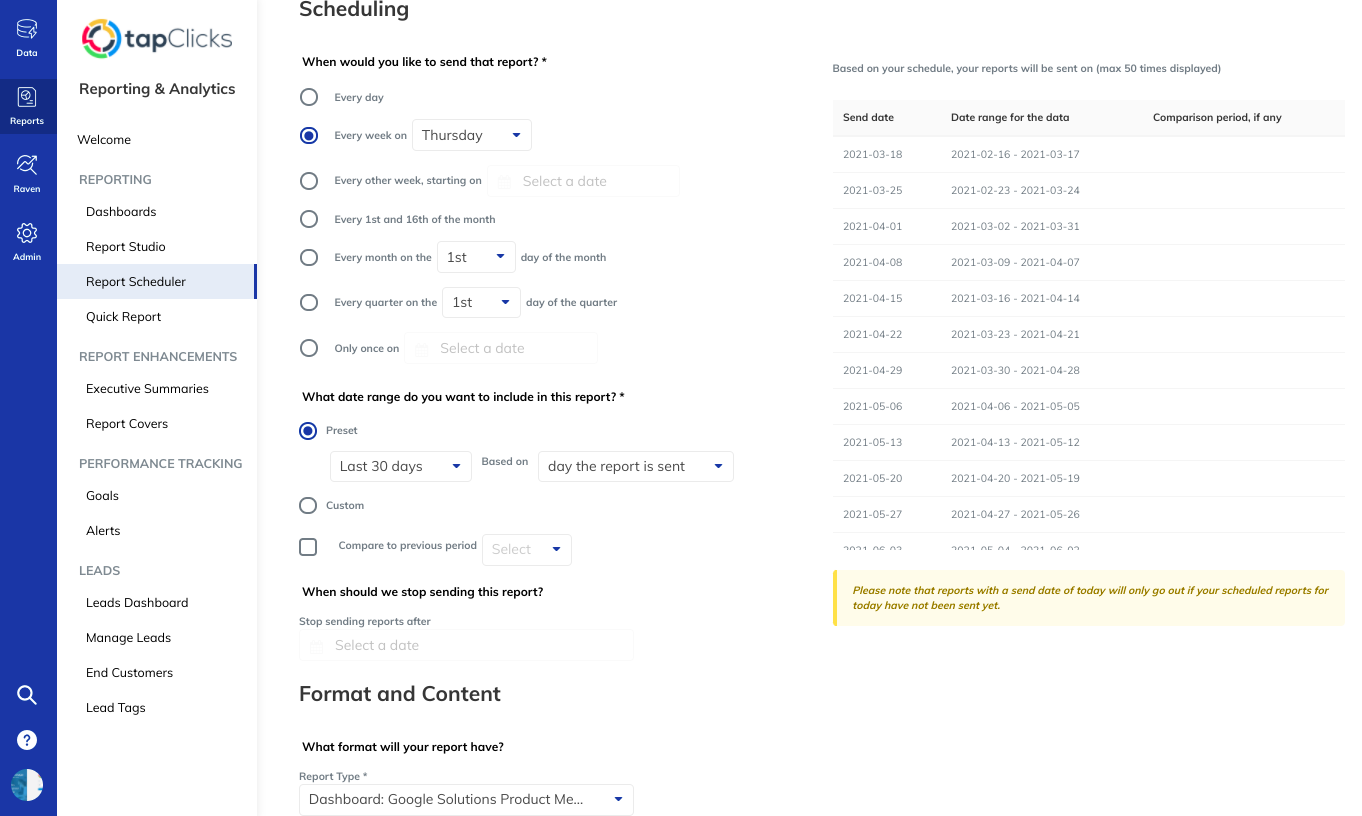
Set up your report delivery by selecting:
-
How often to send it (daily, weekly, every other week, 1st and 16th, monthly, or quarterly)
-
The reporting date range to include (such as last 7 days, current month, or a custom range)
-
A stop date, if the report only runs during a specific time frame (for example, a 6-month contract)
-
The file format to send (PDF, PowerPoint, CSV, and other supported types)
-
Whether to generate a Quick Report for on-demand requests from clients
Automating delivery lets you keep clients updated with less effort while staying consistent across multiple accounts.
Set Custom Access Permissions to Further Reduce Reporting Tasks
Another way to significantly reduce the time you spend creating and sending reports for clients is to give them access to their own PPC dashboard.
TapClicks lets you set custom access permissions and annotate your metrics.
So your client only sees what you give them access to, and they can view any notes you provided to help them better understand what a metric means in the context of overall PPC performance.
This lets your clients look at their report when they want, versus reaching out to you and asking for a last-minute update.
Turn PPC Data Into Client-Friendly Reports With TapClicks
Marketers spend way too much time reporting on campaign performance. They’re too busy editing rows and columns and making changes to dozens of different PPC reports.
As a result, they have less time to focus on revenue-driving tasks, like improving return on ad spend (ROAS) or reworking campaigns to meet a client’s goals.
To get ahead of the curve and to efficiently demonstrate value to your clients, you can use TapClicks’ customizable PPC dashboard to cut down on the manual tasks your team has to do.
With TapClicks, you can:
-
Make changes to show key metrics in one dashboard template, and have those changes be reflected across all clients.
-
Bring in data from nearly any platform (whether search engine or social media tools) to contextualize your data or get all of your PPC data sets into one dashboard.
-
Create and schedule recurring white label reports tailored towards your clients.
-
Set client permissions that let your clients log in to a client-friendly dashboard and view data without waiting for a report.
By using these tools, your agency can quickly bring on new clients (and scale up services with existing clients) without having to worry about bottlenecks forming or a dip in performance.
Turn campaign chaos into clarity with TapClicks PPC dashboards. Book a demo today!
FAQs About PPC Reporting for Clients
What is PPC reporting?
PPC reporting is the process of tracking and presenting data from paid advertising campaigns to measure performance against business goals. It helps marketers understand which ads reached the target audience and what actions they drove, using metrics like CTR, CPA, and ROAS. Tools like Google Data Studio are often used to visually organize this information for clients or internal teams.
What is the best PPC reporting tool?
The best PPC reporting tool depends on your needs, but TapClicks is ideal for agencies that want automated reports across multiple platforms. It offers real-time dashboards, client-ready templates, and seamless integrations with Google Ads, Facebook, and other PPC sources.
How do you conduct a PPC audit?
To conduct a PPC audit, review account structure, ad relevance, budget allocation, keyword performance, targeting settings, and landing page alignment. Check historical data, assess conversion tracking accuracy, and identify areas to improve ROI or cut waste.
How do I monitor PPC?
You can monitor PPC performance by tracking key metrics like impressions, clicks, conversions, and spend daily or weekly using a reporting platform. Reviewing this data helps you adjust bids, test new creatives, and improve campaign relevance for your target audience.