
Why You Need a Tool That Does More than Your Marketing Data Analysis

Many people define marketing data analysis in extremely general terms, like getting insights from data, but that's not a helpful definition it's obvious and not specific to marketing. The goal of marketing data analysis is actually quite specific: figuring out whether any and which of your marketing campaigns are working and quantifying how well they're working.
One key aspect of marketing data, though, is that it's diverse. Marketing teams run different campaigns on different platforms that work in different ways. As a result, the data these platforms generate can be very different.
Some of this data, and therefore analysis, is straightforward. For example, tracking clicks, cost per click and the number of conversions for a PPC campaign will tell you how well it's working with a high degree of accuracy. But analyzing the success of some channels, like radio, broadcast and display ads, is more complex, and it's not immediately obvious how success is even measured. Typically, for campaigns like these, several metrics and data sets need to be correlated in order to measure performance.
And, if you're a big brand, there are even more difficulties as you'll want to analyze performance by sub-brand, product line or geographical location.
As a result, marketing data analysis is not one thing. It can span from the trivial (sort Google Ads campaigns by lowest cost per lead) to the complex (find correlations between radio ad spend in a region and digital ad costs and ecommerce sales in that region to see measure the effect of radio ads on each). The latter leads to a key characteristic of marketing data analysis: advanced analysis of marketing performance inevitably involves multiple different data sets from different platforms.
In addition, for most agencies and in-house marketing teams, marketing data analysis is also repetitive. Marketers have to update stakeholders (whether it be clients or executives) on the performance of the same campaigns weekly, biweekly, or monthly.
If a marketing team's analysis and reporting processes are inefficient (e.g. manually downloading data from dozens of platforms), it doesn't just waste employee time once, it wastes it over and over, every time the team has to update its reports.
For all of the above reasons, to do marketing data analysis well, marketers need one or more tools that:
- Connects to all your data sources and automatically pulls the data from each
- Stores the data in a data warehouse that's accessible to marketers (no database programming skills needed)
- Automates complex and repetitive calculations so you don't have to waste time calculating the same metrics every reporting period
- Presents the data analysis in powerful reports for clients and stakeholders
In this post, we'll explain the specific challenges of marketing data analysis in more detail, we'll discuss what tools and methods marketing teams typically use, and then we'll walk through how our solution, TapClicks, fulfills each of the key features we described above.
- The Challenges of Marketing Data Analysis
- Tools and Methods Marketers Typically Use
- How Our Tool TapClicks Solves the Marketing Data Analysis Challenges
If you're interested in how TapClicks could work as a marketing data analysis tool for your organization, you can try it free for 14-days or schedule a demo to learn more.
The Specific Challenges of Marketing Data Analysis
There are some marketing channels that can be analyzed easily and accurately. For example, the nature of PPC means that it's straightforward to track the CTR (click-through rate), the cost of each click and the correlating website conversions.
But there are more complex scenarios which are challenging to analyze, especially where campaign attribution is concerned.
Here are two examples.
Analyzing Multiple and Complex Data Sets
Working out campaign performance for data sets that need correlating and comparing (e.g. radio and broadcast) is a difficult task when you're doing marketing analytics. First, they're on different platforms, and second, they are difficult to measure.
For example, there are several methods of calculating how many sales a TV or radio ad produces, including evaluating website traffic during the time the ad ran, sharing a unique URL as part of the ad message or tracking activity by time frame or geographical region. Tracking and evaluating the different data sets (including consumer behavior) is complicated and tedious work. You can read more about the challenges of radio analytics specifically in this article.
Likewise, it's complex to work out how well a display ad performed. Display ads don't just result in leads from potential new customers clicking on the ad. They increase brand awareness and motivate conversions of other channels. For example, a user has seen your display ad all over the internet for the last couple of weeks, then they see a paid social ad with a product promotion and then they click and buy. The social conversion rate was influenced by the display ad but it's difficult to measure that.
Bringing in data from multiple sources and doing data analytics on the correlation and comparison of those different marketing activities is essential for effective marketing analysis.
Understanding Marketing Performance by Sub-sectors
For big brands, analyzing performance by sub-sector is key to understanding how your marketing efforts are doing and to inform marketing strategy and decision-making.
It's relatively easy to measure performance for a national campaign but when you want to break that down into sub-brands, product lines or by location, things become more complex.
For example, if you are a national chain of fast-food restaurants, not only will you want to consider results for overall performance but you'll want to break it down into regions or even individual restaurants. And you'll want to do this for each marketing campaign, whether it be social media, broadcast or display.
As with the example above, this becomes hugely complex. Let's take a look at how marketers typically handle this type of data analysis.
What Many Marketers Do
#1 Manual Analysis
Marketers with only a few campaigns or clients typically gather data manually by going into each platform separately and downloading the data into a CSV file or spreadsheet and then pulling that together with other data sets into one file or database. Then, they spend time organizing the data or normalizing it for example, deleting extra columns, standardizing date formats, etc.
This is hugely time-consuming work and becomes almost impossible to do once the number of campaigns or clients gets to a certain level.
#2 Using a Data Team to Code a Process
Agencies or brands of a certain size often deploy a data engineer or data team to code home-built solutions to do the manual work (#1) for them. This involves pulling data using public APIs from different marketing platforms and storing it in a database or data lake.
The downside of this is that home-built data integrations need constant maintenance and resources to ensure that the APIs work correctly and that new ones are included. It also means that marketers are reliant on the data team to do this for them as they don't typically have the necessary coding skills to access the database themselves.
#3 Using ETL and BI Tools
Many marketers use analytics tools to help with marketing data analysis. In order to use those tools, they either use one of the two methods above or they use an ETL (extract, transform, load) tool to gather their data first. An ETL tool acts as a connector that moves data from one location to another by extracting it from various data sources, transforming it by normalizing it and then pushing it out to a database or a data analytics tool such as a BI (business intelligence) tool that does analytics and visualizations.
One disadvantage of many ETL tools is that they do not connect to all your data sources meaning that you still need to do some data collection manually or have a custom-built solution. And, whether you're pushing data to a database or a BI tool, you'll probably need the help of the data science team to access it. Plus, many BI tools are complex to use so while they do produce impressive data analysis, they are not always marketer-friendly.
Ideally, marketers want an easy-to-use solution that helps with the entire data analysis process from gathering data from all your sources to marketing analysis and reporting, with no coding required.
Our tool TapClicks does exactly this.

How TapClicks Solves the Challenges of Marketing Data Analysis
TapClicks is an all-in-one marketing data platform that solves the marketing data analysis challenges we outlined above:
TapClicks Connects to All Your Marketing Data Sources
The main challenge for doing marketing data analysis is pulling all your data together so you can do the data analysis for all your digital marketing channels (and others) in one place.
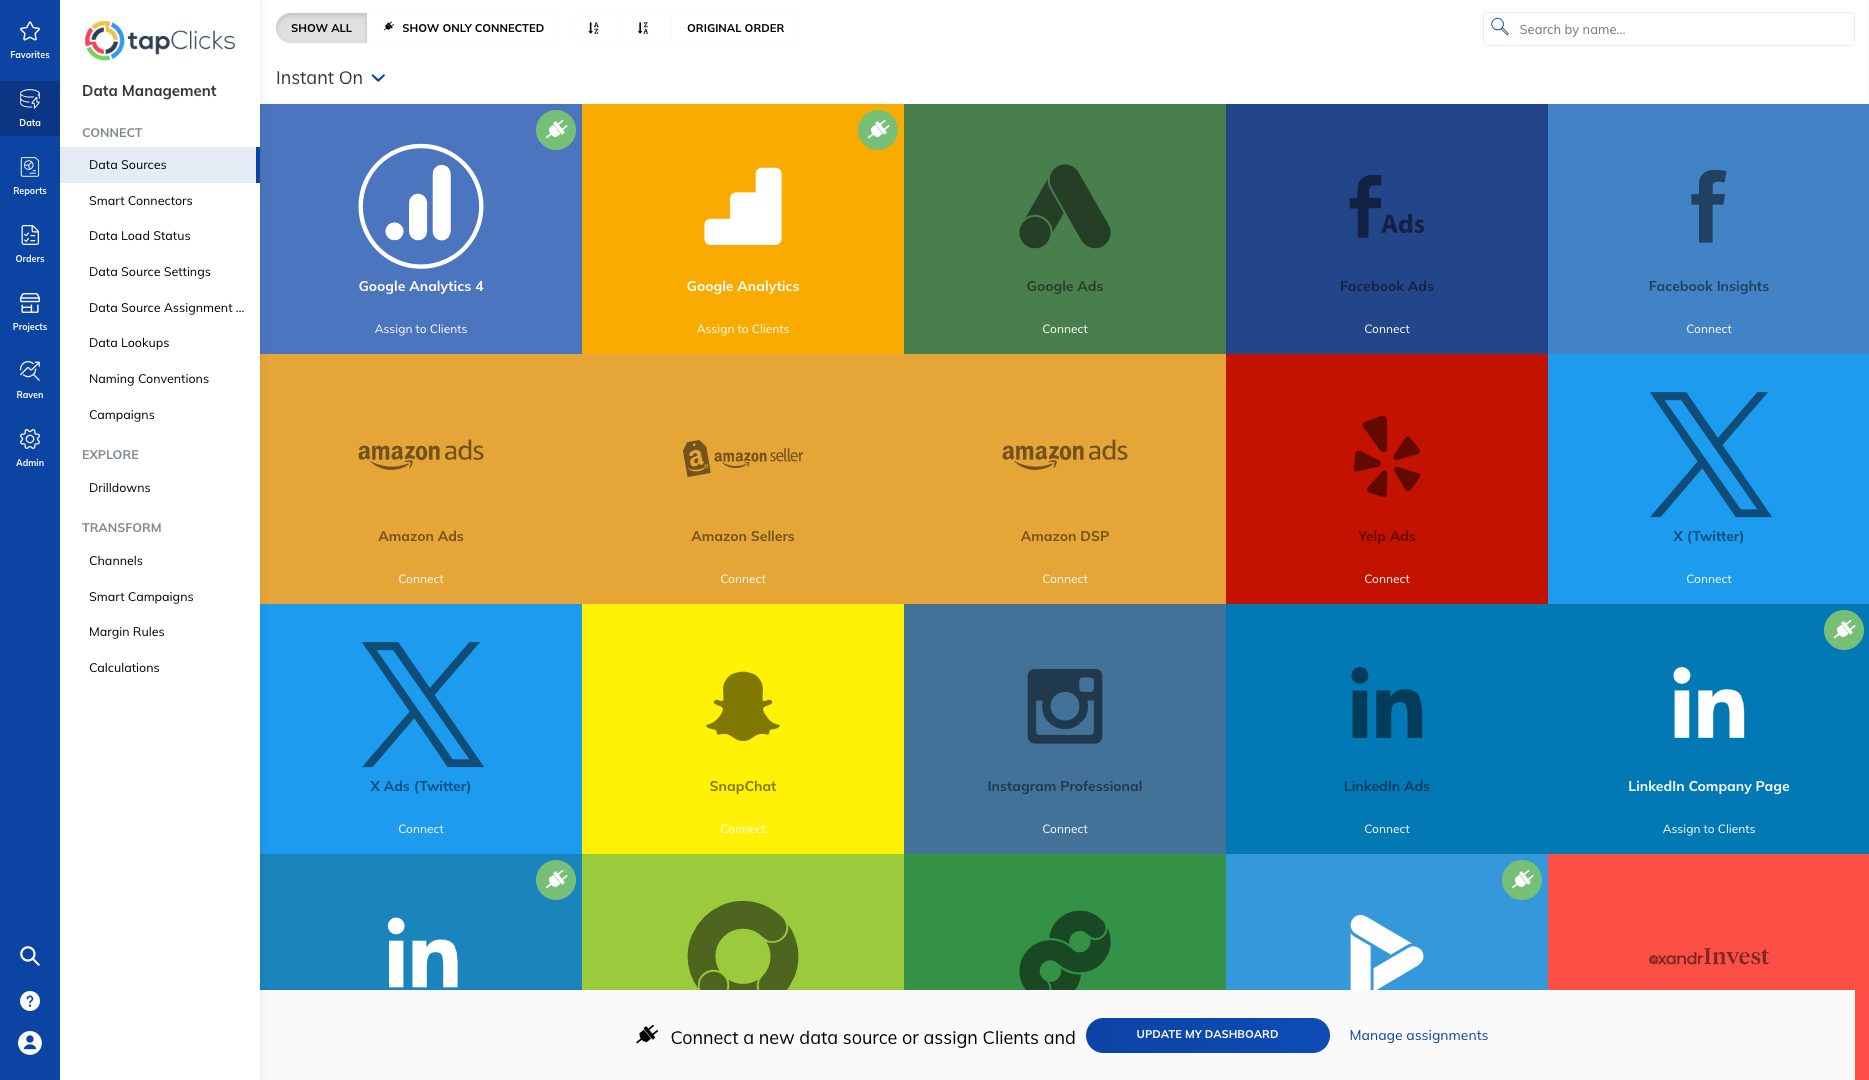
Specifically designed for marketers, TapClicks connects to thousands of marketing data sources easily and automatically with no coding experience required. Our Smart Connector tool can connect to any data source including home-built data sources and, in many cases, 12 months of historical data can be integrated too, and used in your data analysis.
We also have hundreds of pre-built API-based data connectors to all the key marketing platforms (e.g. social media, Google Analytics, CRMs, search engines) as well as many lesser-known ones (e.g. Genius Monkey and Tiger Pistol).
Once you've set up your data connectors, your data will be pulled through immediately (in near real-time) and TapClicks will continue to extract it automatically every day or whenever you choose to refresh it.
Unlike a custom-built solution, TapClicks manages all the API connections for you so, if one breaks, you don't need to ask your developers to look into it because TapClicks will take care of it for you.
TapClicks Serves as a Data Warehouse Accessible to Marketers
Instead of waiting on data teams to do the work, marketers need to be able to access their data easily so they can do data analysis and create visualizations themselves.
TapClicks stores your data in your own fully-managed data warehouse forever. Many of our users have years of data which can be incorporated in marketing analytics. Marketers can use the TapClicks platform as a central hub and do all their calculations and analysis right there, with no coding experience required.
You can read more about TapClicks marketing data warehouse in this article.
Automate Complex and Repetitive Calculations Once Only with TapClicks
As we discussed earlier, marketers need to do complex calculations (e.g. comparing metrics from different campaigns), comparisons, and correlations of different data sets in order to create meaningful data analysis that informs marketing decisions. Doing this is difficult if you're doing it manually or with third-party tools (e.g. ETL and BI tools).
With TapClicks, it's easy for marketers to set up or define advanced calculations once only and have those calculations executed anytime in the future.
Here are a couple of examples:
Customize and Combine Metrics
Marketers are often tasked with analyzing and reporting on metrics from different marketing platforms that have unique names that effectively mean the same thing. For example, a social media agency may need to report all social media engagement to clients, which includes follows, retweets, and likes on X (Twitter), subscribes, views, and likes on YouTube, and similar metrics on Facebook, Instagram, and more.
Normally, reporting on a Total Engagement metric like that is tedious: every month, the team has to add up likes here and follows there, track it in a spreadsheet, and then use it for data analysis or visualization.
But with TapClicks, you can define an umbrella term once and it will remain available and updated with the latest data for all future marketing analysis and reports.
For example, you could create a new term inside TapClicks called Total Social Engagement and define it as the sum of post-reactions on Facebook, views on YouTube, or click-throughs on LinkedIn (see below).


Once that custom metric is defined, it will be available in TapClicks forever, with updated data, so you never have to manually add up those engagement metrics again.
For any analysis you do in the future, you can just drop in the metric Total Social Engagement (or a graph of this metric over time) into a dashboard or report and TapClicks will automatically calculate it based on how you defined it and have the number or graph ready for you.
This level of automation saves a huge amount of time.
Analyzing Sub-brands and Location Variances
We've already mentioned how big brands and agencies need to analyze data in segments such as sub-brands, product lines, and geographical locations. You can do this easily by automating advanced calculations in TapClicks.
For example, if you are a tire manufacturer and you want to view your data by brand, but you have multiple ad campaigns running for different brands, you can set up advanced calculations that find the specific brand names in the campaign names and aggregate stats across all of these into single metrics for that specific brand.
In our example below, we can see that there are 266 Facebook Ad campaigns, all pulling in data from our data sources.
We've decided to name a certain segment of those campaigns HNP Campaigns' (see arrow on the right-hand side).

This means we can now pull data for just those HNP campaigns into any report or dashboard we want to create.
In this example, there are 191 of them and it pulls the data for all of those campaigns into one line (see arrow on the right-hand side).

You can use this function to group and view data by all types of location or by any segment you like product, campaign type, or group, and zoom in and out as you need to.
You can also calculate the overall click-through rate by adding up clicks across many campaigns and dividing by total impressions. You could calculate cost per click for campaigns across a region or specific product lines by adding up total spend and dividing by total clicks. The possibilities are endless.
And, as with everything in the TapClicks solution, you only have to set these up once. From there, calculated metrics are up-to-date and ready for you to report on every week or every month.
Create Automated Data Analysis Reports That Are Always Up-to-Date
Once you've defined the metrics and advanced calculations you want, your marketing data analysis can be displayed and shared with stakeholders in two ways: (1) Dashboards and (2) PowerPoint-style Reports.
View Marketing Data Analysis via Dashboards
With TapClicks you can display your marketing data analysis via customizable dashboards. Most users start with our ready-made dashboard templates (which include social media marketing channels, ad networks, etc.), or you can create your own template from scratch.
Dashboards can be customized to suit individual campaigns or clients and configured to include whichever metrics (we call these widgets) you set up. For example you could include the Total Engagement metric we discussed earlier and view this alongside the pricing information and KPIs for the social media campaigns to work out your ROI (return on investment) for those initiatives.
You can then visualize your analysis in whatever type of chart you wish graph, pie-chart, bar chart, etc.

The benefit of creating dashboards within the TapClicks platform is that they can be used as templates. Agencies can create one dashboard for a specific type of report (e.g. business analytics or web analytics) and this can be used across all clients by filtering the data to each one.
Here's a short video on how to create a dashboard in TapClicks:
View Marketing Data Analysis via Powerful Reports
Marketers can also send their marketing data analysis to clients and stakeholders via reports with TapClicks ReportStudio.
You can create PowerPoint-style reports that are automatically updated with your latest data and schedule them to be sent out whenever you want.
As with the dashboards, you can use our white label templates as a starting point and customize as many different reports as you like (e.g. PPC report, SEO report, marketing trends, etc.). And you can create a master report template which you can use across several campaigns or clients by using the filtering feature.
For agencies with multiple clients this optimizes many layers of tedious work, saving a huge amount of time.

As with so many features of the TapClicks solution, set up the reports one time and they'll be there, ready to distribute to your target audience (e.g. clients or executives) whenever you choose so they can review the profitability of their marketing dollars.
Here's a video showing how to schedule reports in TapClicks Report Studio:
Push Data Out to Another Data Analysis Tool
While TapClicks handles the entire marketing data process including marketing data analysis, you can also use the platform to integrate with other data visualization tools, if you prefer.
For example, you could use TapClicks to collect and store your data and have it push the up-to-date data to another analytics platform such as Tableau or Google Sheets. You can read more about TapClicks integration with Google Sheets in this article.
Want to Try TapClicks as Your Marketing Data Analysis Solution?
We've discussed why it's important to have a solution that not only does your marketing data analysis for you but also does the other essential steps in the process: (1) Gathering all your data, (2) Storing your data in one place, (3) Automating advanced calculations and, (4) Creating powerful reports to display and distribute your data analysis to clients and stakeholders.
TapClicks is a flexible solution accessible to marketers (with no coding skills needed) that does all these steps, allowing enterprise-level marketers to scale their businesses as needed.
If you're interested in how TapClicks could work as a marketing data analysis tool for your organization, you can try it free for 14-days or schedule a demo to learn more.