Let's get mathematical. To calculate the average of anything, all you have to do is add up all of the numbers that you are including in your calculation. Then, you divide them by how many numbers there are. Finding the mean is just the sum divided by the count.
While calculating the average is simple math, the average marketer doesn't have the time to pull out his or her calculator and manually find the average. Thankfully, powerful marketing data analytics programs will do the math for you. This way, you can simply click a button to find the mean in order to understand important marketing insights like average:
- Customer value
- Spend on routine tasks
- Advertising spend
- Cost per click
- Sale price
- Life cycle of a new customer
- And the list goes on&
To help guide you, here is how to find the average of common metrics in some of the most common data analytics programs that marketers use.
How to find average monthly visitors in Google Analytics
To find average monthly visitors in Google Analytics, click on Overview, then All Accounts. Then, click view report and then select the date range of interest. Once you have selected the month, click apply, scroll down to site usage, and write down the number for either number of visits or number of page views. Then, repeat this process for all months of interest. Once you have all the numbers for each month, add all the numbers together for each month, and then divide them by the total amount of months. This will give you the average monthly visitors.
To make this process a bit easier, consider using a data analytics tool where you can create a different dashboard for each quarter (Q1- dashboard, Q2 dashboard, etc.). Then, you can use a metric like average daily unique visitors and/or average monthly unique visitors. Then, you can compare data from Q1 and Q2, respectively, to monitor growth.
Much easier than pulling out the calculator.
How to Calculate the Average Cost Per Click
Average cost per click is another common metric for marketers. You can calculate this by adding up your actual costs-per-click and dividing it by the number of clicks you get. For example, if one click cost .10 and another cost .30 and you divide that by 2, the average CPC is .20.
Again, all that math can be a pain. Instead, you can find your average CPC amounts in the average CPC column on your Campaigns tab in Google AdWords.
This tab is also a metric you can include in any top-of-the-line marketing analytics dashboards.
How to Calculate the Average Session Duration
Average session duration is a mean that most analytics programs offer in the standard dashboard. For example, if you head to your Google Analytics account, you can click on Audience, and Overview. Right in the dashboard, you can see the average session duration.

What's significant about a marketing analytics dashboard is that you can see all of your average session durations for all important platforms in one location.
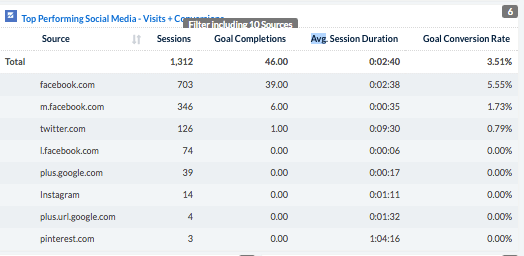
In Tapclicks, for example, you can see information about all your top performing social media accounts. This information is in one location. When you view the average session duration data, you can see which platform is holding your customers' attention the longest.
And there you have it! Calculating the average is an easy mathematical process. But, it's even easier when you use amarketing analytics dashboard platform.A marketing analytics dashboard will calculate and display the averages for you.