
4 Key Factors to Look for in an Effective Data Warehouse Automation Tool

There are many data warehouse automation (DWA) tools available that vary in scope, capability and cost. So, being specific about exactly what type of data your organization will be primarily dealing with (e.g. marketing and business performance data, operations, factory or machinery data, etc.), is critical when deciding what tool may be best for you.
Likewise, capturing, storing and analyzing all your data in one place and distributing it from there too, at scale, is a problem faced by many enterprise companies who are handling an ever-increasing volume of data currently siloed in many different places.
Typically, enterprise businesses use a number of disparate tools to patch together a solution to meet this challenge. They use tools such as Extract-Transform-Load (ETL) services, data warehousing platforms, Business Intelligence (BI) tools, and dashboard and reporting tools.
But using different tools and services requires a great deal of time consuming work to ensure that you have the functionalities and connectivity you need for your data management. And, when you're handling big data, this can become a real headache.
With these issues in mind, we think there are 4 essential factors you should look for in a data warehouse automation tool.
A good tool should:
- Collect data from any source you want, including all your sales and marketing data, automatically on an ongoing basis.
- Store all your data (including historical data) in one central fully managed data warehouse, so you don't have to collate it yourself from different places.
- Create compelling data stories/analytics, allowing you to normalize* your data, manipulate it and do data transformations.
- Distribute your data wherever you want in a variety of formats, whether that's to a reporting function within the TapClicks platform or to an outside source.
*Note: By normalize, we mean you can organize your data to appear in a standard way across all records and fields. We'll discuss this in more detail in section #3, below.
We created TapClicks to handle the entire data management lifecycle for you in one scalable marketing and data operations platform from the planning and execution stages through to analysis and distribution.
In this article, we'll explain what we mean by data warehouse automation and then we'll walk you through how TapClicks meets each of the 4 essential characteristics we outlined above.
Want to see how easy it is to use the TapClicks data warehouse automation features? Try our free 14-day trial.
What Is Data Warehouse Automation?
Broadly speaking, data warehouse automation describes the way technology helps streamline processes to enable businesses to work more efficiently and effectively. This can include pretty much every business department in existence from the factory floor right through to sales and marketing.
At its core though, is the management and storage of vast quantities of business data, specifically sales and marketing data (although it can include any kind of data), from various disparate sources, and being able to analyze and deliver that data in a meaningful way to a variety of audiences.
Why Enterprise Businesses Need Data Warehouse Automation
As we've already mentioned, most companies, but particularly enterprise businesses, have a data problem.
Let's consider a large, enterprise brand (big brand) as an example. A big brand will use an agency or more than one agency to handle its multiple marketing campaigns (e.g. display advertising, SEO, PPC, etc.). Those agencies will each hold some data from the campaigns that they run, and they may have to extract that data from various different sources (e.g. Google Ads, Facebook Ads, etc.).
In addition to that, our big brand will have partnerships with other service providers (e.g. AffinityX or Umbrella) who hold some of their other data but also have partnerships with original equipment manufacturers (OEMs) and aggregators like Kenshoo who, in turn, work with various service platforms.
We can quickly see how complex handling all these data sets becomes, going into each platform manually to pull the data or having different tools which do this for you. And there are issues of data ownership and control to consider too when data is housed in different places.
And the problems are similar when you want to analyze, report on and distribute your data many hours are spent every week manually doing calculations and manipulating data within spreadsheets, plotting graphs, etc. And this work needs to be done every single time a report is due.
It's a time suck for IT and data staff and it's costly too. This is why many businesses who handle large amounts of data, whether it's marketing or business performance data like our big brand example above, or other types of industrial, factory, or other big data, want a data warehouse automation software tool which will bring all the data into a central enterprise data warehouse.
However, there are not many platforms that allow you to manage the entire operations process, from data aggregation, storage and transformation, to visualization, analytics, reporting and distribution. So, what do enterprise businesses who handle a lot of data, do?
Which Data Warehouse Automation Tools Do Enterprise Businesses Use?
As we've mentioned earlier, there are a range of different data warehouse automation tools available, many of them for use across different business departments, for example, customer service, finance and HR. There isn't scope to go into detail about them here but there are some super-sophisticated ETL tools (e.g. Redwood) which offer automation solutions for different elements of the workflow process such as job scheduling.
But, if you are considering a data warehouse automation tool which focuses primarily on sales and marketing data, typically, the types of tools enterprise businesses use fall into two main buckets:
- Extract-Transform-Load ETL Tools (e.g. Astera) - these act as connectors which pull data from all your different platforms, just as TapClicks does. However, their reporting functionality is limited or, in some cases, not offered at all. This means that if you wanted to create reports from your data, you would need to connect to another tool, such as a BI tool or a basic platform such as Google Data Studio.
- Business IntelligenceBI Tools (e.g. Tableau) these provide sophisticated analytics and visualizations of your data but, unless you are an IT expert, they can be complicated to use. More importantly, they do not have the ability to connect with all the data sources you need. So, for these, your data staff would need to pull the data manually and on a frequent and ongoing basis which is tedious and time-consuming.
It's also worth noting that some businesses might be using basic tools (e.g. Dashthis, Google Data Studio or Swydo) and these have the capability to only extract and visualize live data. This means there would be no data storage function for historical data unless you also used a data storage solution in tandem.
In contrast, TapClicks was built to solve the shortcomings of all these other tools and be an end-to-end marketing and optimization data management solution which incorporates data warehouse automation at its heart.
Next, we'll walk through how the TapClicks complete solution fulfils the 4 essential factors we've identified.
Factor #1: TapClicks Can Collect Data from Any Source
We mentioned earlier that one of the shortcomings of a BI tool is that it doesn't have the ability to collect data from all your data sources. Sources you might need include the common digital marketing platforms such as Facebook Ads, Google Ads, etc., but also lesser known platforms for managing display advertising, TV, radio, and more.
And, in addition to your marketing data, as an example, you may have sales data you want to capture from eCommerce platforms or from your in-store POS system. You might also want to add financial data or include data from something like a weather source (so you can track the impact of weather conditions on sales or marketing). And you might want to include business data from a proprietary database too.
As far as we are aware, there are no BI tools that will have the capability to extract data from all these sources and store them in a single database.
ETL tools (and TapClicks incorporates an ETL function as part of its solution) will be able to pull data from most of your data sources. However, it is becoming increasingly difficult to keep abreast of new developments. New platforms are appearing all the time and keeping up with those and their metric hierarchies* and having the capability to pull them all into one place is a continuous task where many providers fall short.
*By hierarchies we mean the way the data structure appears for each platform. TapClicks maps this exactly from the source.
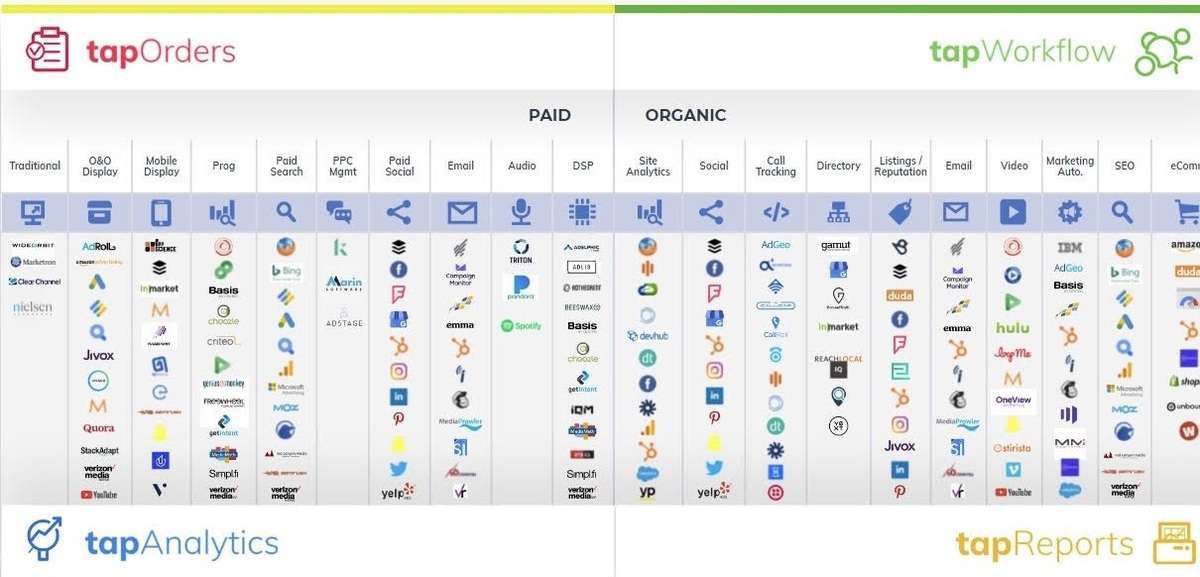
With TapClicks You Can Instantly Connect to Over 250+ Data Sources
We created TapClicks so that it can pull data from over 250 data sources we call these instant-on connectors. These include data sources ranging from Facebook and Amazon to Snowflake and Microsoft Azure SQL. Once connected, your data will be pulled automatically in near real-time daily or whenever you choose to refresh it.

Our instant-on connectors also include some lesser-known ones too so you can be pulling data from all your data sources immediately and all into one place.
And, for many of our data sources, you can pull up to 12 months of historical data too which can be incorporated into your TapClicks data warehouse to be used as you wish (more on this later).
Here is a video showing how easy it is to connect to one of the 250+ platforms for which we have instant-on connectors:
Here's a video showing how to set up an instant-on connector in TapClicks.
You Can Connect to Any Other Data Source Via Our Smart Connector
The beauty of TapClicks is that in addition to the 250+ instant-on connectors, we can also set up connections with any data source you want, as long as it comes in a format we can integrate with (e.g. Google Drive, S3, Snowflake). We can even connect to an offline file sent to us as an email attachment. We call this our Smart Connector.
So, if your business requirements are that you want to plug in your finance data to the TapClicks platform and combine it with your sales and marketing data, the TapClicks team can set this up for and/or work with your IT without any need for manual coding.
The advantage of the TapClicks solution is that all the APIs are managed by our team. We have relationships with all these companies so if a connection breaks or there's an update to an API, it will be taken care of right away without you or your team needing to worry about it.
The benefit of having TapClicks manage everything for you is a thread which runs through our entire solution, including our data warehouse function, which we'll cover next.
Factor #2: TapClicks Can Store All Your Data in One Central Fully Managed Data Warehouse
Having your data stored in different places is fraught with issues. As we saw with our big brand example earlier, the locations of different data sets can be varied, there can be a variety of business users who need access to the data as well as ownership and control issues.
Without a central database you will not benefit from the value of owning your data. The platforms that you use, whether they be marketing or sales platforms or other services, will own and control it and they will also dictate what you can access and do with it, whether that's live data only or historical data too.
For example, let's say you work for a media company with a digital and print newspaper or magazine outlet or publication. You might want to do some ad performance analysis across your ad "inventory" on both digital and print. This might include seeing how impressions, clicks and costs have varied over the last several years and other kinds of historical analysis so you can present this to customers in the future and help them better set expectations, etc. There is no way of doing this without a central database that houses all this data.
Historically, how companies have done this in the past is with a dedicated BI team, IT team, or data staff that manages their data and responds to requests like the above to extract, aggregate and analyze it from many different sources which is costly, time consuming and complex.
Historical data analysis is critical to decision making. Ideally, you want a solution which offers data storage for both live and historical data from all your data providers.
With TapClicks, all this is taken care of for you. Once your connectors have been set up, TapClicks auto-creates a unique database for you. We call it an instance. There is no manual coding required and no IT person needs to be involved.
So, all the data that you want to extract from all the connectors we discussed in #1 above will be pulled into a new data warehouse which TapClicks builds and maintains for you. This data will be continuously pulled from your data sources and stored within the central TapClicks platform which is fully managed by our team. Many of our customers have several years of data stored with us which they can draw on at any time without the need to use any third party services or environments.
The benefit of pulling your data automatically and continuously into the TapClicks data warehouse is that you can do anything you want to it (e.g. transformations, reports, distribution) from there. We'll talk about the analytics aspect next.
Factor #3: Create Compelling Data Stories
One of the challenges of pulling data from many different sources into one place is the data quality in that it arrives in many different formats. In order to create meaningful analytics from that data, it needs to be standardized, normalized and transformed. By this, we mean that elements of the data might need to be changed or organized differently so you can use it in visualizations.
Data Transformation and Normalization
TapClicks will pull each data set via its API in whatever hierarchy is set up, for example, the different data lines for Facebook Ads would be campaign level, ad group level, individual ad, etc. Each data source will be different and these hierarchies will be transferred across to the TapClicks platform and mapped exactly as they are.
But you might want to standardize the names of some metrics so that they are comparable for different channels. For example, if different platforms use different terms for impression, such as imp, hit or view, you can label them all impression within TapClicks so you can look at them as one clear data set.
A more advanced calculation that you can do with TapClicks is to normalize data sets. For example, if you were running a 20% discount campaign across different channels such as PPC, SEO and programmatic advertising, you will want to look at how that campaign performed across all the channels. You will also want to see how the campaign impacted your sales. With TapClicks you can define the campaign name and use this as a metric which you can pull together across all the relevant campaigns and sales sources in one, unified environment.
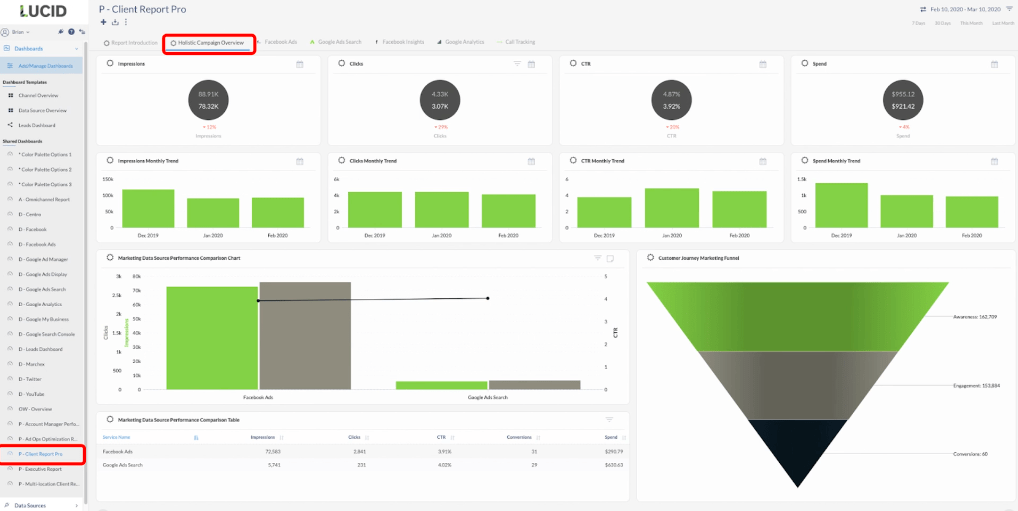
Creating Visualizations in Dashboards
BI tools allow you to create elaborate visualizations of your data so you can tell meaningful stories to relevant stakeholders. With TapClicks you can do this too, and the advantage is that you can use your dashboards as templates so that updates can be made across multiple dashboards.
Users can choose from our readymade dashboard templates (we have templates for social media marketing channels, ad networks and email campaigns) and configure them to include whichever metrics (widgets) you set up. You can then visualize your data how you wish (e.g. graph, pie chart, bar chart).
Each widget and dashboard is highly customizable (whereas these can be limited with other tools) so you can customize metrics for each data source.
Here is a video showing how to set up a dashboard in TapClicks.
Factor #4: Distribute Your Data Wherever You Want (Even to Another Platform)
Because TapClicks is an end-to-end data management platform, not only can you pull all the data you want from all your data sources, store that data within a fully managed data warehouse, transform that data and create visualizations, you can also deliver reports or data in any form you like to wherever you like.
Specifically, in addition to viewing your data via live dashboards (as discussed in #3 above) which can be accessed by whoever you grant access to, you can also use the TapClicks platform and TapAPIs to push data out in two ways:
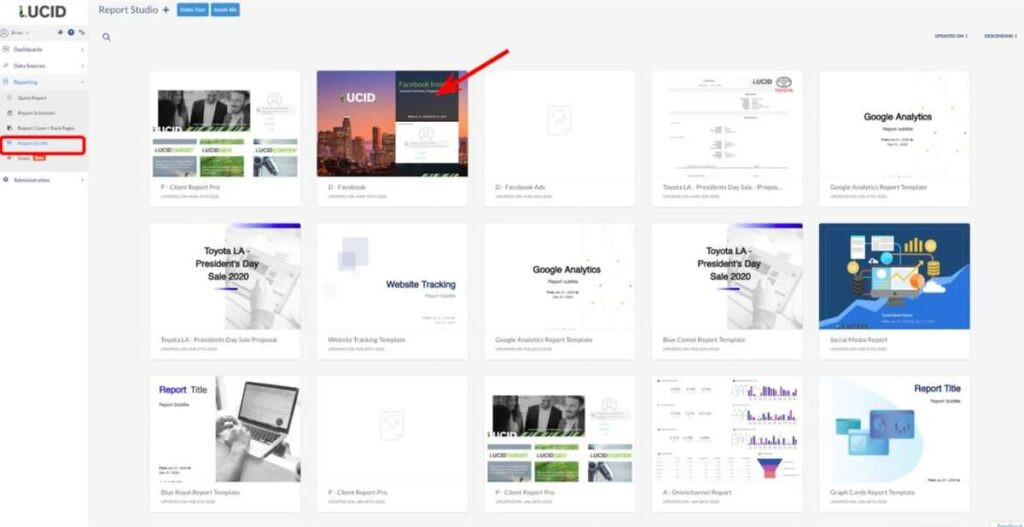
TapClicks ReportStudio Populates PowerPoint Reports Automatically
With TapClicks ReportStudio you can create presentation report templates with whatever plots and graphs you want and schedule them to be emailed out to whichever stakeholders you select.
Once you've defined your metrics and normalized your data, it means that the report and all the graphs and charts within it will automatically update with the most current data for whichever date parameters you've set. Because the TapClicks platform holds your historical data as well as your current data, it's like having a PowerPoint presentation builder that's permanently connected and drawing information from your entire data warehouse lifecycle.
The benefit of ReportStudio, as with so many other elements of TapClicks, is that you can set up and create reports for all your campaigns and channels once only and it's done forever, until you decide to change it.
As with the dashboards, you can customize reports using our white label templates and set permissions so that each audience sees the information that's relevant to them when you want them to see it. You can set up reports to run to whatever schedule you want monthly, weekly, or whenever the reporting period falls.
The report will be sent via email or PDF (PPT or CSV) to the people you've set it up to go to at whatever frequency and schedule you want. And you can be rest assured that the software will always pull the latest data into your reports, automatically, without you needing to do a thing.
Here is a short video on how to schedule reports with TapClicks.
TapClicks Can Deliver Your Data to Any Other Platform
In addition to being able to create customized and automated reports within ReportStudio, you can also distribute data from within the TapClicks platform in whatever format you want to any other destination.
For example, TapClicks has a specific data integration with Google Sheets. This means that data can be pushed out to Google Sheets directly without any requirement for using TapClicks' own reporting facilities.
You can read more about TapClicks integration with Google Sheets in this piece.
TapClicks will even distribute data, in whatever format is needed, via its open source API, to other reporting platforms, such as Tableau.
You can also use the TapClicks platform to collect and send data to your existing data warehouse, if you need to. And, as with ReportStudio, you can schedule for this automated data to be sent out whenever you require.
Being able to pull, store, transform and push data from any source to any platform or stakeholder via the fully managed and automated TapClicks data warehouse provides enterprise businesses with significant flexibility, data security and saves a huge amount of time.
Want to see how easy it is to use the TapClicks data warehouse automation features? Try our free 14-day trial.