
What Is eCommerce Analytics? Understand the Basics Fast
Every online store collects data, but only a few use it to make smarter decisions. eCommerce analytics is the process of tracking, measuring, and understanding that data to improve performance. It helps answer what drives sales, where customers drop off, and how to fix weak spots in your funnel.
With the right eCommerce analytics tools, it becomes easier to evaluate your marketing campaigns, spot patterns in behavior, and improve how your store performs. An eCommerce analytics strategy also helps you see what’s working and how to adjust your marketing efforts to meet your business goals.
In this article, you’ll learn how eCommerce analytics works and how to use it to make better decisions that lead to more sales, stronger customer relationships, and lasting business growth.
What is eCommerce Analytics?
When you run an eCommerce business, data is everywhere, but raw numbers don’t mean much unless you know how to use them. That’s where eCommerce analytics comes in. It gives you the ability to measure, compare, and improve the parts of your store.
eCommerce analytics involves gathering and analyzing data from online stores to optimize performance. You’re not just tracking visits. You’re learning how people shop, what slows them down, and which steps lead to a sale.
Using eCommerce data analytics helps you spot trends and shift your approach quickly. These insights help create marketing strategies that connect better with buyers and support your revenue goals. Every store has room to grow, and yours is no different.
You could also use the best eCommerce analytics tools to pull your data into a unified view so you can measure results and manage each online marketing channel from a single dashboard.
Key Components of eCommerce Analytics
The following are the core areas of eCommerce analytics so you can focus on what drives real growth.
Traffic Analytics
Understanding where your visitors come from helps you focus on the right areas of your eCommerce store. Traffic analytics tracks each visit and shows how people enter your site, such as through search engines, paid ads, social media, or email.
Each report gives you information from the entire customer journey, beginning with that first click. You’ll find out how long people stay, which pages they view, and when they exit. That kind of visibility makes it easier to adjust your site and your marketing efforts so people stay longer and move closer to buying.
Traffic analytics also supports analyzing data on past sales and customer demand. When you study how traffic changes during specific promotions or seasons, you can plan effective campaigns going forward. These trends become part of your overall customer data, helping you see what drives results.
When you connect these insights to your strategy, you can predict future sales and customer satisfaction and increase customer loyalty over time. That’s how you strengthen your eCommerce business with data that leads to real action.
Conversion Analytics
Conversion analytics tells you how many buy. When your visitors add products to the cart but don’t complete checkout, something’s blocking the process. If people drop off on key pages, you’ll know where to focus next.
Studying conversion behavior helps you find weak spots and take direct action. You might improve a product page, shorten a form, or change your call-to-action button. Small shifts lead to big results when you target real pain points.
Conversion analytics becomes even more powerful when paired with traffic insights. You’ll be able to turn more visitors into paying customers and get better results from every campaign.
That means your marketing efforts work harder, your store becomes more efficient, and your entire operation grows stronger.
Customer Analytics
Your relationship with a shopper doesn’t end at the first sale. Customer analytics helps you build loyalty, increase repeat purchases, and improve how you speak to different buyers. When you understand what your customers value, you can deliver more of it.
You’ll start by organizing your customer data into useful groups. Some buyers order once a year. Others come back every month. Some care about deals, others shop based on new arrivals.
These patterns matter. Once you spot them, you can adjust your messaging, promotions, and timing to meet those specific needs.
Customer analytics further helps shape your eCommerce analytics strategy. It lets you focus on behavior, not assumptions. You’ll run better campaigns, reduce churn, and build a store that speaks to your audience.
When you match what you offer to what customers want, you improve your service and keep people coming back.
Product Analytics
Product analytics helps you track browsing behavior, interest levels, and sales activity. If you’re running an online business, you can’t afford to overlook such data.
Every click, view, and purchase adds to your data points. You’ll start to see which products attract attention but don’t convert, and which ones drive steady revenue. You can also use the data to improve product listings, remove distractions, or showcase higher-value items in better spots.
With the right eCommerce platform, you can track product interactions and sales performance without switching tools. Those reports help you respond faster, before a poor performer drags down your overall results.
Looking at product analytics over time supports analyzing sales data with more focus. You can identify trends in customer purchasing behavior across seasons, pricing levels, or collections. That insight makes it easier to adjust your catalog and propose pricing strategies based on how people actually buy.
If you’re serious about growth, make product analytics part of every decision. It keeps your store sharp and your eCommerce success on track.
Marketing Analytics
Spending money on ads or emails without tracking results costs more than you think. Marketing analytics shows which efforts lead to traffic, sales, or nothing at all.
With the right tools, you can tie performance to actual outcomes. See which channels bring first-time visitors. Measure how different offers drive engagement. Find out which messages lead to action. You’ll spend less on tactics that stall and more on ones that move buyers forward.
Your business decisions become faster and more focused when each campaign connects to real numbers. Instead of spreading efforts too thin, you can direct attention where it matters. That approach gives your store better control over spend, reach, and performance.
Predictive Analytics
Waiting until a campaign ends to find out what didn’t work leaves money on the table. Predictive analytics helps you act early. You’ll spot patterns in behavior, forecast outcomes, and plan ahead with more confidence.
Rather than reacting after a dip in sales, you can prepare for it. Let’s say certain items trend upward before holidays. With predictive insights, you can adjust your inventory, update offers, and meet demand before it spikes.
You’ll also uncover patterns tied to product bundles, repeat buyer habits, or discount timing. These insights let you reach customers when they’re most likely to buy, not just when your calendar says so.
Your reports become a tool for planning, not just reviewing. You’ll move faster, serve buyers better, and avoid wasting time on changes that don’t pay off. That kind of thinking puts your eCommerce business in a stronger position to compete and scale.
How Does eCommerce Analytics Work?
eCommerce analytics works by collecting your data, studying what it shows, and using those insights to take action. Each step brings you closer to smarter decisions and stronger results.
Start with clear data collection. Pull numbers from these four areas:
-
Website analytics – Track views, time on page, drop-offs, and how visitors move.
-
Sales data – Look at product performance, total revenue, and average order value.
-
Customer data – Gather purchase history, demographics, and buying patterns.
-
Marketing data – Review your marketing campaigns, including email, paid ads, and social media.
Once you have the data, study it closely. You can identify trends in customer purchasing behavior, spot where sales drop off, and track key metrics like conversion rates, customer acquisition cost, and customer lifetime value (CLV).
With the right analysis, you can improve the customer experience, adjust your outreach, and optimize marketing strategies. You’ll respond faster, connect better, and make confident business decisions that help your eCommerce business grow without wasting time or budget.
Benefits of eCommerce Analytics
You’re likely already collecting store data. But without using it properly, you’re missing the opportunity to grow faster and smarter. eCommerce analytics helps you turn raw numbers into actions that improve how your store performs and how your customers respond.
You can use it to:
-
Monitor marketing performance and see what’s driving real results
-
See the direct correlation between marketing initiatives and revenue generation
-
Better understand customer behavior so you can target more effectively
-
Optimize conversion rates and boost sales by fixing weak points in your funnel
-
Help you decode customer interactions to improve messaging and product recommendations
-
Optimize customer retention strategies by identifying habits and loyalty triggers
-
Provide actionable insights to shape campaigns, support, and promotions
-
Analyze customer feedback and reviews to guide product improvements
-
Discover inventory management methods based on actual demand
-
Apply descriptive analytics and other techniques to turn trends into strategy
-
Make data-driven insights part of every decision
-
Focus on enhancing business performance without wasting time or budget
Understand your customers, optimize your ads, and grow smarter with TapClicks. Book a demo now!
Common eCommerce Analytics Metrics to Track
Tracking the right numbers helps you make better data-driven decisions. These key performance indicators give you a clear view of what drives results.
When you focus on the right performance metrics, you’ll spot what works, fix what doesn’t, and improve online sales faster.
Conversion Rate
You can’t build a profitable store without turning visitors into customers. Your conversion rate shows how many people complete a purchase after visiting your site. A good rate often falls between 2% and 5%, based on WordStream.
If your numbers fall below that, don’t assume traffic is the issue. Start by reviewing your product pages, navigation, and checkout process. Too many steps, slow pages, or unclear calls to action often block conversions. Add trust signals like secure payment badges, reviews, or return guarantees to reduce hesitation.
Focusing on the small details helps you deliver better customer experiences. Clean design, fast load times, and a clear purchase path lead people to act without frustration.
Use analytics to track each step in the purchase flow. If people add items to their cart but drop off before checkout, test simplified forms or shorter page sequences. If product pages get clicks but not sales, improve descriptions or use clearer images.
Raising your conversion rate doesn’t require a complete overhaul. Small changes, backed by data, create steady improvement and drive more value from the traffic you already have.
Average Order Value
Average order value (AOV) tells you how much customers spend each time they buy. Higher AOV means more revenue per order, which helps you scale without constantly increasing traffic or ad spend.
You can raise your AOV by bundling related items or recommending add-ons during checkout. Offer free shipping when someone reaches a set total. Highlight best-sellers near your cart page to encourage one last look.
Make sure your suggestions feel helpful. If someone adds a camera to their cart, offer a memory card, not a random item. Relevance makes people act. Yet be mindful not to overwhelm customers with too many suggestions, which can reduce conversion.
Tracking AOV over time lets you optimize pricing and inventory. Focus on products that drive larger carts. Position those in campaigns, promotions, or top banner space to attract more buyers to high-value items.
You don’t need to push harder to earn more from each visit. By encouraging customers to explore one or two extra items, you improve margins and strengthen long-term revenue without overcomplicating the experience.
Customer Lifetime Value (CLV)
Customer lifetime value shows how much someone is likely to spend with you over time. High CLV means your customers return, spend more, and stay connected to your store.
When most of your buyers vanish after one order, you need a retention strategy. Start with post-purchase emails. Offer product tips, reorder reminders, or exclusive discounts. Keep your communication focused on value, not just promotions.
Segment your buyers. Your top spenders should see early access to new drops or limited-time offers. Small rewards can build trust and make repeat visits more likely.
A higher CLV gives you room to reinvest. If your best customers stick around and spend more, you can afford to reach them again with better offers or loyalty perks.
Use that data to shape retention campaigns, improve support, and personalize outreach.
Customer Acquisition Cost
Customer acquisition cost (CAC) shows how much you spend to gain one customer. Divide your total marketing and sales spend by the number of new customers within that period. A low CAC means you’re acquiring customers efficiently. A high CAC cuts into profits and stalls growth.
If CAC keeps rising, tighten your targeting. Focus on audiences that already engage with your content or products.
You can also reduce CAC by improving retention. While retention primarily impacts CLV, better retention can improve overall acquisition efficiency by increasing customer value. Using customer data platforms further helps you spot patterns, deliver more relevant content, and shorten the time between interest and purchase.
Look at customer acquisition metrics tied to specific campaigns or platforms. If you’re using acquisition data wisely, you’ll lower costs and convert faster.
When CAC drops and value per buyer rises, your entire operation becomes more sustainable. That balance lets you grow without overspending just to bring people in the door.
Return on Ad Spend
Return on ad spend (ROAS) shows how much revenue you generate for every dollar spent on advertising. If you spend $1,000 on ads and earn $4,000 from those clicks, your ROAS is 4:1.
Higher ROAS means better returns. Low ROAS points to wasted ad budget or poor campaign targeting.
You can raise ROAS by improving targeting, refining creative, and tracking the buyer journey closely. Connect ad platforms with analytics reporting tools to follow performance across multiple touchpoints.
To improve consistency, optimize digital marketing strategies for search engine optimization (SEO) and search engine marketing (SEM). Ranking higher organically supports better paid results, too. Together, these channels amplify your reach and improve conversion.
Once you track ROAS at the campaign level, you’ll spot patterns faster. Over time, ROAS becomes a guide for better spending decisions. You’ll invest in what brings profit and stop fueling channels that only drain your budget.
Shopping Cart Abandonment Rate
Cart abandonment happens when someone adds items to their cart but doesn’t complete the purchase. A high rate usually signals friction in the buying process.
You can fix these issues by simplifying the layout, offering guest checkout, and showing all fees upfront.
Use retargeting emails or on-exit popups to bring back shoppers. Send reminders within 24 hours, include images of carted items, and offer a small incentive to complete the order.
You can also evaluate online shopping trends to understand how your buyers behave. If mobile users drop off more often, prioritize page speed and form design for smaller screens.
Connect abandonment data to your metrics. Fixing drop-off points reduces CAC and increases revenue without new spending. More completed carts mean more orders from your existing traffic.
Every cart left behind is an opportunity to improve. If you follow the signals and test updates consistently, you’ll reduce abandonment and improve the customer’s path to purchase.
Traffic Sources
Knowing where your traffic comes from helps you focus your efforts. Not every visitor lands on your store through the same channel. Some come from organic search, others from paid ads, social media, or email. Tracking traffic sources helps you understand what brings in qualified visitors.
Use analytics to break down performance by source. Are organic visitors staying longer? Do social users bounce faster? Knowing how people behave by channel lets you adjust your outreach and messaging.
If you want to generate more website traffic, you need to focus on quality, not just quantity. Use content that matches intent and directs readers to the right page. Then measure bounce rates, engagement, and conversions by source.
Stronger tracking helps you shift budget wisely. If paid search outperforms social, reallocate funds. If referral traffic leads to bigger carts, consider building more partnerships.
Once you see the big picture, you’ll stop treating traffic as a single number. Understanding those patterns gives you the tools to grow smarter and serve each audience with the right message at the right time.
How to Conduct eCommerce Data Analysis
You don’t need a data science degree to find value in your reports. If you follow a clear process, your store’s data can help you solve problems, spot new opportunities, and inform business decisions that lead to real growth.
Start with these steps:
-
Define goals and objectives – Decide what you want your analysis to achieve. Do you want to raise revenue, improve retention, or fix weak marketing?
-
Collect relevant data – Pull reports from website analytics, customer profiles, sales history, ad campaigns, and reviews. Track traffic behavior, product performance, and engagement across all channels.
-
Clean your data – Remove duplicates, fix incorrect entries, and fill missing values so your results stay reliable.
-
Integrate your sources – Bring everything into one platform or dashboard. You’ll save time and make comparisons easier.
-
Analyze the data – Use descriptive reports to understand the past. Add predictive and diagnostic tools to study what’s likely to happen and why.
-
Visualize your findings – Use charts and graphs to highlight key patterns, drop-offs, or performance spikes.
-
Take action – Update your marketing, pricing, or user experience based on what the data tells you. Keep tracking to improve with every move.
Challenges in eCommerce Analytics
If you want accurate insights that lead to action, you need to watch out for common analytics challenges, such as:
-
Scattered data sources – Switching between platforms breaks your momentum and makes it harder to see what’s really happening across your store.
-
Inaccurate tracking – Even a single broken pixel or missing tag throws off your reports. If the numbers don’t match, it’s tough to feel confident in any decision.
-
Data overload – Too many metrics at once make it hard to spot patterns. Essential trends get buried under less relevant numbers.
-
Unfriendly dashboards – Tools that require technical skills or offer too many features at once can push you away from using analytics at all.
How TapClicks Overcomes These Challenges
TapClicks solves these eCommerce analytics challenges by:
Pulling Data From Every Data Source
Managing separate tools to track campaign results slows everything down. TapClicks connects with over 250 marketing platforms, including Google Ads, Facebook, and WideOrbit for broadcast campaigns. You can also pull data from eCommerce platforms, Salesforce, Microsoft Azure, and Snowflake.
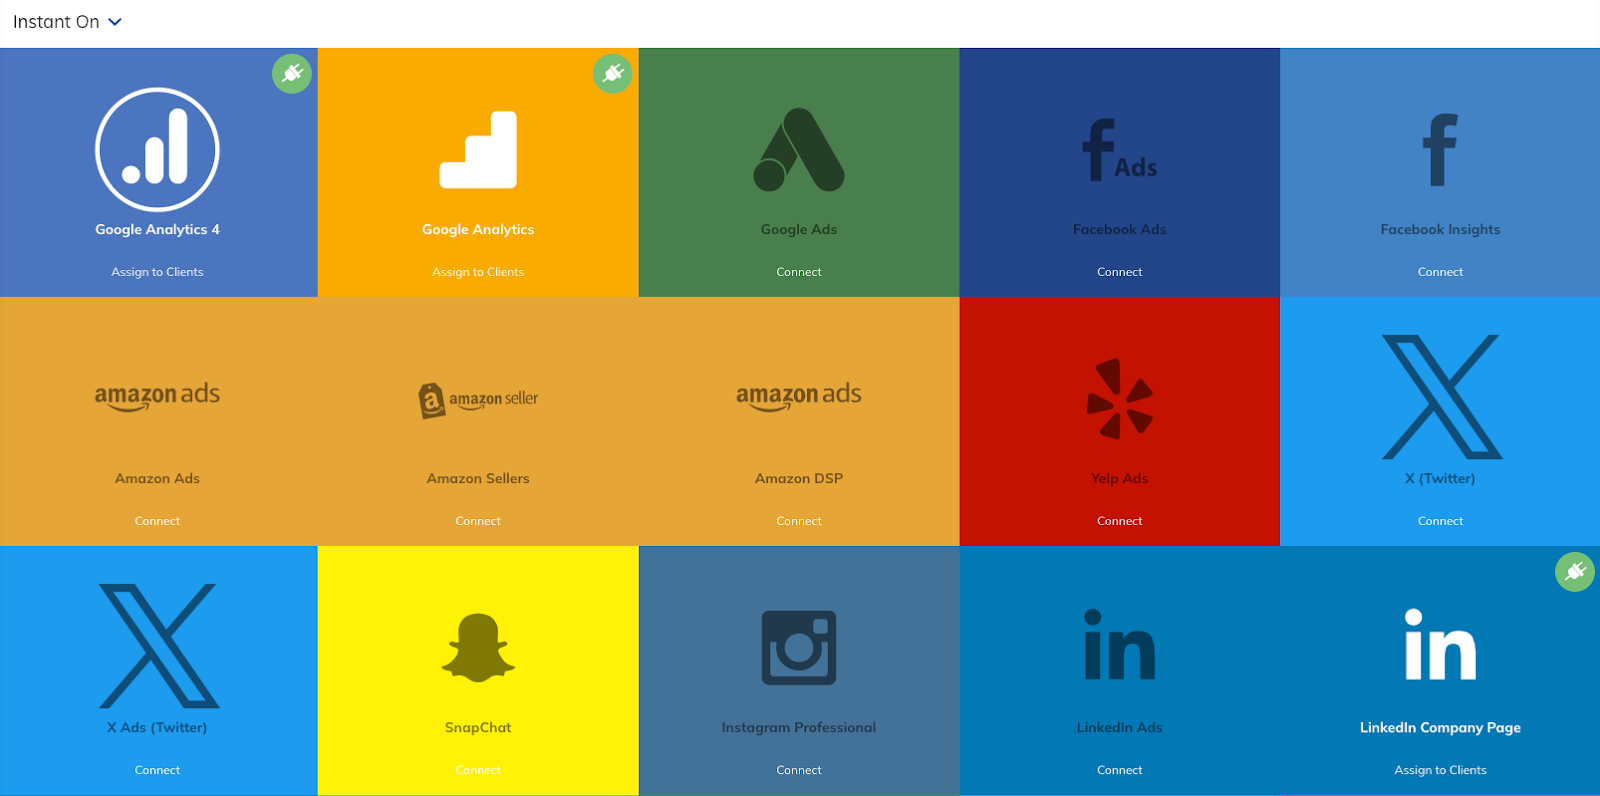
Need to plug into something niche? Smart Connector lets you link to more than 6,000 additional data sources, even custom databases. You decide how often the data updates. TapClicks handles the API maintenance, so you won’t need IT help every time a platform changes.
Looking to compare long-term trends? You can import 12 months of historical data right away to build a full picture.
Creating a Permanent Store of All Your Data
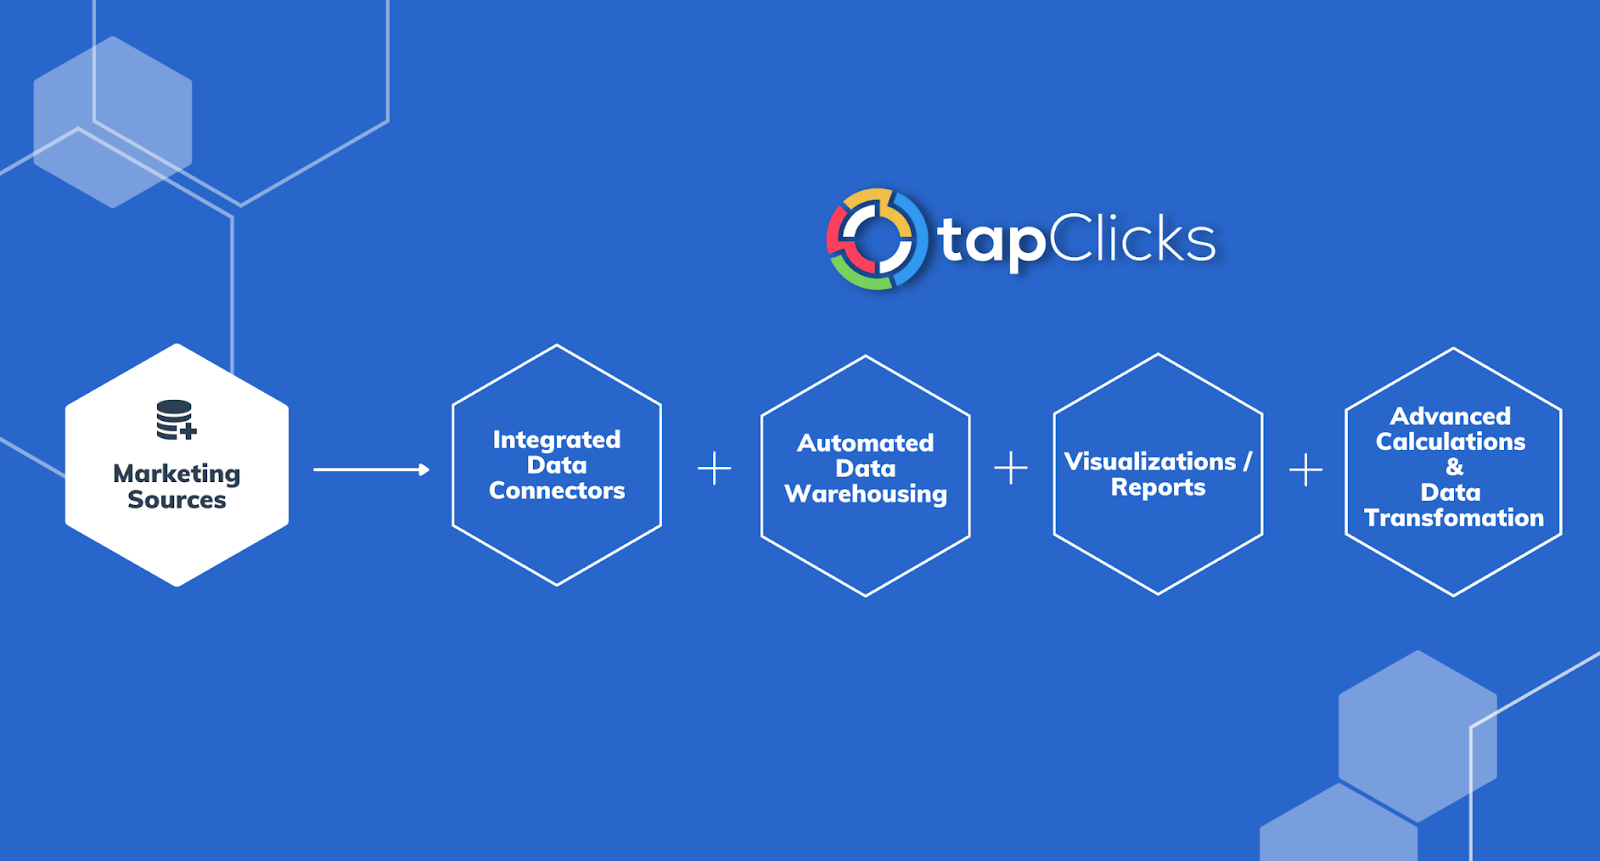
TapClicks creates a full, searchable history of your data inside a managed data warehouse. Everything from sales reports to campaign performance lives in one place, and you don’t need any coding skills to access it.
The platform keeps all your records available so you can run year-over-year comparisons and understand long-term performance. You won’t need to dig through five platforms or ask your data team for help.
Automating Calculations for Any Campaign or Client
Manual calculations steal too much time. TapClicks removes that roadblock with custom formulas that update themselves. Define a metric like total social engagement once. From there, the platform handles it automatically across every dashboard and report.
You could also group campaigns by product, segment, or region. Pull total ad spend or cost per click from multiple data sources into a single view.
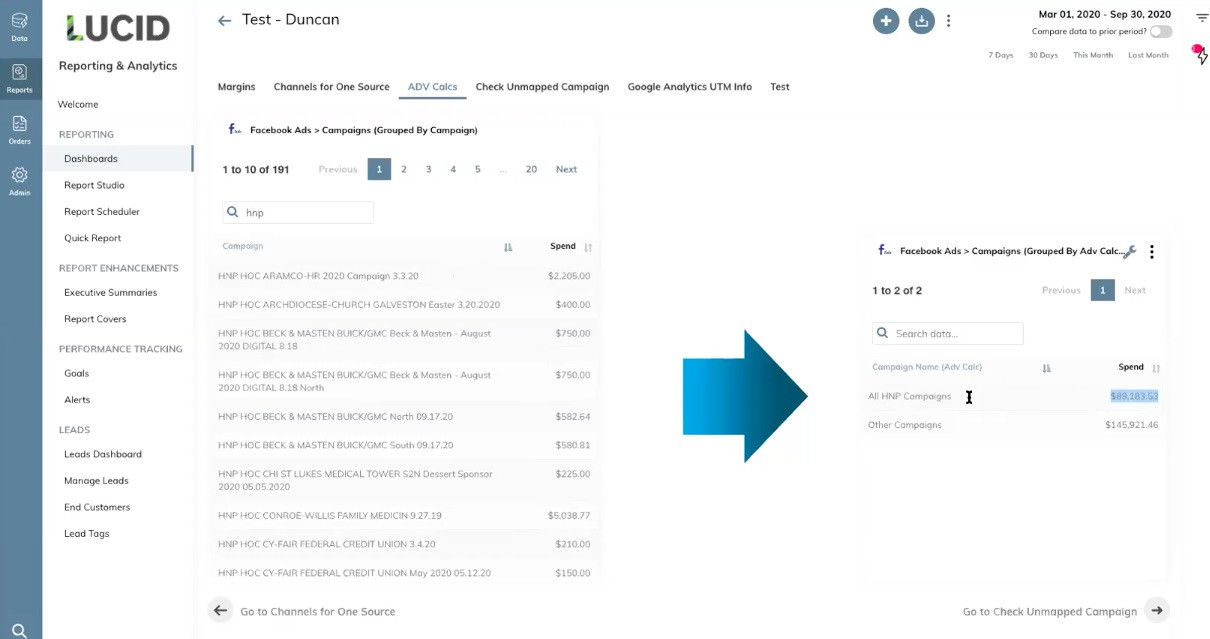
Each calculation you define stays in the platform and updates with fresh data every time.
Allowing You to Customize Dashboards
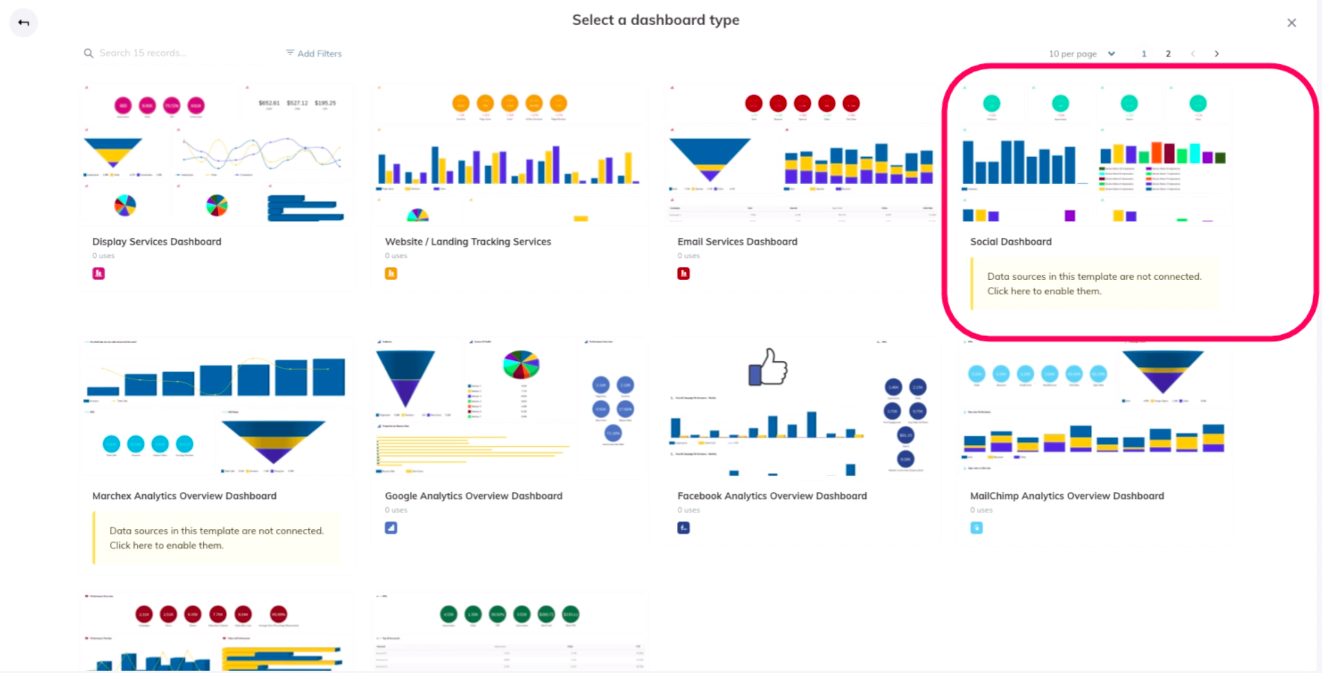
Making the same update to 50 dashboards eats up your day. TapClicks gives you reusable templates that update everywhere. Add a graph or metric once. It will appear across all client dashboards automatically. If one client doesn’t need it, you can turn it off for them.
You can build each dashboard exactly how you want it. Use prebuilt templates or customize everything from the layout to each individual chart. TapClicks supports unlimited dashboards and users, so you can scale your reporting across every account.
Let your clients access their dashboards anytime. Set permissions by chart, so sensitive numbers stay hidden if needed.
Bring All Your eCommerce Data Insights Together With TapClicks
TapClicks supports your eCommerce business by helping you:
-
Connect platforms like Google Ads, Facebook, Amazon Ads, Shopify, Salesforce, and more
-
Measure how each channel performs, from email and PPC to paid social
-
View data by segment, channel, or campaign
-
Set up custom metrics and dashboards once
-
Build visual reports that pull from multiple platforms
FAQs About What Is eCommerce Analytics
What does an eCommerce analyst do?
An eCommerce analyst examines data from online sales, traffic, customer behavior, and marketing to help improve performance. The job involves reviewing metrics from platforms like Google Analytics, ad reports, and sales dashboards to find trends and opportunities.
What is eCommerce and explain it?
eCommerce refers to buying and selling goods or services over the internet. It includes everything from product listings and checkout systems to digital marketing and customer service.
What is e-business analytics?
E-business analytics focuses on analyzing data across all digital business operations. It covers areas like internal processes, vendor performance, digital supply chains, and overall business efficiency.
What is the role of analytics tools in eCommerce?
Analytics tools in eCommerce help collect, organize, and present sales, marketing, and customer data. These tools make it easier to track performance, spot trends, and take action. In conclusion, eCommerce analytics allows businesses to improve their strategy with clear, measurable insights.