Unified Marketing Analytics: End Data Silos for Good
Marketers collect data from more sources than ever. Yet it can still be difficult to determine which campaigns, channels, and activities are contributing to revenue.
Bringing that information together makes it easier to understand performance and identify where the budget is generating the strongest return.
This guide explains how unified marketing analytics works and why more teams are making it a priority.
TL;DR
-
Unified marketing analytics combines information from advertising, CRM, website, and sales systems into one analysis process.
-
Fragmented records can create conflicting figures, manual work, and incomplete conversion tracking.
-
First-party data has become more important as browser privacy changes limit traditional tracking methods.
-
MMM, attribution, incrementality testing, and predictive analytics help analyze customer engagement and purchasing behavior.
-
TapClicks provides a unified system with data governance, automation, reporting, and AI-powered analysis.
What Is Unified Marketing Analytics?
A unified framework analyzes marketing performance from advertising platforms, customer relationship management (CRM) systems, web analytics tools, and online sales systems.
By connecting these sources, you can see how your efforts contribute to revenue rather than evaluating each channel separately.
For example, you can connect Google Ads data with CRM records to see which marketing campaigns contributed to sales.
Why Fragmented Data Is More Expensive Than You Think
Many organizations rely on separate systems to measure advertising, website activity, leads, and sales. As a result, sales teams often work from conflicting numbers.
This challenge is more common than many realize. According to Infobip, 96% of brands automate customer interactions in some way, yet only 58% say their channels are fully synchronized.
These disconnects can create conflicting reports. A paid media team may report strong results while sales reports something different.
Manual reporting also consumes valuable time. Analysts often spend hours combining spreadsheets and validating figures before drawing conclusions.
Attribution can become difficult as well. One system may credit a conversion to paid search, while another credits email.
When reports aren't consistent, it's difficult to make informed decisions. Marketing budget allocations may rely on incomplete information, making missed opportunities more likely.
The Core Components of a Unified Marketing Analytics System
Here are the key components that make unified analytics possible.
Information Collection
Marketing measurement depends on collecting complete and accurate information. If important activities aren't recorded, they can't be included in reporting or attribution.
A company that tracks online purchases but not phone orders may underestimate the impact of its advertising. Missing campaign data can lead to incomplete conclusions.
Data Integration
Buyer interactions, lead records, and sales activity are often located in separate systems. Data integration brings them together so you can connect marketing activity to revenue.
Consider a company that advertises through Google Ads and manages leads in HubSpot. Integration allows those interactions to be viewed as part of the same customer journey.
Metric Standardization
The same metric can be calculated differently depending on the platform. Definitions for leads, conversions, and acquisitions often vary between systems.
Standardization creates consistent definitions for key performance indicators (KPIs). This makes outcomes easier to compare and avoid submitting conflicting reports.
Visualization and Reporting
Most stakeholders don't work directly with raw data. They rely on dashboards and reports to understand trends and identify areas that need attention.
Visualization turns complex datasets into charts and summaries that are easier to interpret. This makes it easier to compare results over time and identify meaningful changes.
How Unified Analytics Improves Marketing ROI
You can compare marketing spend to revenue and identify which channels are contributing to sales.
Active campaigns can be adjusted before the budget is wasted. You can identify performance issues before they have a larger impact on results.
Unified marketing measurement shows how buyers progress through the sales cycle. They usually interact with a brand more than once before making a purchase.
For example, someone may discover a brand through paid search, return through email, and buy a product weeks later. Data-driven attribution models help show how each touchpoint contributed to the conversion.
Customer analytics can uncover patterns that aren't visible in isolated reports. One acquisition source may generate more repeat purchases than another, even if both deliver the same number of conversions.
Why First-Party Data Matters for Unified Analytics
First-party data is information collected directly from people who interact with your business. This can include form submissions, purchases, email signups, and website traffic.
Changes to third-party cookies have made measurement more difficult. Many companies now have less visibility into how people navigate between websites and ad platforms.
As a result, many teams rely more heavily on information collected through their own websites, CRMs, and applications. This helps maintain data quality and reduces the reporting issues caused by siloed analytics.
Server-side tracking is becoming more common as well. It helps preserve user-level data when browser restrictions limit traditional tracking methods.
How Marketers Measure Performance Today
These are the most common approaches used to analyze performance and measure the results of various marketing efforts.
Multi-Touch Attribution
Multi-touch analytics method estimates how much influence each interaction had on a conversion. It uses attribution logic to evaluate activity that occurred before a purchase.
This approach can provide a broader view than platform-specific attribution, which only measures activity captured by one system.
Marketing Mix Modeling
Marketing mix modeling (MMM) uses statistical analysis to find out how revenue changes and what may have contributed to those changes.
MMM evaluates the relationship between channels, ad spend, and revenue. It can also account for external factors such as seasonal demand, pricing changes, and promotions.
Incrementality Testing
Incrementality testing asks a simple question: would this result have happened without the campaign?
A common method is to compare two similar groups. One group is exposed to the advertising, while the other isn't. This helps separate results influenced by the advertising from activity that would have happened anyway.
Predictive Analytics
Predictive analytics uses historical performance data to forecast future outcomes.
It looks at past performance to identify patterns. For example, it may indicate that sales are likely to increase next month or that purchases are starting to decline. This can help companies prepare before those trends become more noticeable.
7 Steps to Build a Unified Marketing Analytics Strategy
Below are the seven steps for creating a unified marketing strategy.
-
Audit your data sources. Document every tool used to track activity and store records, including advertising tools, CRM systems, ecommerce platforms, and Google Analytics.
-
Name the key metrics relevant for your company. Focus on real business outcomes such as revenue, lead generation, or customer retention.
-
Connect sales records with lead information. This allows you to trace a sale back to the activity that generated it.
-
Establish governance rules. Define naming conventions, metric definitions, access permissions, and ownership responsibilities. This helps keep records organized as more people contribute information.
-
Choose an attribution method. Determine how conversions will be credited and apply that approach consistently throughout reports.
-
Create dashboards for executives and department leaders. Focus on the numbers they review regularly rather than every available customer data point.
-
Review findings regularly and assign follow-up actions. If a campaign, channel, or audience isn't performing as expected, identify the next steps and assign ownership.
With these steps in place, the next step is choosing a marketing analytics tool that can bring valuable insights together.
Common Unified Marketing Analytics Mistakes to Avoid
Even with the right tools, a few common mistakes can undermine unified measurement.
One of the most common mistakes is treating attribution from a single source as the complete picture. Some interactions occur elsewhere, making it difficult to see everything that influenced a conversion.
Many businesses also focus on vanity metrics. A campaign may generate thousands of clicks or social media followers, but those numbers don't automatically translate into leads or revenue.
Offline conversions are often overlooked. Phone calls, in-store purchases, and transactions completed outside digital channels may never be linked to sales data.
Governance is another frequent mistake. For instance, one marketing team may classify a lead differently from another.
When teams don't follow the same standards, it becomes harder to compare results across the entire organization.
Gain More Confidence in Your Analytics With TapClicks
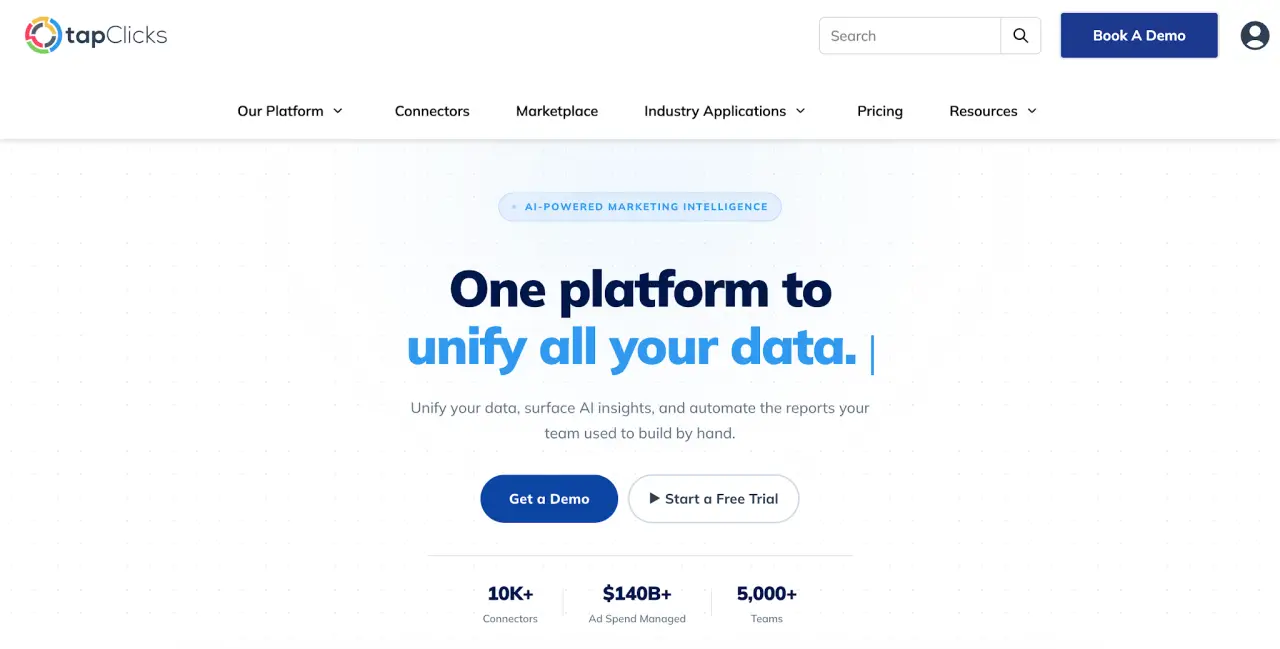
TapClicks combines reporting, analytics, and AI insights in one marketing intelligence platform. It brings campaign results, CRM records, and other records together.
TapData handles data integration, governance, and transformation. It supports more than 10,000 connections and includes historical backfill for long-term trend analysis.
Key features include:
-
TapData: Data unification, governance, and no-code transformations that standardize records from multiple systems.
-
Enterprise Hierarchy: Organizes brands, regions, locations, clients, and campaigns within the same hierarchy.
-
SmartReports: Automated report delivery, reusable templates, and scheduled distribution.
-
SmartAnalytics: Interactive dashboards, cross-channel analysis, and advanced analytics.
-
SmartStory: Presentation-ready reports with AI-generated narratives and executive summaries.
-
AI Insights Agents: Automatic identification of trends, anomalies, risks, opportunities, and benchmark comparisons.
These capabilities help you maintain consistent KPI definitions, assess results, and connect analysis to business outcomes.
FAQs About Unified Marketing Analytics
What is unified marketing measurement?
Unified marketing measurement combines information from advertising, CRM, website, and sales systems into one analysis process. It helps you evaluate results using consistent metrics.
How does unified analytics improve marketing ROI?
Unified analytics helps identify which activities generate revenue. This makes budget decisions more informed and helps optimize strategies based on actual outcomes.
What data sources should be connected?
Advertising accounts, CRM systems, website analytics tools, ecommerce platforms, and sales records are often the most valuable connections.
Bringing them together can reveal which marketing activities attract buyers with higher customer lifetime value (CLV).
What is the difference between MMM and attribution?
MMM examines how revenue changes over time and what may have influenced those changes. Attribution looks at the interactions that occur before a conversion and estimates how much each interaction contributed.
Many organizations use both methods when evaluating marketing projects and planning for business growth.