Supermetrics vs Funnel: Which Fixes Fragmented Workflows?
Your client meeting is tomorrow. The dashboard looks polished, but when the client asks, “Why did performance drop?” you don’t have a clear answer.
That’s the tension behind the Supermetrics vs Funnel debate. You have the data, but getting to the “why” still means last-minute analysis. It’s not the data that’s missing but the story.
In this comparison, we’ll break down what each platform does and where they fall short.
TL;DR
-
Supermetrics sends data into reporting tools like spreadsheets and dashboards, while Funnel stores and prepares it before sending it out.
-
Supermetrics is often used for quick access in tools like Google Sheets and dashboards.
-
Funnel is used when teams need data storage, standardization, and consistent reporting.
-
Both platforms focus on moving and preparing data, not explaining marketing performance.
-
TapClicks adds reporting, insights, and built-in context so teams don’t have to manually interpret and present results.
Supermetrics Overview
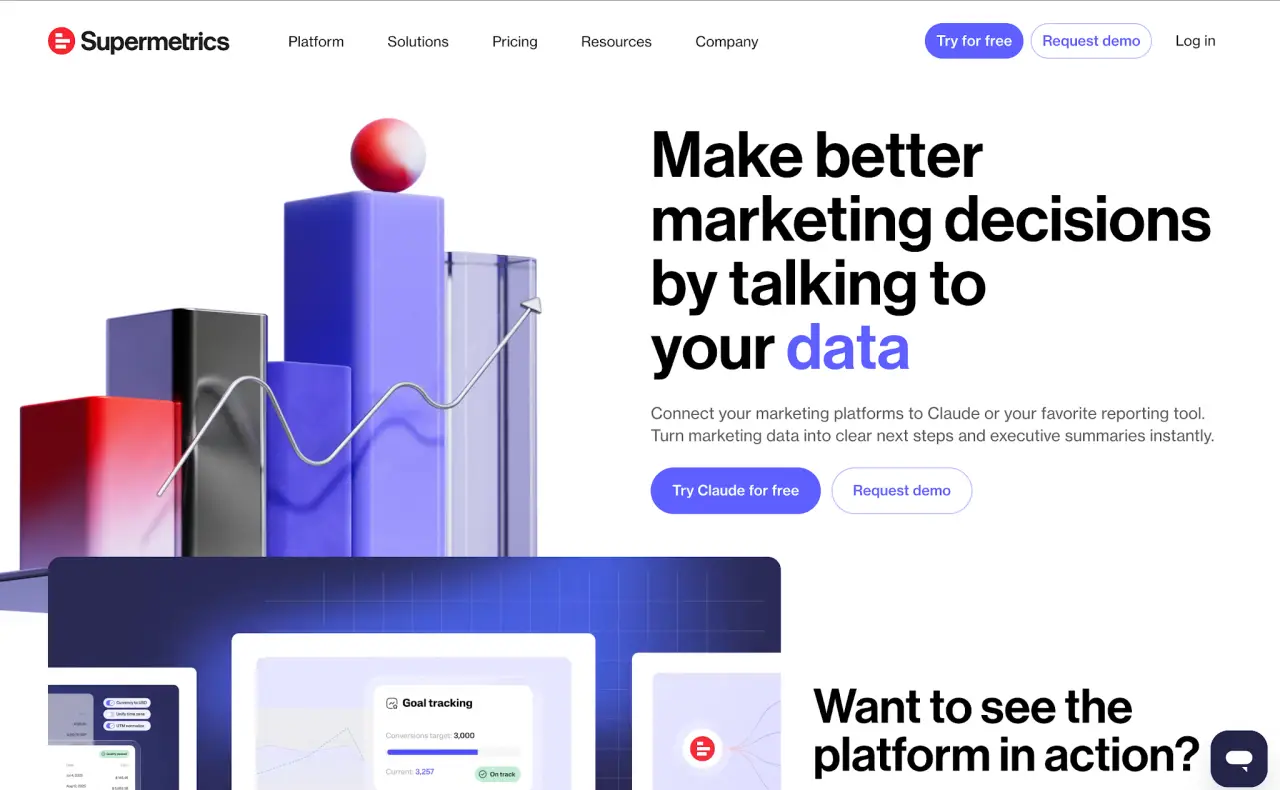
Image source: supermetrics.com
Supermetrics is a data integration platform that helps teams pull data from marketing platforms and send it to their reporting tools.
You connect data sources like Google Analytics, Google Ads, Meta, Shopify, or HubSpot. Then you choose the metrics and dimensions you need, apply simple data transformation steps, and schedule data refreshes.
Once that’s set, your data flows automatically into your reporting setup, so you’re not exporting and updating spreadsheets manually.
Key Features of Supermetrics
-
Data source connectors: Connect to platforms like Google Analytics, Google Ads, Meta, Shopify, and HubSpot.
-
Custom data imports: Add CSV files, Microsoft Excel files, application programming interfaces (APIs), and offline business data that standard connectors may not support.
-
No code data transformation: Map fields, standardize naming, combine datasets, and create custom metrics without technical skills.
-
Flexible data destinations: Send data to tools like Power BI, Google Sheets, Google Data Studio, Microsoft Excel, or your data warehouse.
-
Data storage and historical data: Store raw and modeled data, replay records, and backfill historical data when needed.
-
Data quality monitoring: Track missing tags, broken parameters, and anomalies before they affect reports.
-
Reporting and data visualization: Use dashboards, templates, and integrations with data visualization tools to analyze performance.
Funnel Overview
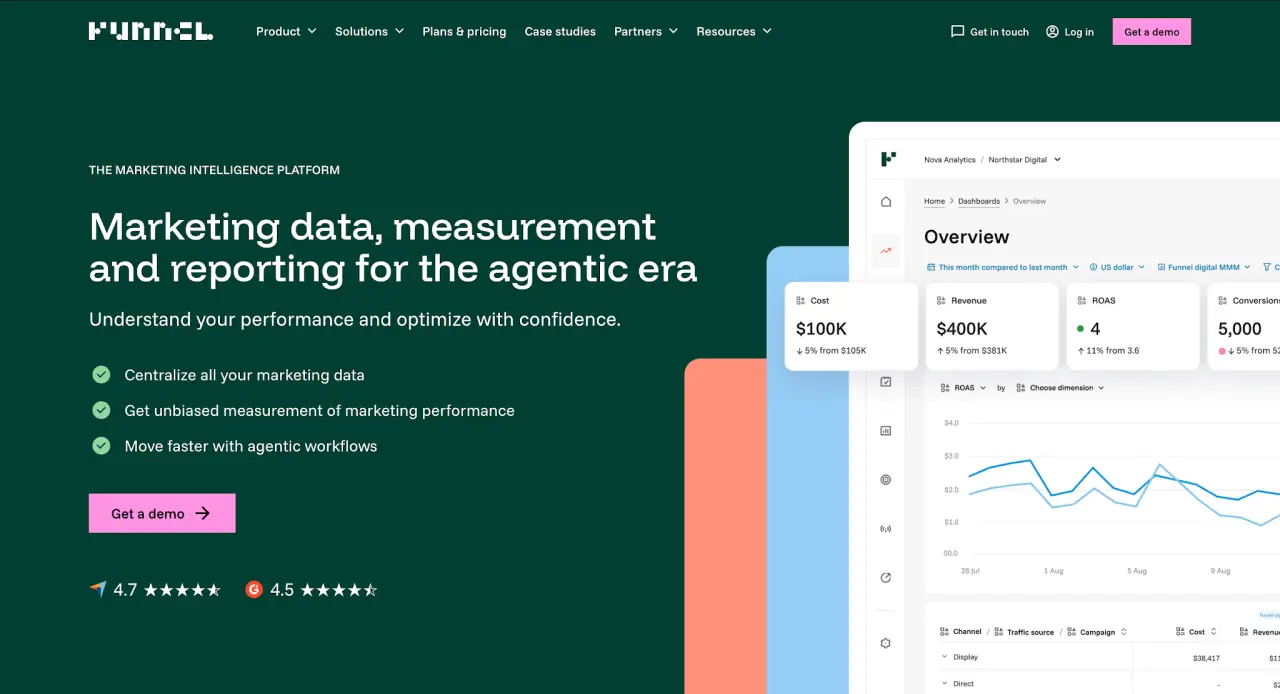
Image source: funnel.io
Funnel is a marketing intelligence platform that helps teams gather data from ad platforms, web analytics tools, and social media channels, then prepare it for reporting.
It follows an extract, store, transform, load process. The platform pulls in data, stores raw records, applies transformations, and sends business-ready data to analytics platforms or major business intelligence (BI) tools.
Since it stores data first, reports don’t get lost when a connection fails. Teams can keep historical data and update transformations without starting over.
Key Features of Funnel
-
Field mapping and normalization: Standardizes metrics like clicks, cost, and conversions so data from different channels matches.
-
Editable data models: Update field mappings and transformation rules after import without re-pulling data.
-
Built-in data storage: Keeps raw and processed data available for reporting and historical analysis.
-
API reliability: Manages API limits and keeps data connections stable.
-
Automatic backfills: Fills in missing data so reports stay complete.
-
Data governance and security: Supports the General Data Protection Regulation (GDPR) and protects data access.
-
Measurement tools: Includes marketing mix modeling (MMM), multi-touch attribution (MTA), and incrementality testing for campaign optimization.
What Sets Supermetrics and Funnel Apart?
Supermetrics and Funnel approach marketing data differently. One focuses on pushing data into reporting tools, while the other focuses on storing and structuring it before you use it.
Data Integration and Connectivity
Supermetrics connects to a wide range of data sources using pre-built data connectors. It lets you push data into spreadsheets, dashboards, major BI tools, or data warehouses for marketing reporting.
Funnel uses its Data Hub to collect and store data first. It pulls in data from different marketing channels, then prepares it before sending it to reporting tools or other destinations.
Data Transformation and Modeling
Supermetrics offers no-code data transformation features. You can map fields, standardize naming, combine data, and create custom metrics using a point-and-click interface.
Funnel focuses more on structured data preparation. It stores raw data, normalizes fields automatically, and lets you edit mappings after import, which helps keep data consistent when working with fragmented data.
Reporting and Visualization
Both platforms provide dashboards and reporting templates, and both connect to major BI tools like Google Data Studio and Power BI.
Most teams still rely on those tools for marketing reporting. That’s where they review results, analyze data, and present updates on marketing performance.
Pricing and Scalability
Supermetrics uses different pricing plans:
-
Starter starts at $44 per month
-
Growth starts at $177 per month
-
Enterprise plans are custom
Each plan sets limits on users, accounts per data source, and data refresh frequency, which determines how much data you can work with.
Funnel pricing starts higher:
-
Starter plans begin at $200 per month
-
Business plans start at $800 per month
-
Custom plans are available for enterprise customers
Higher tiers add more connectors, reporting options, and measurement features. All plans are billed annually.
Ideal Use Cases for Each Platform
Supermetrics is often used when marketing teams need to pull data from multiple ad platforms using a data connector and send it directly into dashboards for marketing reporting.
Funnel is commonly used by marketing and data teams that need to store raw data, standardize metrics, and prepare data for consistent marketing analytics.
Why Marketing Agencies Outgrow Supermetrics and Funnel
For many teams, the issues start with connectors and data coverage. Some platforms aren’t supported, or access is limited, which makes it harder to work with all the data from most ad platforms in one place.
Troubleshooting can also slow reporting. When a data connector breaks or data sync fails, fixing it can take time, especially without technical expertise. That delay often happens right before reports are due.
Data accuracy adds another step. If numbers don’t match, teams have to validate reports before sharing them, which slows down marketing reporting and creates additional review work.
Pricing becomes harder to manage as data volume grows. Supermetrics locks some connectors behind higher tiers. Funnel can get expensive when sending data to multiple destinations or integrating with tools like Tableau or Snowflake.
At that point, reporting includes repeated checks, ongoing fixes, and more time spent making sure the data is correct.
Is There a Better Alternative to Supermetrics and Funnel?
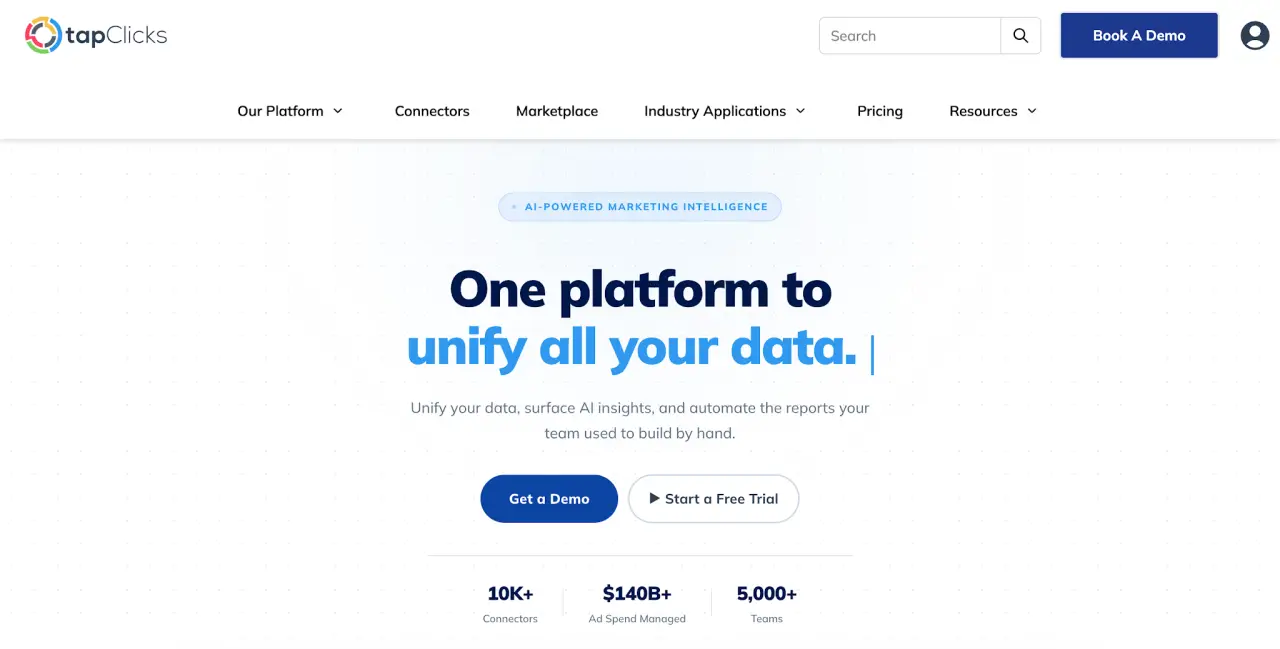
Supermetrics and the Funnel platform help organize marketing data. TapClicks extends that workflow into reporting, analysis, and client communication.
Connect Once to Your Data Sources
TapClicks connects to over 10,000 data sources, including ad platforms, customer relationship management systems, and offline files. TapData standardizes metrics, organizes campaign data, and prepares it for reporting or analysis.
You can send structured data to BI tools or data warehouses like BigQuery and Snowflake.
AI-Powered Insights for Marketing Analytics
SmartReports lets you create reusable report templates and schedule delivery, so recurring updates go out without exporting data or reworking reports each time. Reports are ready when you need them, without extra steps.
AI Insights Agents review campaign data and highlight performance changes, risks, and trends as they happen. Instead of scanning multiple dashboards, you get surfaced insights you can use during client conversations.
One Platform Without Fragmented Data Workflows
TapClicks combines data integration, reporting, dashboards, and AI into a single workflow. It includes data security controls like role-based access and audit trails, along with support for the California Consumer Privacy Act (CCPA).
If your data pipeline prepares your data, TapClicks helps turn it into reports, insights, and client-ready deliverables.
Turn Performance Data Into Client-Ready Reports With TapClicks
Supermetrics and Funnel focus on moving and organizing data. They connect to different platforms and send results to dashboards, data lakes, or storage layers like Google Cloud Storage.
This detailed comparison shows that while both tools handle data movement, the explanation doesn’t come with it.
You’re still the one looking at the numbers, figuring out what changed, and turning that into something a client or stakeholder can understand.
TapClicks adds that missing layer. With SmartStory, your marketing performance data turns into a presentation you can actually use in a conversation.
The slides, visuals, and written insights are already there, so you’re not piecing everything together before sharing results.
It also helps improve data delivery performance. Reports and presentations are generated in a format you can send as-is, without reworking layouts or rewriting summaries.
FAQs About Supermetrics vs Funnel
What is the main difference between Supermetrics and Funnel?
Supermetrics is often used to send data straight into tools like Google Sheets or dashboards. Funnel stores your data in its own system first, so you can organize and standardize it before sending it out.
Do Supermetrics and Funnel offer AI capabilities?
Supermetrics has built-in agents that help you run quick analysis, and you can set up custom AI workflows if you want to go deeper. Funnel has Data Chat, where you can ask questions and get answers from your data without rebuilding reports.
What is the best alternative to Supermetrics and Funnel?
TapClicks is worth considering if you need more than data delivery. It connects your data, prepares reports, and includes written context, so you’re not starting from a blank page when you need to explain performance.