Customer Journey Analytics: See the Full Customer Path
Customers rarely convert after one interaction. A buyer might click a paid ad, revisit your website, compare options, and speak with sales before making a decision.
Customer journey analytics helps teams see how those interactions connect throughout the buying process.
This guide explains how it works, why it matters for marketing teams, and how TapClicks turns journey data into clear reports and insights.
Book a demo to see how TapClicks can support your customer journey reporting.
TL;DR
-
Customer journey analytics tracks how buyers interact with your business before and after conversion.
-
It helps marketers understand which campaigns, pages, and channels influence purchase decisions.
-
Many companies struggle with fragmented reporting, inconsistent metrics, and disconnected data.
-
Customer journey analytics platforms connect buyer activity into a unified view for better attribution and performance analysis.
-
TapClicks automates journey reporting through dashboards, AI summaries, client reports, and connected marketing data.
What Is Customer Journey Analytics?
Customer journey analytics tracks how people interact with your business throughout the buying process. It helps marketers see how prospects move between channels before they convert, disengage, or return.
Someone might discover your brand through a Google search. Later, they may revisit your website through an email campaign or social media ad. Others compare pricing pages multiple times before contacting sales.
Most companies already collect information through customer relationship management (CRM) systems, marketing automation platforms, websites, and web analytics tools.
The problem is that this information often remains siloed in separate systems, making it difficult to see the complete path to conversion.
Customer journey analytics solves that problem by bringing interaction data into a unified view. This helps marketers identify where buyers lose interest and measure which interactions lead to conversions.
A journey map outlines the stages of the buying experience. Customer journey analytics reveals what actually happens at each step using behavioral and historical data.
Customer Journey Stages Behind Every Conversion
People move through different stages before they buy, renew, or recommend a product. Each stage reveals unique behaviors and decision-making patterns.
Customer journey analytics helps marketers identify those patterns and understand what influences decisions throughout the buying process.
Here are the five stages marketers typically examine during journey analysis.
1. Awareness Stage
The awareness stage captures first impressions. Someone may discover your company after searching Google, reading a blog article, or clicking a paid ad.
Marketers often study website visits during this stage to understand which campaigns attract attention. Traffic source data from Google Analytics can also reveal which marketing channels introduce new audiences to the brand.
2. Consideration Stage
The consideration stage starts when buyers begin evaluating options more seriously. Many visitors return to product pages several times before contacting sales to read reviews or compare pricing information.
Analytics tools help marketers study user behavior during this stage. For example, they can identify which pages keep visitors engaged and which pages cause people to leave the site.
3. Decision Stage
The decision stage reflects clear purchase intent. A prospect may request a demo after reviewing product features or schedule a sales call after comparing pricing options.
Customer journey analytics platforms connect those touchpoints into one timeline. That makes it easier to understand which interactions influence conversions before a deal closes.
4. Retention Stage
The retention stage focuses on the customer experience after the sale. Some people contact support during onboarding to get help using a feature. Others stop logging in to the platform after the first few weeks.
Historical data helps marketers identify patterns linked to churn, repeat purchases, and buyer satisfaction. Those journey insights can reveal where shoppers lose interest after converting.
5. Advocacy Stage
The advocacy stage begins when satisfied users recommend a business to others.
For instance, someone may leave a public review after resolving an issue with support. Another may refer to coworkers after using the product for several months.
Marketers often connect referral activity to lifetime value and broader business outcomes. That data helps identify which experiences drive referrals and repeat purchases.
How Customer Journey Analytics Connects Customer Data
Customer journey analytics software helps teams connect buyer touchpoints and measure how marketing efforts influence revenue.
Below are the core capabilities used to uncover behavior patterns and conversion trends.
Unified Customer Views
Website activity may appear in Google Analytics while sales conversations remain inside a CRM. Feedback may stay on support platforms. Each system captures only part of the buying journey.
Data integration brings those records together, making it easier to review the full history of interactions without comparing disconnected reports.
According to Cleanlist, companies with siloed data report 36% lower sales productivity and 27% fewer closed deals, showing how disconnected systems can affect sales performance.
Journey Stage Dashboards
Journey stage dashboards help companies study how visitors progress through the buying journey. A product page may attract heavy traffic while demo requests stay low. That pattern can reveal unclear messaging, weak product positioning, or missing information.
Visualization tools organize real-time data into reporting dashboards. You can monitor key metrics such as repeat visits, pricing page activity, and form submissions without exporting raw data into spreadsheets.
Customer Segmentation
Customer journey analytics platforms group audiences based on buying behavior. One report may focus on first-time visitors who downloaded a guide. Another may focus on returning buyers who revisited product pages before purchasing.
These audience segments help teams identify pain points that traditional web analytics often miss.
Attribution and ROI Measurement
Attribution reporting links touchpoints to a single conversion history. A marketer can trace how a prospect opened an email campaign, revisited a landing page two days later, and booked a demo after reading a case study.
This analysis shows how engagement contributes to pipeline activity and revenue.
Real-Time Insights and Alerts
Many customer journey analytics platforms monitor audience activity through machine learning and predictive analytics. Those systems can detect unusual engagement patterns before conversion rates decline further.
For example, a sudden decline in demo requests may reveal a broken form or campaign issue.
Why Customer Journey Analytics Feels Disconnected
Customer journey analytics gets complicated once interactions span multiple channels.
A company may track email engagement in one platform and offline data sources somewhere else. Traditional analytics often captures only part of the buying journey.
Those disconnected systems create data silos. Marketing may report strong campaign performance while sales struggle to convert leads from the same campaign.
It also becomes harder to recognize the same buyer when records differ between platforms.
Manual reporting creates another issue. Many companies still export reports manually and compare numbers line by line before leadership meetings. Minor reporting mistakes can distort attribution numbers and reporting accuracy.
Reporting pressure increases as marketing campaigns expand. A workflow that handles ten campaigns can fail once hundreds of ads and landing pages enter the reporting system.
Teams then spend hours correcting reporting errors and comparing conflicting numbers before analyzing performance.
How to Implement Customer Journey Analytics
Most customer journey analytics projects follow the same foundation. Here are the steps companies use to organize engagement data into reports that produce actionable insights.
Step #1: Define Your Customer Journey Stages
Start with the stages buyers actually pass through before purchasing. Most software companies track first visit, product research, demo requests, renewals, and referral activity.
Each stage should connect to a measurable customer action. Pricing page visits may signal buying interest. Booked demos often signal active product evaluation.
Step #2: Connect Customer Data From Every Channel
Effective journey analytics depends on complete reporting from every place where shoppers interact with your business. Customer activity may appear in CRM records, support tickets, or survey responses.
Cross-channel data matters because buying decisions rarely happen in one visit. A prospect may research products on a phone, revisit the website later from a laptop, and contact sales days afterward.
Marketing teams that collect data from online and offline channels can study the complete buying journey with more context.
Step #3: Build Dashboards Around Real Customer Activity
Journey dashboards should answer specific reporting questions that marketers and sales teams review regularly, such as:
-
Which campaigns generate qualified leads?
-
Which landing pages lose visitors before form submissions?
-
Which audience segments return after the first visit?
An analysis workspace with drag-and-drop tools helps business users study campaign performance without waiting for analysts to prepare reports.
Those dashboards also support further analysis when customer behavior changes unexpectedly.
Step #4: Automate Customer Journey Reporting
Manual reporting often slows analytics efforts. Employees still compare campaign numbers manually and prepare reports before meetings.
Automated reporting tools refresh client reports automatically and distribute updates on schedule.
Some platforms also generate summaries that explain traffic changes, conversion declines, or unusual engagement patterns.
Step #5: Test and Refine the Customer Journey
Customer journey analytics should guide testing decisions. A business may shorten a checkout form after noticing abandonment rates increase.
Those updates improve the buying experience by addressing real user behavior. For example, repeated checkout abandonment may indicate that visitors find the payment process confusing.
Survey responses and support conversations can also reveal sentiment and feedback that standard conversion reports fail to capture.
How TapClicks Turns Customer Journey Analytics Into Automated Reporting
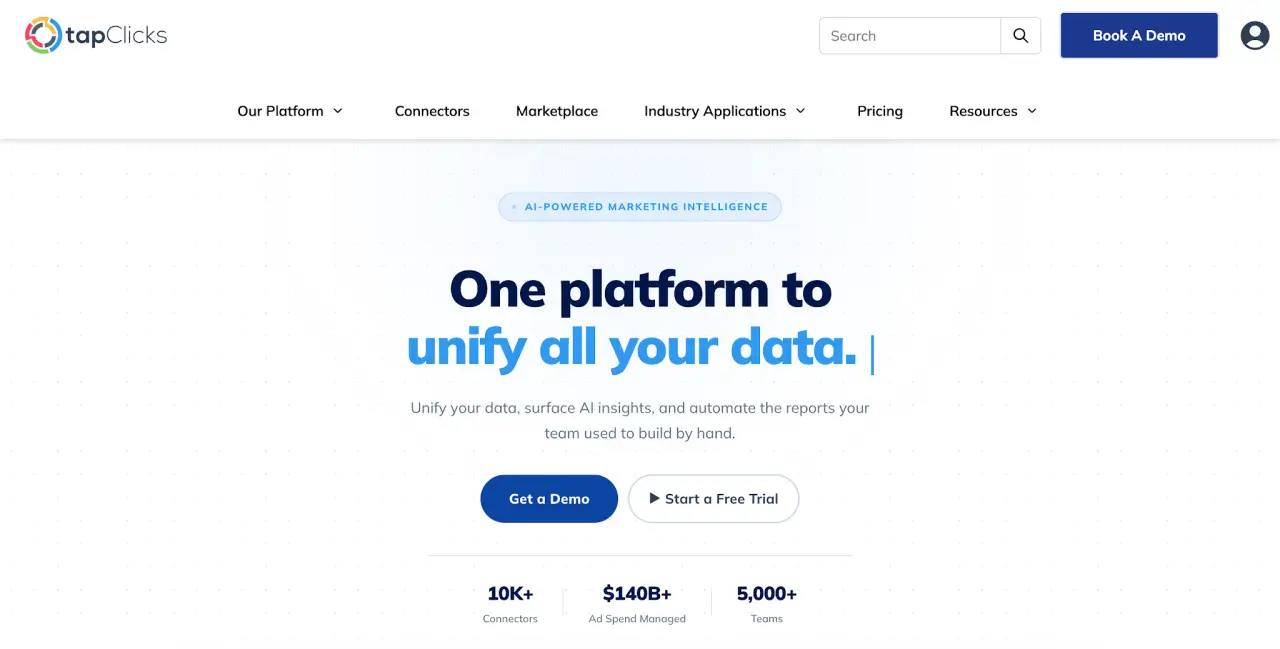
TapClicks organizes customer journey analytics into one reporting system, so you don't have to pull numbers from separate platforms manually.
Unlike traditional web analytics, the platform connects campaign data, CRM activity, email engagement, and offline reporting into one connected view.
TapData standardizes campaign names and metric definitions after you connect your data sources. That keeps reports consistent between platforms and prevents conflicting attribution numbers.
SmartAnalytics gives you live dashboards for campaign monitoring and further analysis. You can group data through custom channels, compare performance trends, and study campaign activity without rebuilding reports manually.
Here are some of the reporting tasks TapClicks automates:
-
Scheduled client reports through SmartReports
-
AI-written summaries through SmartEmail
-
Presentation decks through SmartSlides
-
Interactive dashboards through SmartAnalytics
-
AI benchmarking and anomaly detection through SmartSuite
You can also customize reporting views through drag-and-drop tools. Clients and stakeholders can review reports through mobile apps instead of waiting for exported files.
Organize Customer Journey Data With TapClicks
Customer journey analytics should explain why campaigns convert, where leads disappear, and which channels influence revenue. Reports lose value when campaign data stays fragmented between platforms and client accounts.
TapClicks helps agencies, brands, and media companies organize reporting inside one platform. The company supports more than 10,000 data connections and manages more than $140 billion in ad spend for over 5,000 teams.
Enterprise hierarchy tools organize reporting by brand, region, location, and campaign. Role-based access controls keep client data separated between accounts and business units.
The platform also automates recurring reporting tasks. You can schedule automated client reports, distribute AI-written summaries, and monitor campaign changes through live dashboards.
Customer journey analytics can provide valuable insights when reporting data stays consistent between platforms.
Book a TapClicks demo to explore how the platform manages reporting for large marketing operations.
FAQs About Customer Journey Analytics
Is CJA part of AEP?
Yes. Customer journey analytics (CJA) is part of Adobe Experience Platform (AEP). It uses Adobe’s Experience Data Model (XDM) to analyze customer activity from websites, mobile apps, CRM systems, and offline sources in one reporting system.
What are the five stages of the customer journey?
The five stages are awareness, consideration, decision, retention, and advocacy. These stages track how someone discovers a brand, evaluates options, purchases a product, and eventually recommends the business to others.
What are the seven steps to map the customer journey?
Customer journey mapping starts with defining business goals and buyer personas. Companies then analyze engagement points, study behavior patterns, identify pain points, visualize the experience, and update the map based on feedback.