
10 Best PPC Reporting Tools for Better Ad Insights
Manual reports slow you down and make it harder to stay focused. PPC reporting software helps you improve your PPC efforts, track results, and fix what isn’t working.
Leading PPC agencies already use these tools to save time and show clear progress. In the current digital marketing, sharp reporting is what you need to stay ahead.
In this article, you’ll find ten PPC reporting tools that simplify reporting and help you make smarter decisions.
Let TapClicks build your PPC reports. Book a demo with TapClicks today!
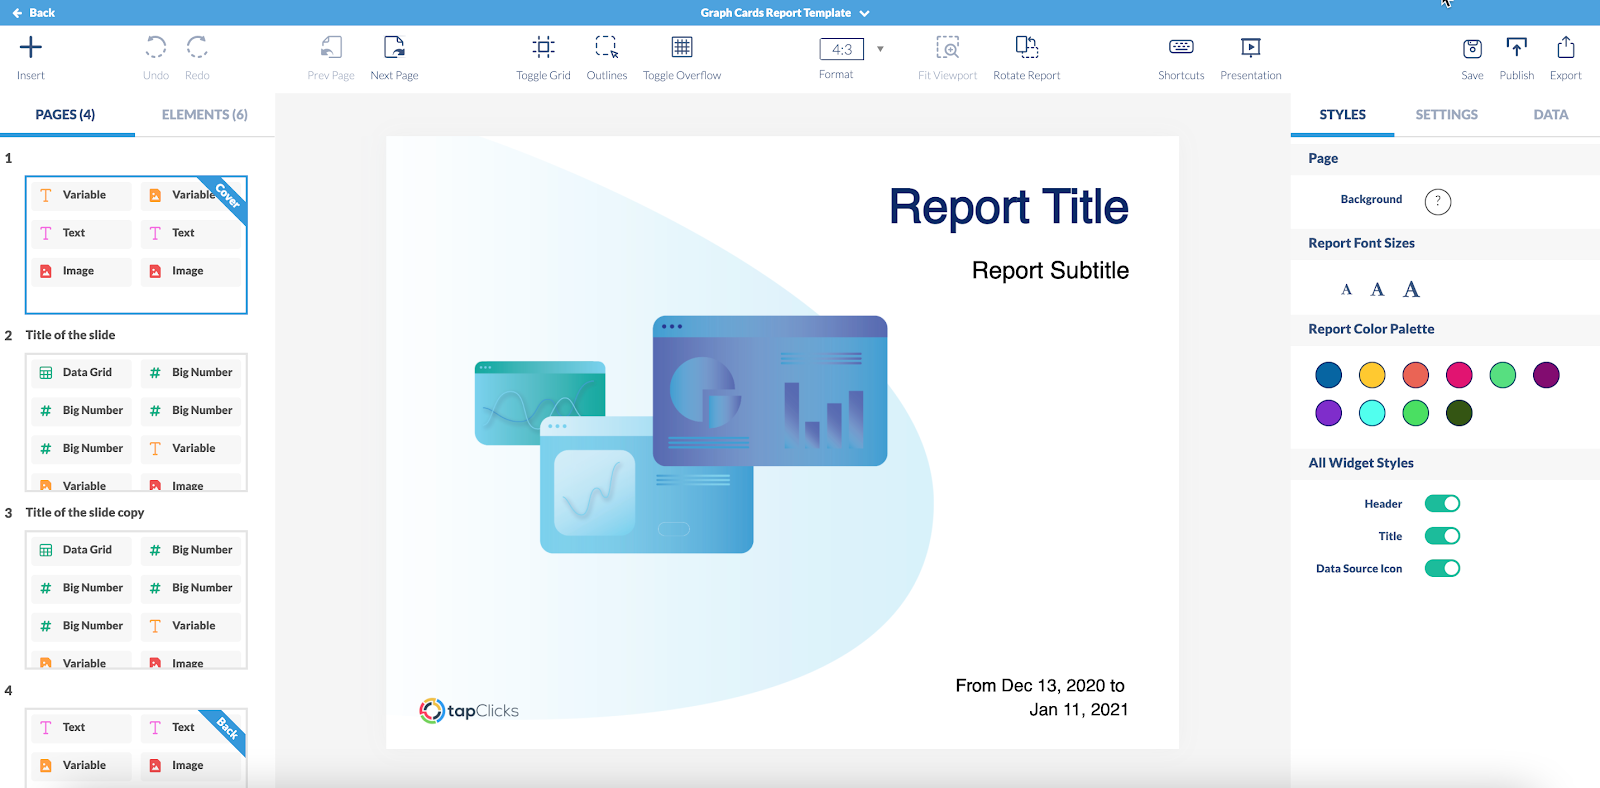
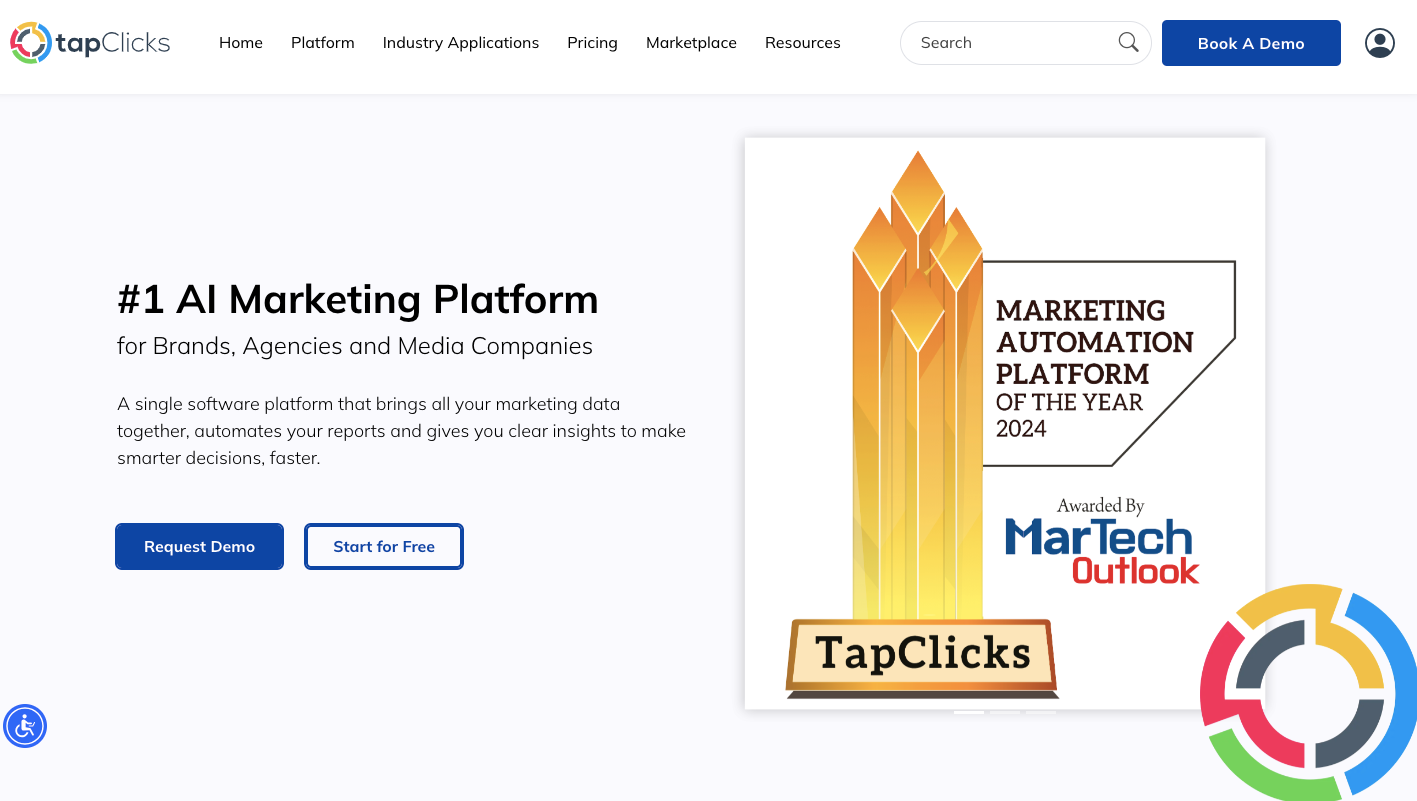
1. TapClicks
If your team manages PPC across digital and traditional channels, these TapClicks features will help you simplify, scale, and save hours each week:
Pull Data From Every Source Without Using Extra Tools
Many tools limit how much data you can pull. Most stop at common digital channels, such as Google and Microsoft Ads, and overlook broadcast media or enterprise DSPs. If you run cross-channel campaigns, that approach creates work you shouldn’t have to do.
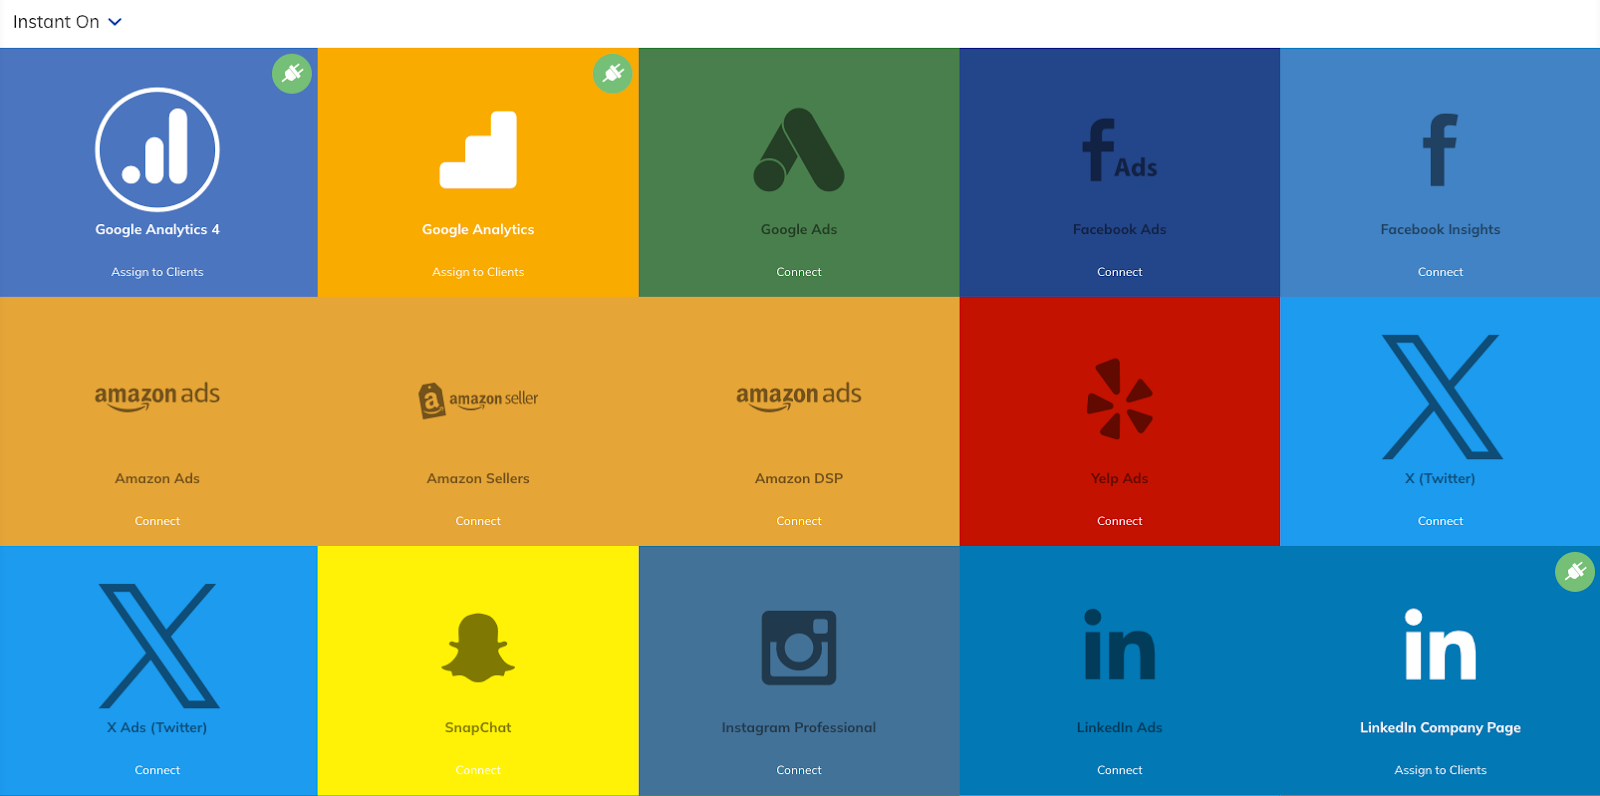
TapClicks connects with over 250 marketing platforms, including Google Ads, WideOrbit, Salesforce, and even Snowflake. It also integrates with lesser-known tools like Verve or Genius Monkey. For anything else, you can build custom connectors with Smart Connector.
We further have more than 6,000 unique data sources. It pulls historical data automatically and refreshes daily. You never need to chase down APIs or rely on your dev team for a fix.
Everything stays connected behind the scenes. Once you plug in your sources, TapClicks keeps them flowing with zero maintenance. That means faster, cleaner reports for every campaign.
Store and Access All Your Marketing Data in One Place
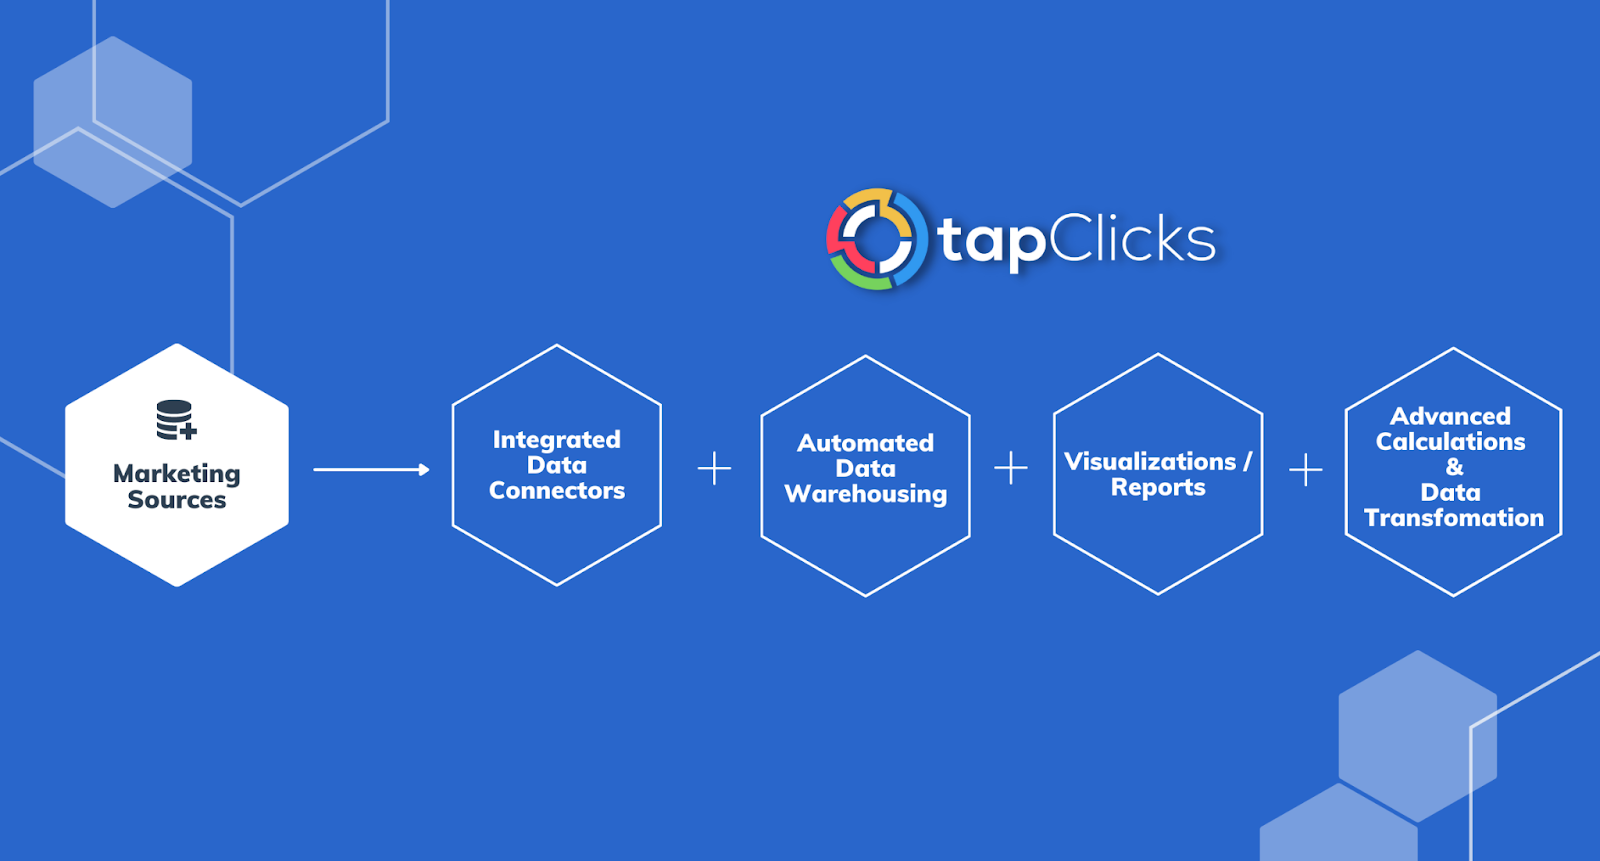
Some platforms wipe data after a few weeks or months. Amazon Ads only keeps 60 days, for example, which makes year-over-year comparisons tough. With TapClicks, you’ll never lose valuable data due to time limits.
Your data lives inside a fully managed warehouse, maintained and accessible through the TapClicks platform. You won’t need a developer to retrieve past campaigns. Everything stays in one place, available to your entire team.
Build reports, visualize performance, or export what you need without writing any SQL. TapClicks turns your raw history into usable insights. Once stored, the data remains ready for your next deep dive or performance audit.
All of it happens within the same system.
Automate Complex Metrics
Crunching performance metrics in spreadsheets wastes time. You shouldn’t have to repeat formulas every month for every client. TapClicks lets you define custom metrics once and reuse them across dashboards and reports.
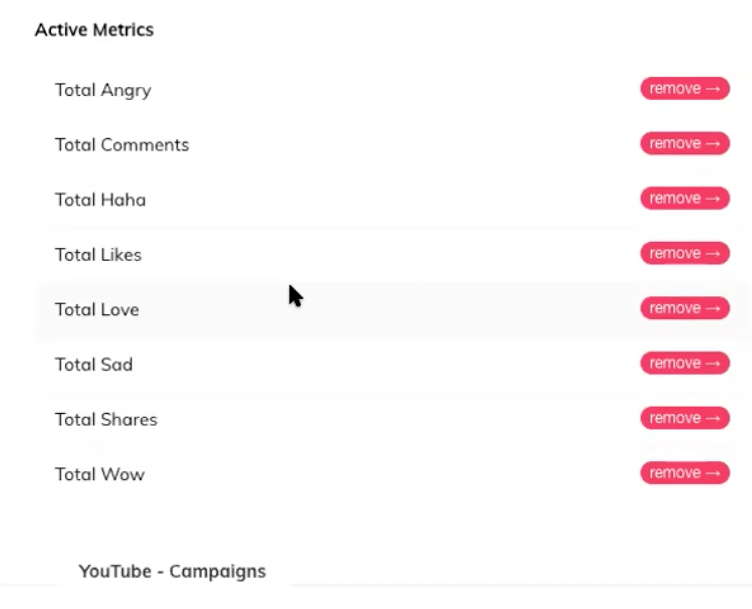
Create umbrella metrics like “Total Social Engagement” to combine clicks, reactions, and views from multiple platforms. Set logic once and apply it to every future campaign. TapClicks automatically pulls the correct data and calculates the result for you.
Advanced use cases are just as easy. If you run dozens of ads for different product lines, you can tag campaigns and view totals by region, brand, or type. TapClicks handles the grouping and math, no spreadsheet required.
Once built, each metric updates with fresh data. You only have to create it once. From there, it’s drag, drop, and done across your entire reporting workflow.
Customize Dashboards
TapClicks uses templates that apply changes globally. Add a new chart to your Facebook Ads dashboard and roll it out to all accounts instantly. If a client doesn’t need it, just toggle the filter and hide it from view.
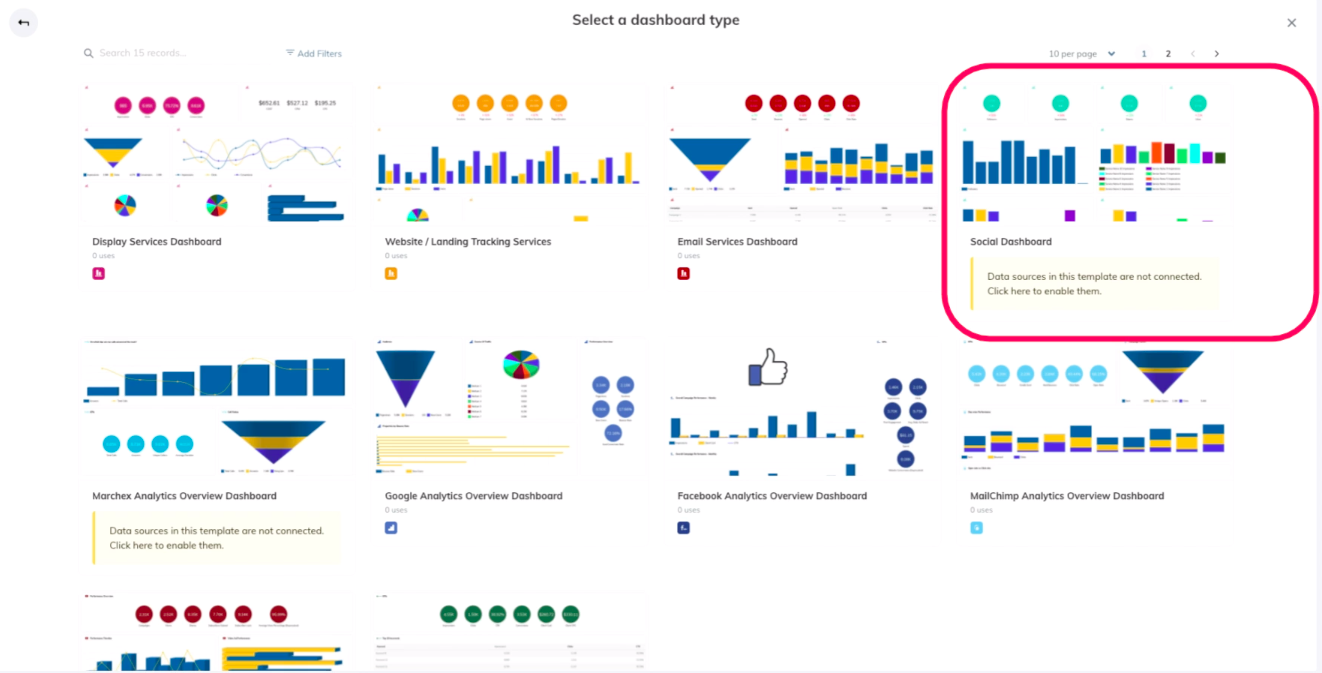
No tool limits how many dashboards you can create. Even if you’re managing 10 or 100 clients, each gets a custom layout that pulls from the same foundation. You decide who sees what and when.
Stakeholders can check performance anytime with login access. You can also restrict visibility at the widget level, so sensitive data stays private. Everything updates automatically without extra clicks or steps.
Turn Dashboards Into Reports That Update Themselves
Manual reporting slows down your team. Copying visuals from dashboards into static decks takes hours and invites mistakes. TapClicks ReportStudio changes that by building client-ready reports from live data.
Choose from ready-made templates or design your own. Reports update automatically with fresh metrics, charts, and calculations. You don’t need to pull or paste anything again.
Set up your delivery schedule and walk away. Reports can go out weekly, monthly, or whenever your campaigns close. Stakeholders always receive the latest view without needing to ask for it.
You control what each viewer sees. Use permissions to customize each version by client, region, or team. Once set up, reports run in the background while your team focuses on performance.
Eliminate manual reporting with dashboards that update daily. Book a demo with TapClicks!
2. Supermetrics
Image Source: supermetrics.com
Supermetrics makes it easier to pull data from multiple platforms without manual work. If you manage ads across different channels, it helps you stay organized and spend less time copying numbers between spreadsheets.
Reports pull in performance data from Google Ads, Facebook Ads, Google Analytics, and many other sources, all into tools you already use, like Google Sheets, Excel, or Google Data Studio. It can also deliver data to destinations like BigQuery and Snowflake.
Many PPC marketers choose Supermetrics because it automates the time-consuming parts of the process. You can track clicks, conversions, and return on ad spend with frequent automated updates (near real time, depending on the source).
Templates are also available, so you don’t have to start from scratch.
The platform, however, doesn’t come with built-in dashboards, but it gives you the data in a format that works with your current setup. Reports update automatically, which helps you respond quickly and optimize campaigns.
Pros
-
Connects to over 100 platforms and tools
-
Integrates well with Google Ads, Facebook Ads, and Google Analytics
Cons
-
Requires outside tools for charts and visual dashboards
-
Learning curve may be steep for users without experience in data tools
Pricing
Supermetrics plans start at $47 per month for destinations like Google Sheets, Looker Studio, Excel, and Power BI. For other connectors, pricing isn’t listed publicly.
3. AgencyAnalytics
Image Source: agencyanalytics.com
AgencyAnalytics gives you control over client reporting without adding extra tasks to your day. The platform supports PPC campaigns across channels like Google Ads, Facebook Ads, and Bing, and lets you track metrics, such as clicks, impressions, CPC, and conversions.
If you manage several accounts, you’ll benefit from tools that organize all your PPC data into dashboards and branded reports. You can build custom widgets, automate delivery schedules, and give your clients a login to access professional reports.
For teams that want to integrate multiple data sources, AgencyAnalytics connects with over 80 platforms, combining SEO, paid ads, and social analytics into a single interface. Database connectors, like MySQL, BigQuery, and Redshift, are available as paid add-ons, not included in standard plans.
Many marketing agencies use AgencyAnalytics for quick turnaround. You can apply ad markups, run comparisons across time periods, and even track campaign profitability.
When you’re focused on PPC optimization, having live access to accurate numbers makes a huge difference when it comes to testing and adjusting budgets.
Pros
-
Supports 80+ integrations, including SEO, PPC, and social tools
-
White-labeling with your logo, colors, and even custom domains
Cons
-
Limited control over how some SEO and domain metrics are pulled
-
Data blending across different platforms can be restrictive, and some integrations may experience refresh delays or broken connections
Pricing
The Freelancer plan is $79 per month for up to five clients. The Agency plan is $239 per month with ten clients, while Agency Pro allows up to 15 clients and costs $479 per month.
4. Whatagraph
Image Source: whatagraph.com
You don’t need to switch between tools to track performance across channels. Whatagraph, a PPC reporting software, brings your data together so you can stay focused on results.
With over 50 integrations, you can connect platforms like Google Ads, Facebook, email, and SEO tools in minutes.
If you handle multiple clients, you’ll save hours every week using scheduled reports and real-time dashboards. You can design custom reports that match your branding and give clients access to live performance views. That kind of control makes the reporting process easier to manage and easier to explain.
You’ll also find built-in tools for marketing analytics, so you can blend data across campaigns and turn separate results into one clear story. No need for complicated code or separate spreadsheets.
Many digital marketing agencies choose Whatagraph for automated PPC reporting because it simplifies updates and keeps reports current with minimal effort.
Pros
-
Brings together SEO, ads, and social platforms
-
Pulls data from multiple sources and allows automated reporting
Cons
-
Folder management and custom integrations feel limited
-
Some report layouts can be restrictive with advanced data
Pricing
Whatagraph pricing isn’t listed publicly.
5. Databox
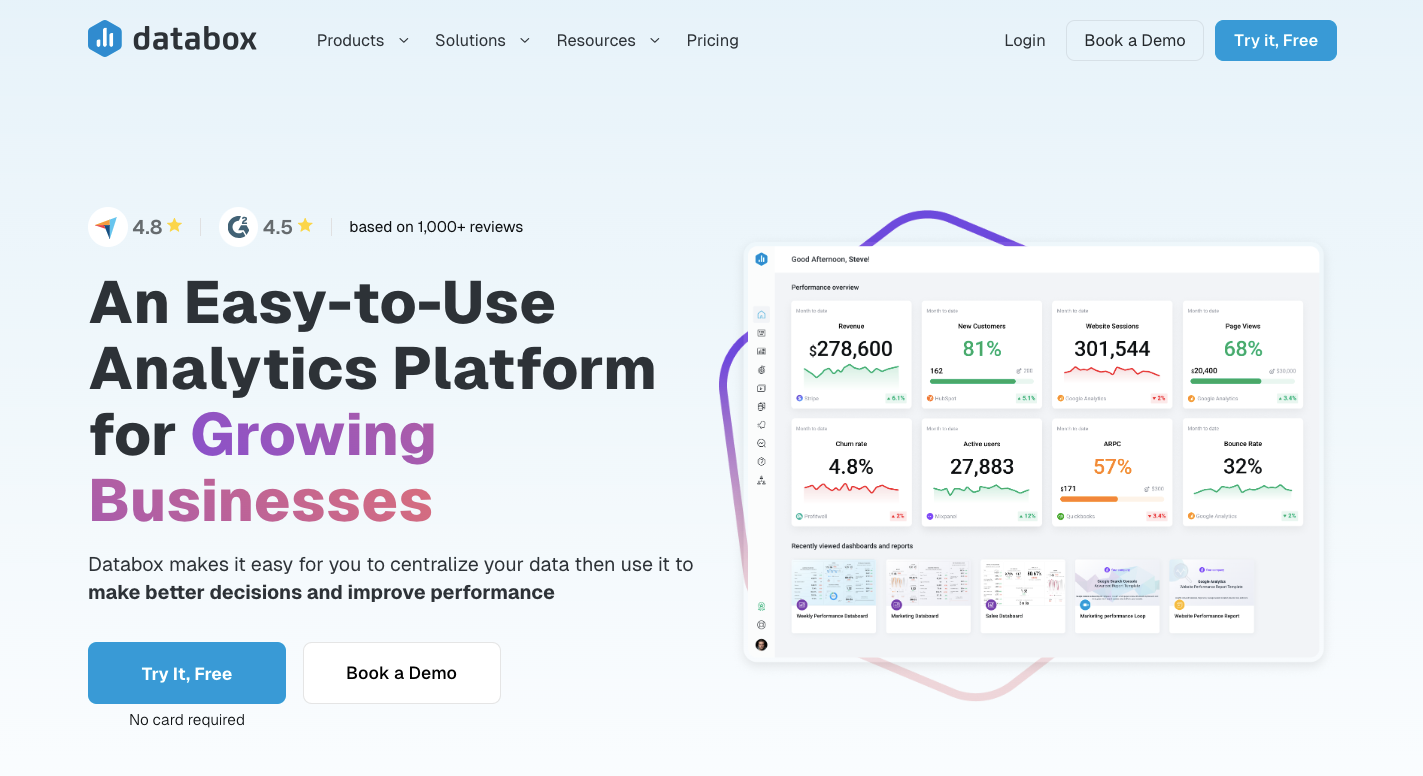
Image Source: databox.com
Databox helps you track performance across channels in one place. You can create visual reports and dashboards that pull live numbers from your most important sources. That means fewer tabs and more time to focus on decisions that drive results.
Connecting to over 100 major platforms, Databox lets you track data from Google Analytics, HubSpot, and more. You can even pull in custom data through spreadsheets or SQL. If you’ve struggled with scattered metrics, it makes it easier to organize and understand your numbers.
Running multiple advertising campaigns can create a mess of metrics. Databox keeps it clean by offering real-time alerts, performance goals, and AI-powered summaries. Those updates often come with actionable insights that help you adjust fast.
It further offers customizable reports you can adjust for clients, managers, or internal use. If you’re focused on refining your PPC strategy, it helps you stay aligned and clear on what’s working.
Pros
-
Supports easy drag-and-drop dashboards
-
Tracks KPIs, forecasts results, and sends alerts
Cons
-
Some delays with large datasets or custom metric changes
-
Template stability can vary depending on the source
Pricing
Databox offers a free version. Paid plans start at $59 per month for Starter, $199 per month for Professional, $399 per month for Growth, and $999 per month for Premium.
6. Improvado
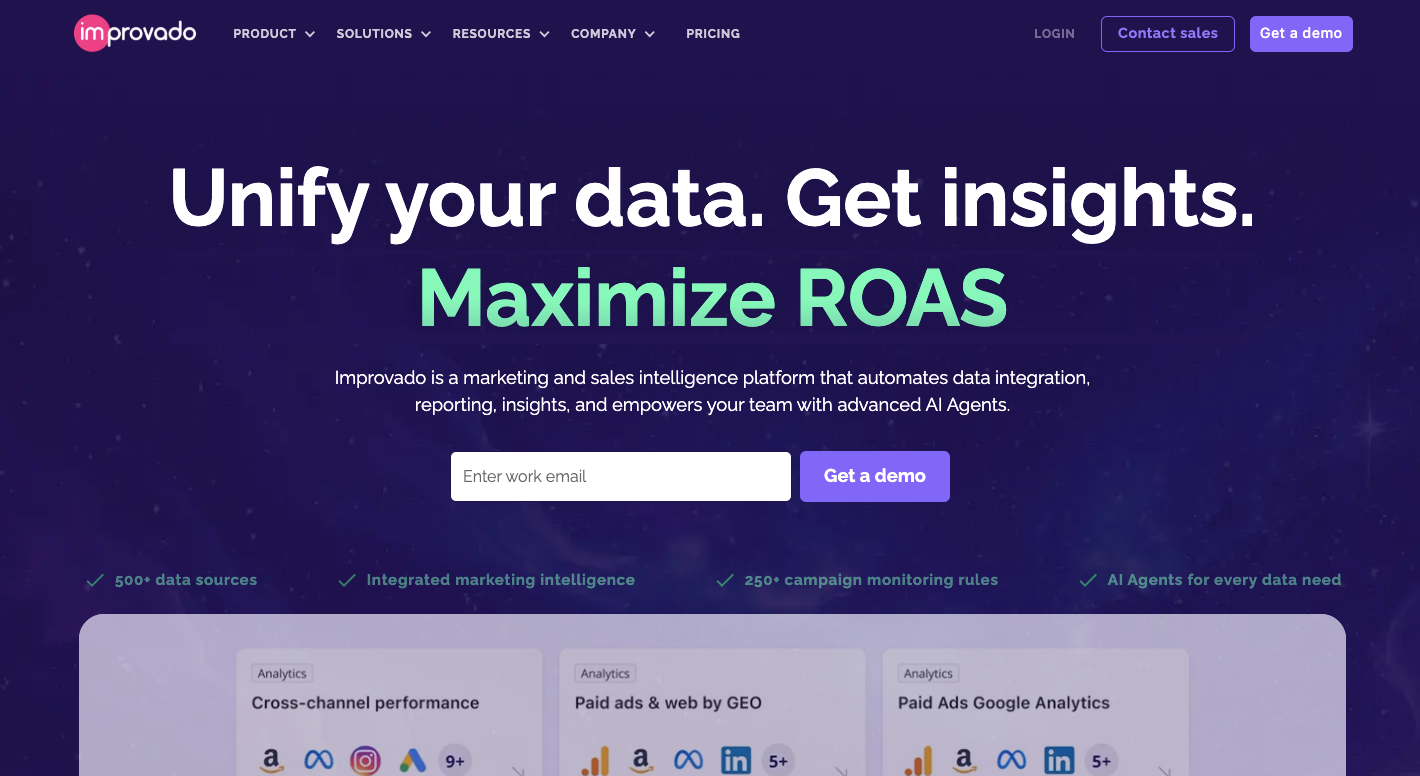
Image Source: improvado.io
Managing data across Google Ads, Facebook, HubSpot, and other tools can drain hours from your week. Improvado fixes that by pulling everything into one space.
It connects with over 500 marketing and analytics platforms, which give you a place to work with all your numbers. You can skip the manual exports and get right to the analysis.
Need to build reports for different departments or clients? You can create and send multiple reports straight from platforms like Looker. Each dashboard is customizable, so you can match the layout to what your audience needs to see.
Looking at your ad spend without context doesn’t help. Improvado keeps your performance metrics in order by syncing data frequently and automatically, with refresh intervals depending on the source. You’ll spot trends across each PPC ad, track key metrics like ROAS and CPC, and make quicker calls on what’s working.
If you need to manage campaign budgets with more control, the built-in automation saves time and cuts errors. Expect accurate data, faster report generation, and clear insight across campaigns.
Pros
-
Connects with 500+ platforms for full data access
-
Speeds up reporting with automated pipelines and clean formatting
Cons
-
Has a steep learning curve, especially for first-time data users
-
Mixing data from different platforms may take setup time
Pricing
Improvado doesn’t show pricing online.
7. Looker Studio
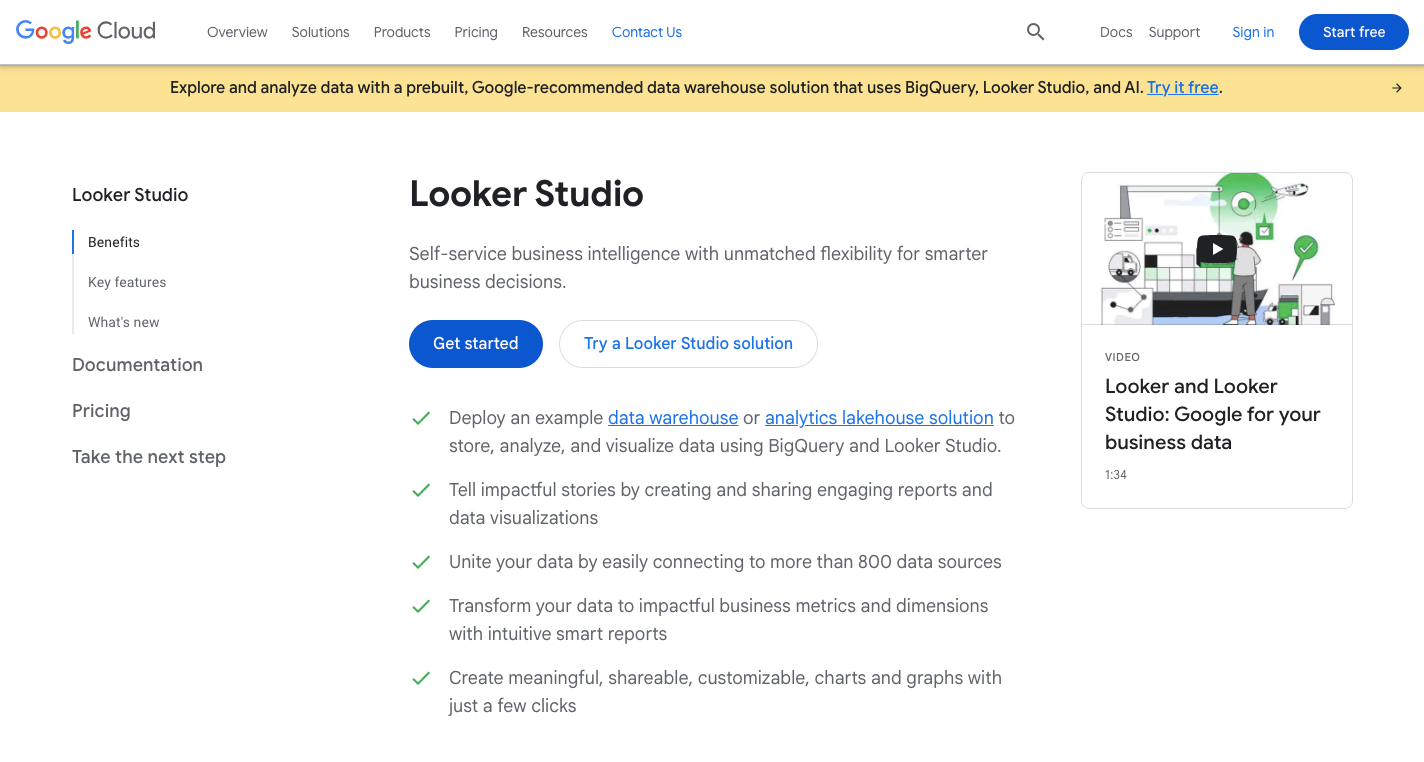
Image Source: cloud.google.com
Looker Studio (formerly Google Data Studio) helps you turn raw PPC numbers into dashboards that actually make sense. You can connect data from Google Ads, Analytics, Sheets, and BigQuery in just a few clicks.
Once your data is in, the drag-and-drop setup makes report building fast. It doesn’t require code or special training, so you can move quickly from data to decisions.
Creating Google Ads reports feels easy here. Filters, date ranges, and interactive charts let you show ad performance without extra work. The tool supports cross-channel reporting too. You can compare paid search data against organic traffic, email, or social campaigns inside the same dashboard.
The platform also works with everything Google owns, so it’s a natural fit if your teams are already deep into the Google stack.
Sharing is simple. You can send live links or automate email updates so no one misses the latest numbers.
Smaller teams appreciate the free version. Larger ones use Looker Studio Pro for added features like team workspaces and scheduled delivery.
Pros
-
Connects well with Google Ads, Analytics, and Sheets
-
Allows you to collaborate on reports and dashboards
Cons
-
Slows down when handling large datasets
-
There’s a limit on the number of data sources you can blend together
Pricing
Looker Studio’s basic version is free, while Looker Studio Pro starts at $9 per user per project each month.
8. Google Analytics 4
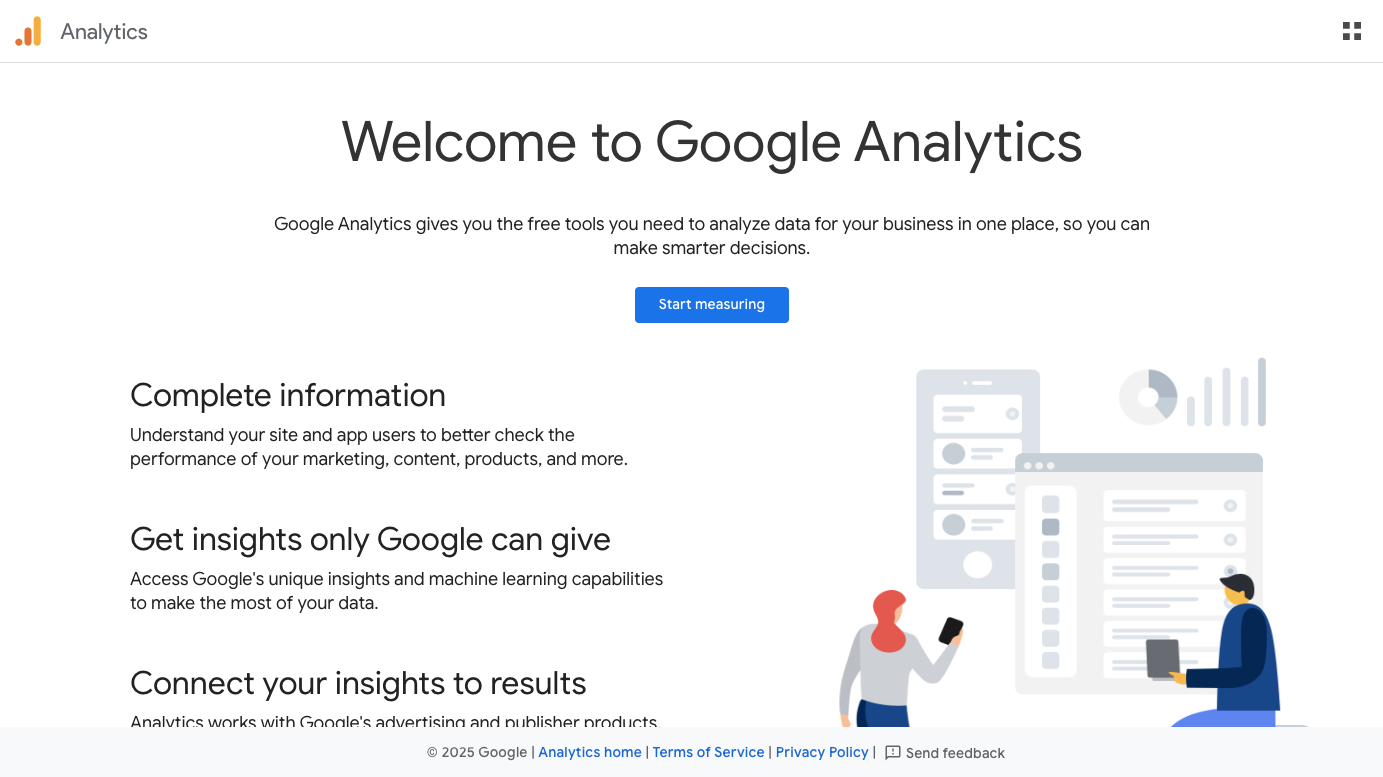
Image Source: analytics.google.com
Google Analytics 4 (GA4) gives you a full view of how people interact with your website or app. Real-time reports let you see activity as it happens, while acquisition and engagement reports help track where traffic comes from and what content gets attention.
Monetization reports break down how much revenue comes from e-commerce, in-app purchases, or ads. Dashboards and custom reports make it easy to track key metrics.
You can explore user behavior through funnel analysis, audience breakdowns, and conversion tracking. These tools help pinpoint drop-offs and highlight opportunities to improve flow.
The event-based model in GA4 makes it easier to log specific actions like clicks, downloads, or video views. Smart Goals and predictive features help identify which actions lead to results.
If you’re running ads, the direct integration with ad platforms like Google Ads makes it easy to analyze Google Ads performance in one place. That includes insights into search ads, audience segments, and budget impact. For those handling both web and app traffic, GA4 brings everything together in a single view.
Google Analytics also links with Firebase, BigQuery, and other tools for deeper insight and advanced custom reports. Privacy features such as behavioral modeling and cookieless tracking help you stay compliant.
Pros
-
Tracks web and app data in one platform
-
Exports raw data to BigQuery for flexible reporting
Cons
-
Learning GA4’s new layout takes time
-
Collects personal data, which could raise privacy concerns
Pricing
Google Analytics 4 is free to use. There’s also an enterprise version, Google Analytics 360 (GA4 360), which starts at $50,000 per year.
9. Semrush
Image Source: semrush.com
Managing paid ads, SEO, or content across multiple channels can overwhelm even the most organized marketer. Semrush offers you one place to handle everything. You can research keywords, track rankings, monitor competitors, and build reports without switching between tools.
If you’re running paid search campaigns, Semrush helps you dig into your competitors’ ad copy, spot keyword trends, and improve your bidding strategy. You’ll also get deep analytics into backlink profiles, domain strength, and traffic patterns, which helps identify where to focus next.
Many marketers rely on the platform’s keyword research tools to find new opportunities and evaluate content performance by location, volume, and keyword difficulty.
When you’re monitoring activity across marketing channels and social media platforms, Semrush gives you scheduling, analytics, and reporting in one place. You’ll see how your posts perform, track engagement, and stay ahead of the competition with real-time data.
From spotting SEO gaps to refining Google Ads copy, Semrush becomes a main part of your workflow. It also supports local SEO, helps manage link-building, and tracks rankings based on Google search.
Pros
-
Covers SEO, paid ads, content, and social media all in one
-
Offers detailed tools for backlinks, keywords, and rank tracking
Cons
-
Limited seats per subscription can restrict team use
-
Keyword data may vary depending on the country of focus
Pricing
Semrush Pro plan starts at $139.95 per month. Then the Guru plan is $249.95 per month, while the Business plan is $499.95 per month.
10. Reporting Ninja
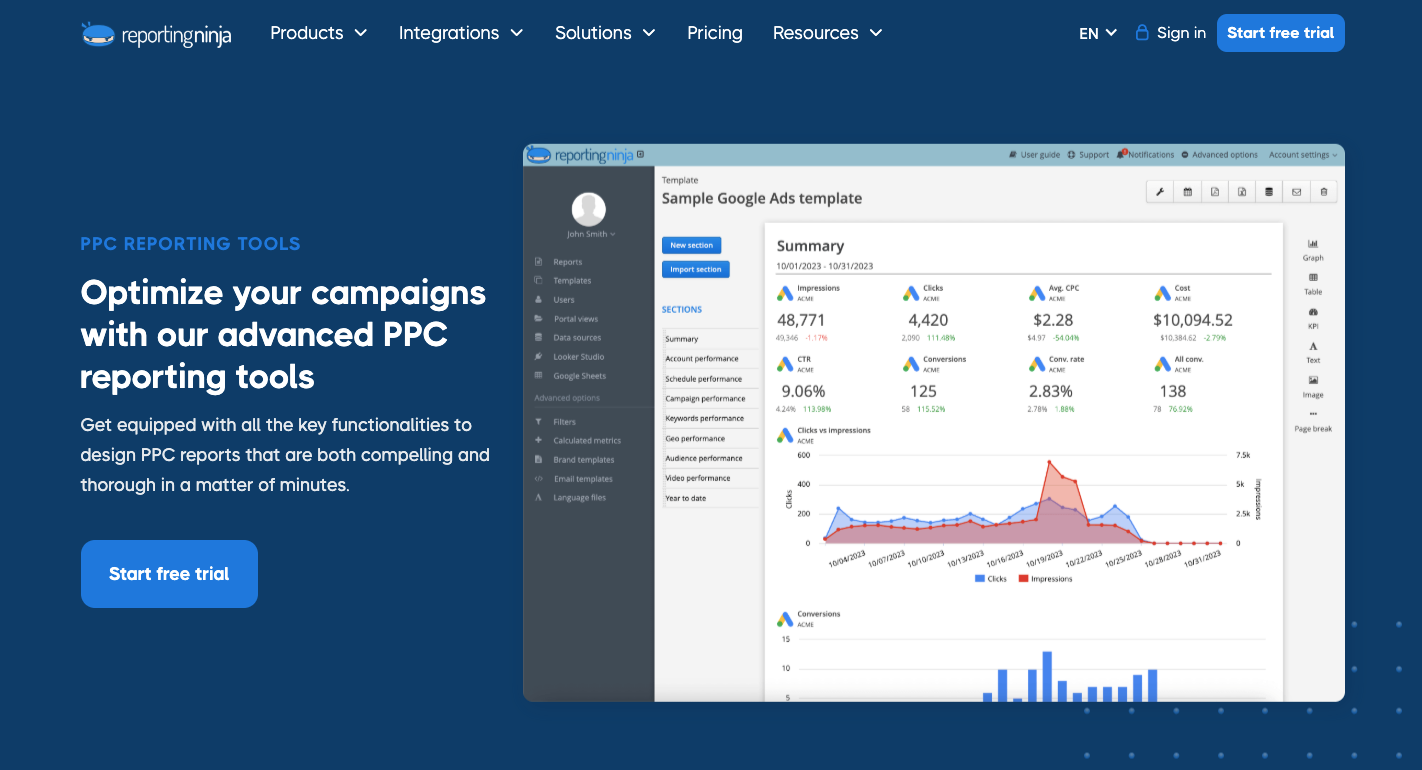
Image Source: reportingninja.com
Reporting Ninja supports integrations with platforms like Google Ads and Bing Ads to let you combine campaign data without switching tools. That alone helps reduce time spent jumping between tabs or exporting spreadsheets.
Building custom reports works through a drag-and-drop system. You can start from a blank page or tweak pre-made templates. Each report supports logos, brand colors, and client-specific widgets, so your reporting feels polished from the start.
You can automate cross-channel reporting with just a few clicks and schedule delivery daily, weekly, or monthly. That means no more scrambling at the last minute to send performance updates.
For agencies with multiple clients, the client portal provides a centralized way to manage access. Clients log in, view updates, and interact with real-time data. The tool also includes ROI and ROAS visualizations, plus SEO and PPC ad tracking options.
Everything ties into an interface that delivers performance insights without extra complexity. When questions come up, customer support responds quickly.
Pros
-
White-label reporting and automated delivery save hours each month
-
Combines SEO, PPC, social media, and email marketing
Cons
-
Widget customization may feel limited to some users
-
Integration list isn’t as broad as larger reporting suites
Pricing
Reporting Ninja has a Starter plan, which costs $20 per month. The Small plan costs $40 per month, the Medium plan costs $70 per month, and the Large plan costs $120 per month.
Put an End to Manual PPC Advertising Reporting With TapClicks
Manual reporting slows down campaign optimization and drains resources. TapClicks eliminates those delays by connecting to all major PPC platforms and pulling in real-time data automatically.
Every metric, chart, and calculation stays current without constant updates. Reports send themselves on schedule, personalized for each client, without extra clicks or copy-paste routines.
Use your time to refine strategy, not format slides. TapClicks brings accuracy, speed, and scale to your reporting process so you can focus on improving results.
Automate your PPC reporting process and spend more time optimizing. Book a demo with TapClicks!
FAQs About PPC Reporting Tools
What is the best PPC reporting tool?
The best PPC reporting tool helps you save time, eliminate data chaos, and actually improve results. TapClicks offers a clear edge if you manage multiple campaigns or clients. It pulls in metrics from hundreds of ad platforms, builds dashboards you can reuse, and creates reports that update automatically. You’ll spend less time wrangling spreadsheets and more time optimizing PPC strategy.
What is PPC reporting?
PPC reporting is the process of collecting, analyzing, and presenting data from pay-per-click advertising campaigns. Reports often include metrics like impressions, clicks, conversions, cost-per-click (CPC), and return on ad spend (ROAS). The goal is to track performance, identify trends, and make data-backed decisions that improve results.
What is a PPC tool?
A PPC tool helps you manage and optimize pay-per-click advertising campaigns. It can automate tasks like keyword research, bid adjustments, ad creation, competitor analysis, and performance tracking. Many PPC tools also provide built-in reporting features to simplify how you measure outcomes and refine strategy.
How do you track PPC performance?
You track PPC performance by monitoring key metrics such as impressions, clicks, conversions, click-through rate (CTR), CPC, and ROAS. Platforms like Google Ads and Bing Ads offer built-in dashboards, but advanced tools like TapClicks let you integrate all your PPC data across channels, visualize performance in custom dashboards, and generate reports automatically.