
Advertising Analytics Tools: Build vs. Buy
Advertising Analytics Tools: Build vs. Buy

Without an advertising analytics tool, the ability of marketers to understand their data is severely limited. Whether you're an agency needing to demonstrate results for clients, or a marketing department needing to justify advertising budgets, this type of tool is essential.
It's common for businesses that do advertising analytics to dedicate a portion of their information architects and engineers to building and maintaining their own analytics tools in house. The thinking is: We have the resources to build this in house, so why should we pay a third party for it?
And while in-house teams are often perfectly capable of executing this, it tends to become a costly and time-consuming system to maintain.
Why? Because to do it correctly you need:
- Reliable data connectors that maintain API connections as they're updated by their respective platforms.
- Connectors that get you the metrics you need including relevant historical data from your advertising platforms.
- Connectors that pull data from CRM platforms and eCommerce sites.
- Dashboards that allow your team to analyze cross-channel data.
Plus, it's increasingly difficult to gain insights, such as the profitability of a digital marketing campaign, without the ability to tie a campaign to actual sales. This is where your marketing team can benefit from segmenting ad campaigns using advanced calculations in your analytics tool, where the customer journey from the first click to the final conversion is more apparent.
These are things we learned over the past decade of building reporting and analytics products to serve hundreds of agencies and many of the biggest media companies in the U.S.
In this post, we're going to show you what it looks like to use the latest version of TapClicks as your all-in-one advertising analytics tool, from setting up our instant-on connectors to creating detailed marketing reports.
Looking for a better way to manage and analyze your advertising data? Try our 14-day free-trial to see how TapClicks can transform your business.
1. Set Up Your Connectors
The process of building and managing your own connectors is increasingly difficult. This is because data sources are constantly and without warning changing how their API works, which means your connectors can break without you realizing it. If this happens, you'll get inaccurate data from your campaigns, leading to faulty conclusions.
Plus, building a connector (let alone managing it) is time-consuming. There are thousands of data points you may need to pull from a single advertising platform. And if you don't build the connector correctly, you're not inputting all the relevant data sets into your analytics tool.
At TapClicks, we use instant-on connectors and smart connectors.
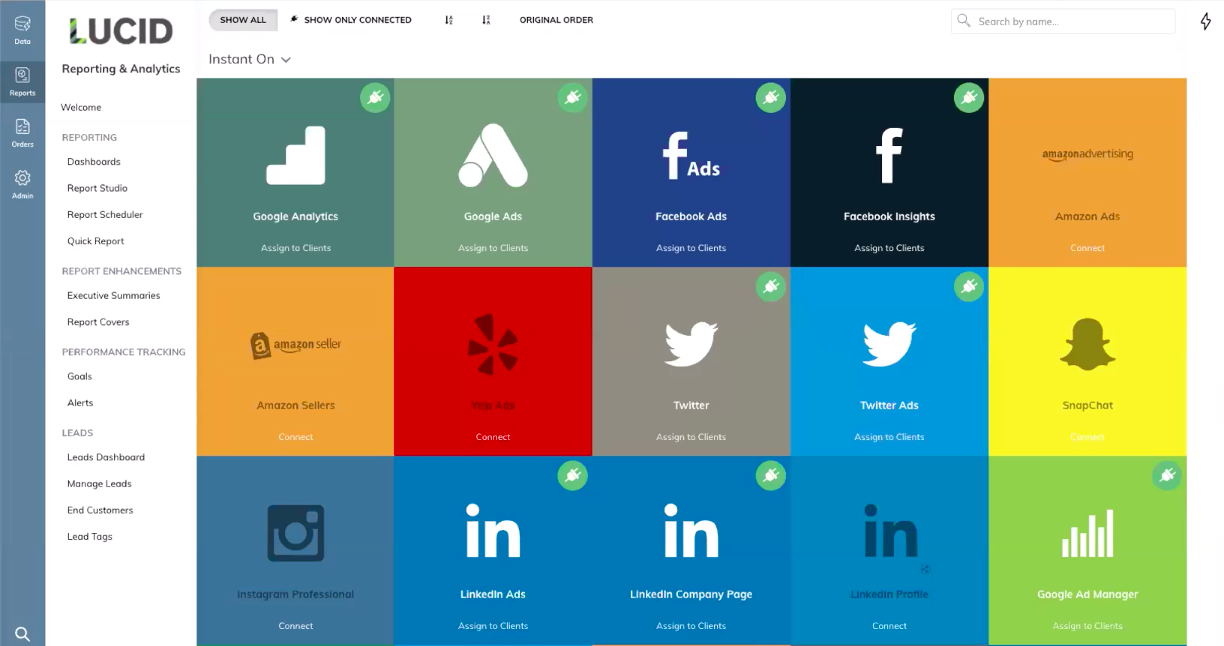
Our 240+ instant-on connectors can usually be set up in a day. For example, if you click on our Google Analytics connector you will be prompted to log in to your account. Once you do, your connection will be live. We have instant-on connectors ranging from web analytics platforms to common social networks.
Smart connectors are a way of pulling third party data into the TapClicks platform where we don't have pre-established API connections. They work by connecting your data to TapClicks using csv, xlsx, tsv, and odf file formats.
By using both instant-on connectors and smart connectors, we can get the majority of the data needed into your analytic tool. The data is pulled in real-time and is automatically refreshed, which means your advertising team only needs to set up the connector once.
Plus, by using TapClicks connectors, you're given access to historical data. Once the connection with your ad platforms is established, TapClicks pulls the last 12 months of marketing data into your dashboard.

This means you don't have to wait for new campaign performance data to kick off strategic decision-making, because you can view KPIs such as landing page views, click-through rates (CTR), and conversion rates (CVR) to identify which ads have been the most effective for you in the past year.
2. View Data in Your Marketing Dashboard

If you're using tools like Google Data Studio (GDS) or Tableau as a way to analyze your marketing efforts, you're required to use multiple dashboards to view your data.
That means if you're an agency running four campaigns for a client, then you're going to need four dashboards. Or if you're a brand that's overseeing various regions and campaigns, then you're going to need a dashboard for each unit.
Having to manage a dashboard for every client or campaign limits your ability to scale. Most marketing teams are running several campaigns per client, and without an efficient analytics tool, it's often difficult for them to take on new clients without hiring more account managers.
Similarly, in-house marketing teams are often handling several campaigns at once and constantly need to share updates with internal stakeholders. Having to send out multiple reports from separate dashboards is time-consuming.
When we made TapClicks, we took customer feedback and made it so you can view all campaigns, clients, and marketing channels from one dashboard.
Here's how it works.
On your main dashboard, you get a high-level view of your marketing performance. As you can see in the example below, we've pulled impressions, clicks, CTR, and spend. These are metrics grouped together from disparate sources, such as Facebook Ads, Google Search Ads, and LinkedIn Ads.

You also get monthly trends that give a quick snapshot of the historical performance of your campaigns, making it easier to answer questions with your data at a glance.
When you scroll further down your analytics dashboard, you see a side-by-side view of your metrics.

These valuable insights are great for quick data analysis. Instead of having your stakeholders filter through various reports, they can look at one dashboard for accurate insight into the performance of ongoing campaigns across multiple platforms.
You can also filter your results to get market or client-specific data. If you only want to look at social media analytics, then you could filter out any search engine data. Or if you just wanted to see SEO campaign performance in your Los Angeles market, you can filter out the other regions.
In this way, our marketing analytics dashboard can be as sophisticated or as simple as you need, given which report you're working on or who you're presenting data to.
Finally, we pull snippets of your ads into your dashboard, so you can review the ad side-by-side with its performance.

Let's say you're running A/B testing on a group of Facebook Ads. With TapClicks, you can view those ads within the same dashboard and see which ad is performing better.
3. Create Advanced Calculations for Campaign Attribution and Deeper Insights
Common analytics reports can highlight a positive return on ad spend (ROAS) but can't show whether that high ROAS equals a positive return on investment. This is because they're unable to tie campaign performance to actual sales.
With TapClicks, you can show an impact on your bottom line in two ways.
First, you can connect your eCommerce and CRM platforms to your advertising analytics tool. This lets you collect sales data which can then be viewed in the same dashboard along with campaign performance.
Second, you can create advanced calculations in TapClicks that will give you a better idea on the value of your ongoing campaigns. For example, we worked with a client that wanted to track the success of a remarketing campaign they were running on Reddit ads. The client wanted to see the actual sales that could be attributed to their Reddit campaign.
By using our advanced calculations feature, we were able to help our client monitor attribution by creating a formula within TapClicks that said if the UTM code in the URL includes a specific keyword unique to that campaign, then that sale will be segmented into a specific metric.
After setting up that advanced calculation, that client was able to view sales from their Reddit campaign within their marketing dashboard.
4. Easily Create Reports for Various Levels of Expertise

Before using TapClicks, some of our customers reported that their account managers spent nearly 30 hrs of their workweek creating reports for both external and internal stakeholders.
We've heard from clients who had to start their end-of-the-week reporting at the beginning of the week because the process was so fraught and time-consuming. These teams were responsible for getting the data sets into their dashboards, organizing them into widgets, and then analyzing and interpreting the data. After that, the account manager still had to export the data into a PDF or PPT file and send it to the appropriate parties.
If they were sending a report to different stakeholders, they often had to make different versions of the same report. If you're delivering a status report to your direct manager, it's likely going to be more detailed and granular than the report that is sent to the founder or VP of Marketing.
Plus, it's not uncommon for stakeholders to respond to your report and ask a few questions that they don't see answered by the data you presented. This leads to you going back and re-creating the report.
All of this wasted time can be detrimental to the actual performance of your marketing campaigns. If your account manager is spending nearly 30 hours a week on managing reports, that means your account manager can't reasonably work on improving marketing strategies or be burdened with taking on new clients or new campaigns.
With TapClicks, we have multiple solutions for common marketing reporting problems agencies and in-house teams face.
- You can set up recurring reporting. Recurring reports go out when you need them to. Plus, you can create multiple reports, customized by stakeholder, from the same dashboard.
- One-off, custom reports are just as easy to make. When someone needs a unique report, simply log into TapClicks, filter out the metrics you don't need, set up the dates for the time period you want to pull data from and create the report.
- You can provide tiered access to stakeholders so they can view their marketing dashboard. If you want it so a client or higher-up can see the current ROAS of select campaigns or overall profitability, you can set up that dashboard and give them a login. Critically, you set up their access so the stakeholder only sees what you give them access to see. This is a huge win for agencies who can set it up so clients are seeing the value of their campaign, without being shown the associated markup of your services.
Plus, we offer white-label reporting, which allows you to brand your reports. As an agency, you can customize your reports towards your client's brand identity. Not only is this professional, but it also helps your agency stand out amongst other reports that your clients likely receive.
As an in-house marketing team, you want your reports branded with the company logo and colors because you don't want any confusion on what reports are being viewed. Plus, if you ever need to share your reports with an external team, you want them branded with your specific logo and metrics.
Looking to Streamline Your Marketing Operations?
An analytics platform works best when it uses advanced analytics to show the profitability of your marketing campaigns. But if you're relying on in-house analytics tools, you're limiting your ability to improve and scale your processes.
When brands and marketing teams realize they need a more customizable tool, they often try using various ETL tools to get data out of platforms and into reporting dashboards such as Google Data Studio.
But that solution is time-consuming and can turn your digital marketers into full-time data reporters.
We made TapClicks to give you advanced features that are intuitive and easy to incorporate into your business and to put them alongside the other marketing tools you need, with features like SEO rank tracking and competitive intelligence, and scalable workflow solutions.
Looking for a better way to manage and analyze your advertising data? Try our 14-day free-trial to see how TapClicks can transform your business.