How to Build a Marketing QBR Deck Clients Actually Read
A good marketing QBR deck is ten slides or fewer, opens with the one result the client cares about most, and ends with a decision the client has to make. It is not a tour of every metric you track. Build it around goals, what changed, and what happens next quarter.
Most QBR decks fail for the same reason: they are assembled the night before from screenshots. The client sits through 40 slides of impressions and click-through rates and leaves with no idea what to approve. This guide covers the agenda, a slide-by-slide template, and how to cut the build time with AI-generated slides.
What is a marketing QBR?
A marketing QBR (quarterly business review) is a scheduled meeting where an agency or marketing team walks a client or executive through the last quarter's results against goals, explains what drove them, and agrees on the plan and budget for the next quarter.
The word that matters is review. A monthly report tells the client what happened. A QBR tells them what it means and what to do about it. If your QBR deck could be replaced by a monthly report with a cover slide, it is not doing its job.
Why do QBRs matter for client retention?
QBRs are the one recurring moment where a client sees strategy rather than just numbers, which makes them a natural place to show the value behind the retainer.
The risk is real. In Setup's 6th annual Marketing Relationship Survey of 400+ brand and agency professionals, dissatisfaction with delivery was cited by 48% of clients, up 14 points from the prior year, as reported by Swydo. The same roundup cites Predictable Profits' 2025 Agency Growth Benchmark: eight-figure agencies retain 92% of clients annually, compared with 78% for seven-figure agencies.
Neither survey proves that QBRs cause retention, so treat the numbers as context, not a promise. If you are still weighing how reporting fits into retention, our post on why your marketing dashboard may be losing you clients goes deeper.
What should a marketing QBR agenda include?
A 60-minute marketing QBR agenda has five parts: an executive summary, results against goals, a keep-stop-start review, next quarter's plan and budget, and open discussion. Most guides land between 30 and 90 minutes; 60 is long enough for strategy and short enough to keep senior attendees.
Here is the split we recommend:
| Segment | Time | What the client should leave with |
|---|---|---|
| Executive summary | 5 min | The headline result and one sentence on why |
| Results vs. goals | 15 min | Which targets were hit, missed, or changed |
| Keep, stop, start | 15 min | What you will continue, drop, and try |
| Next-quarter plan and budget | 15 min | A proposal they can approve or push back on |
| Client context and open discussion | 10 min | Business changes you could not see in the data |
The keep-stop-start format is common in agency guides, including Swydo's retention playbook, because it forces you to name something you are going to stop doing. Clients notice when a review contains only good news.
Send the data ahead of time. A live, view-only dashboard works well as a pre-read, so the meeting is spent on interpretation instead of reading numbers aloud. (More on that below.)
What slides go in a QBR deck?
A marketing QBR deck needs ten slides: title, executive summary, goal scorecard, performance trend, channel breakdown, wins, misses and causes, keep-stop-start, next-quarter plan, and a decision slide. Anything beyond that belongs in an appendix the client can open if they ask.
| # | Slide | The question it answers |
|---|---|---|
| 1 | Title | Whose quarter, which period |
| 2 | Executive summary | What is the one thing to remember? |
| 3 | Goal scorecard | Did we hit what we said we would hit? |
| 4 | Performance trend | How did the quarter move, week by week? |
| 5 | Channel breakdown | Where did the results come from? |
| 6 | Wins | What worked, and why do we think so? |
| 7 | Misses and causes | What fell short, and what was the cause? |
| 8 | Keep, stop, start | What changes next quarter? |
| 9 | Next-quarter plan | What are we proposing, and at what budget? |
| 10 | Decisions needed | What do we need from you, and by when? |
Slide 7 is the one most decks skip, and it is the one clients trust most. If a campaign pacing issue or a tracking break cost the client money, say so, say what caused it, and say what now prevents it. Clients who hear about a problem from you in the QBR forgive it. Clients who find it themselves do not.
How do you pick the right KPIs for a QBR?
Pick three to five KPIs the client agreed to at the start of the quarter, and report those first. Everything else is supporting detail. If the client's goal was qualified leads, lead with cost per qualified lead, not impressions.
A quick test: for each metric on the scorecard slide, can you finish the sentence "this matters because it moves ___"? If not, it goes in the appendix. We cover how to choose and present metrics in more detail in our client report examples and templates.
How do you build a QBR deck faster with AI?
You can connect your campaign data once, let an AI layer draft the narrative and slides from it, and spend your time editing the story instead of pasting charts. The goal is not to remove judgment from the QBR. It is to stop spending hours on formatting.
The numbers on time savings vary a lot by team, so we will not promise a figure. For context, Smartsheet's 2025 Pulse of Marketing Report found that 84% of marketing professionals who use AI save five or more hours per week on average (cited by Swydo). Beta users of TapClicks SmartStory reported cutting slide creation from hours, or even days, down to minutes, per the launch announcement.

Use case: building a client QBR with TapClicks SmartSlides
Here is how the workflow looks in practice using SmartStory and SmartReports:
- Connect the data. Bring in the channels you ran during the quarter: paid search, paid social, display, email, SEO. TapClicks has pre-defined channel views, so you are not building every chart from scratch.
- Add context the data cannot see. AI Context lets you give TapClicks AI the background it needs: the client's goals, brand notes, last quarter's decisions. It accepts uploads such as PDFs, Word documents, and spreadsheets. This is what keeps the narrative from sounding generic.
- Generate the slides. SmartSlides drafts the presentation from the connected data, including visuals and written insights.
- Edit, then export. Rewrite the executive summary in your own voice and fix anything the client would push on. SmartSlides exports to PowerPoint or PDF, and templates can be reused for the next QBR, so quarter two starts from your edited version rather than a blank file.
- Send a live pre-read. Use TapClicks Permalink to share a live dashboard by link, without logins, in view-only or interactive mode. Attendees can look at the numbers before the call.
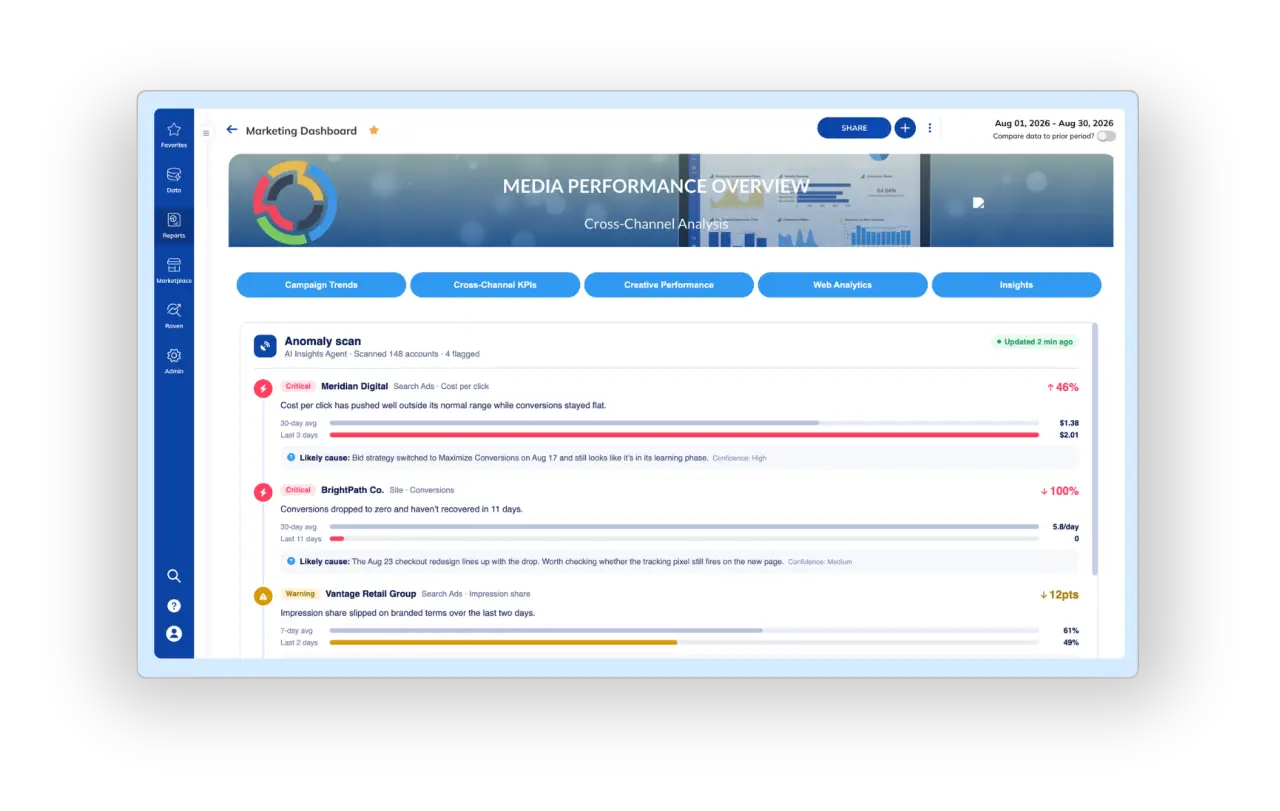
For the misses slide, AI Insights Agents can flag unusual changes and pacing issues during the quarter, so you are not trying to reconstruct a mid-quarter dip from memory in week 13. Our post on AI anomaly detection in marketing dashboards covers the seven situations where this helps most.
If you would rather automate more of the monthly cycle that feeds the QBR, see how to automate client marketing reports without losing the personal touch. It includes a case where an agency reported cutting monthly reporting time by more than 50% with TapClicks.
What are the most common QBR mistakes?
The most common QBR mistakes are showing too many metrics, hiding bad news, presenting without a recommendation, and sending the deck instead of presenting it. Each one turns a strategy meeting into a status update.
| Mistake | Why it hurts | Fix |
|---|---|---|
| 30+ slides | Attention is gone by slide 12 | Cap at 10, move the rest to an appendix |
| Vanity metrics first | Client cannot connect them to revenue | Lead with the agreed goals |
| No misses slide | Reads as spin, hurts trust | Name the miss, the cause, and the fix |
| No ask | Meeting ends with no next step | Close on a decision slide |
| Emailing the deck | No discussion, no buy-in | Present live and follow up within 48 hours |
One more habit worth stealing: send a short follow-up within a day or two with the top three takeaways and who owns each action. It is the cheapest way to make sure the meeting leads to something.
Frequently asked questions about marketing QBRs
What does QBR stand for in marketing?
QBR stands for quarterly business review. In marketing, it is a recurring meeting where a team or agency reviews the previous quarter's performance against goals with a client or executive and agrees on the next quarter's plan and budget.
How long should a marketing QBR be?
Aim for 60 minutes. Published agency guides range from 30 to 90 minutes. Shorter works for smaller accounts with one or two channels; longer works when senior leaders on both sides attend and the budget is on the table.
How many slides should a QBR deck have?
Ten or fewer in the main deck. Put channel-level detail, tests, and extra charts in an appendix so the client can ask for them without sitting through them.
Who should attend a marketing QBR?
The client's decision-maker for marketing, plus the agency lead who owns strategy. Include the analyst or channel specialist only if you expect technical questions. A QBR without a decision-maker present rarely produces decisions.
Can AI build a QBR deck?
AI can draft a first version from connected campaign data, including charts and written insights. You still need to edit the narrative, add business context, and decide what to recommend. Treat the output as a draft, not a finished deck.
What is the difference between a QBR and a monthly report?
A monthly report summarizes what happened. A QBR interprets a full quarter, reviews progress against goals, and sets direction and budget for the next one. The monthly report is an input to the QBR, not a substitute.
Build your next QBR from live data
If you run QBRs for more than a handful of clients, the slide-building is where the hours go. See how TapClicks SmartStory and SmartReports work, or explore the solutions for agencies.
Sources
- Swydo, "9 Client Retention Strategies That Actually Work for Marketing Agencies in 2026" (citing Setup's 6th annual Marketing Relationship Survey and Predictable Profits' 2025 Agency Growth Benchmark): swydo.com/blog/client-retention
- Swydo, "The Agency Guide to Marketing Reporting That Actually Retains Clients" (citing Smartsheet's 2025 Pulse of Marketing Report): swydo.com/blog/marketing-reporting
- TapClicks, SmartStory launch announcement: tapclicks.com/blog/press-releases
- TapClicks, TapAI: tapclicks.com/ai