6 Best AI Report Generators in 2026
Marketing teams aren’t short on data. They’re short on time to turn it into insights clients actually care about.
Hours disappear into exporting numbers, assembling reports, and writing summaries that still leave key questions unanswered.
That’s why the best AI report generators are gaining attention. They turn raw performance data into professional-looking reports.
This guide looks at the top AI report generators and shows how your campaign insights can finally start working in your favor.
TL;DR
Here are the best AI report generators for 2026:
-
Whatagraph
-
DashThis
-
Swydo
-
Databox
-
NinjaCat
What Is an AI Report Generator?
An AI report generator takes marketing data from sources like Google Analytics, ad platforms, and customer relationship management (CRM) systems, then turns it into client-ready reports.
It highlights key metrics, analyzes campaign performance, and adds written summaries in plain language.
Traditional report writing takes hours. Teams export data, format charts, and explain results by hand. AI reporting tools shorten that process by turning raw data into visuals, insights, and narrative commentary with far less manual input.
Adoption is increasing. According to Thomson Reuters Institute, the use of artificial intelligence in professional services grew from 22% in 2025 to 40% in 2026.
For marketing teams, that means faster updates, fewer errors, and reports clients can understand without a long explanation.
How AI-Generated Reports Replace Manual Marketing Reporting
An AI report generator starts by connecting your data sources. It gathers campaign data from Google Analytics, Meta, paid media platforms, and CRM systems, so updates don’t rely on constant exports.
Then it organizes the data so it lines up correctly. Campaign names, metrics, and formats often differ by platform, so the system standardizes those fields and combines related data points for accurate data analysis.
Next, it turns performance metrics into visuals. Charts, dashboards, and key performance indicators (KPIs) are generated using the latest marketing data, giving clients a polished view of results.
The AI also adds written context. Using natural language processing (NLP), it analyzes campaign performance and explains key trends, wins, and risks in plain language.
Finally, the finished output is delivered automatically. Reports, slide decks, and summaries reach stakeholders on a set schedule, ready for review and discussion.
Top 6 AI Report Generators to Know in 2026
These six AI tools help marketing teams turn campaign data into professional reports, presentations, and insights without manual assembly.
1. TapClicks
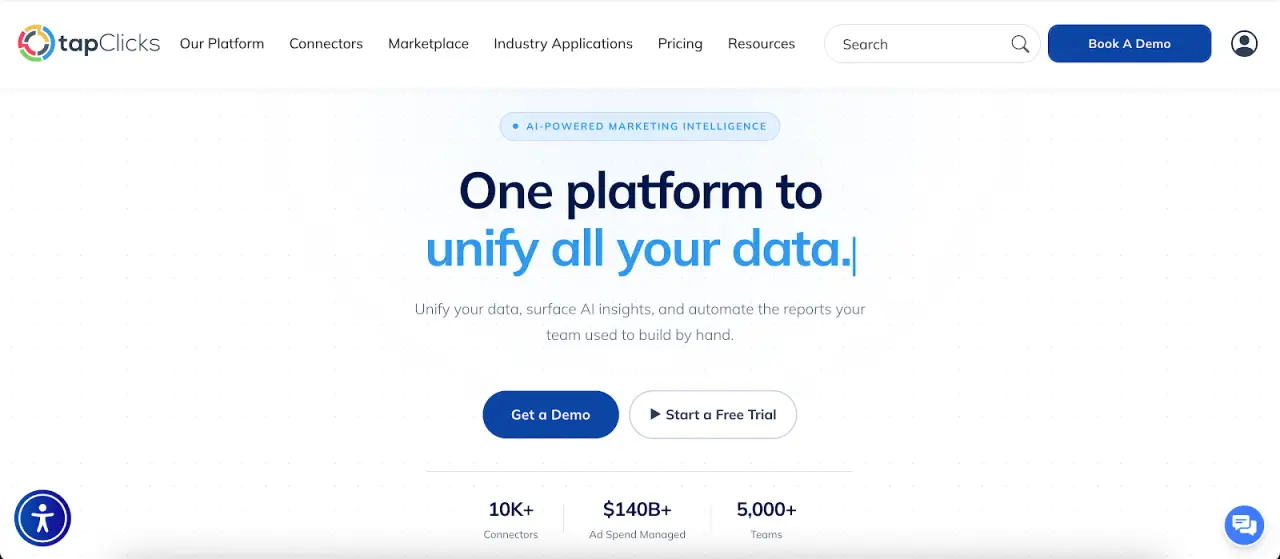
TapClicks is an AI report generator for teams managing complex marketing data. It connects source data, prepares it for analysis, and turns performance metrics into reports, slide decks, and written summaries.
Key features include:
-
Data auto-sync from 250+ sources
-
SmartSlides for branded, presentation-ready decks
-
SmartReports for repeatable reports and scheduled delivery
-
SmartEmail for AI-written email summaries
-
AI Insights Agents for campaign analysis and recommendations
-
Industry benchmarks for metric context
-
AI Context for brand guides, briefs, and strategy inputs
Connect and Prepare Campaign Data
TapClicks brings in data from paid media platforms, analytics tools, CRM systems, and custom sources through SmartConnector.
The platform standardizes campaign names, metrics, and fields, which is useful when Google Analytics, Meta, Amazon Ads, and offline sources use different naming rules.
That gives you a more reliable base for dashboards, data analytics, and AI-generated reports.
Turn Data Into Reports, Decks, and Emails
SmartReports lets teams create branded reports with templates, Report Studio, and a drag-and-drop interface. Marketing teams can send those reports daily, weekly, monthly, or on a custom schedule.
SmartSlides turns campaign data into branded presentations with visuals, metrics, and plain-language insights. Teams can export decks to PowerPoint or PDF for quarterly business reviews, weekly recaps, and leadership updates.
SmartEmail packages campaign results and AI-driven narrative insights into the email body. Stakeholders get performance highlights, risks, and recommendations without opening a dashboard or attachment.
Add AI Insights With Business Context
TapClicks uses AI Insights Agents to analyze campaign performance and surface wins, losses, pacing issues, and recommendations directly within dashboards and Report Studio.
AI Context allows brand guides, strategy documents, and briefs to be uploaded, so every AI-generated output reflects the account’s goals, tone, and background.
TapClicks stands out as an AI report generator that covers the full reporting process, from source data to polished delivery.
2. Whatagraph

Image source: whatagraph.com
Whatagraph focuses on report creation through prompts. You type what you want to see, and it generates a full report with charts, metrics, and written insights.
That makes it easier for non-technical users who don’t want to configure every widget or write summaries from scratch.
Whatagraph IQ handles report creation, edits, and analysis. It can generate full reports, add sections, create widgets, and write explanations based on your data.
It also standardizes naming, creates custom metrics, and combines data from multiple platforms, which helps when working with complex data.
Key features include:
-
Prompt-based report creation using Whatagraph IQ
-
AI-generated content for performance summaries in multiple languages
-
AI-assisted data transformation and custom metrics
-
60+ integrations with historical data support and BigQuery connection
-
White-label branding with reusable themes
-
20+ widget types for creative data visualization
-
Scheduled delivery with an optional review step
-
Spaces for organizing reports and templates
-
Version history for tracking report updates
3. DashThis
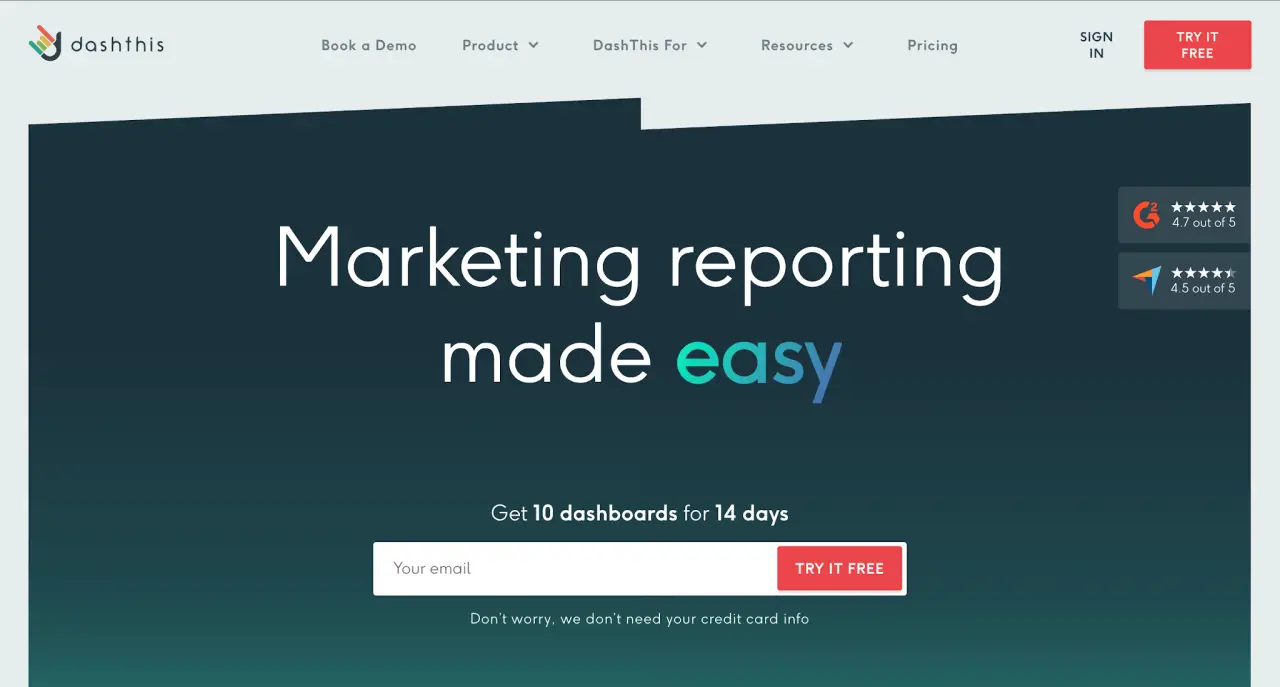
Image source: dashthis.com
DashThis turns marketing data into professional reports without a complicated setup.
You can connect over 30 platforms, choose a template, and your KPIs appear in a branded dashboard that you can share or schedule.
Its AI Insights feature reviews campaign performance and highlights wins, issues, and opportunities worth attention. It helps analyze data and turn complex reports into valuable insights, so you’re not left interpreting charts on your own.
Key features include:
-
30+ integrations, including Google Ads, Facebook, and Google Analytics 4
-
Preset templates and KPI bundles for fast report creation
-
AI Insights that highlight trends, issues, and opportunities
-
Chat Mode for follow-up questions and contextual insights
-
White-label customization with logos, domains, and branded emails
-
CSV and Google Sheets imports for custom reports
-
Scheduled delivery for automated reports generated and sent on time
4. Swydo
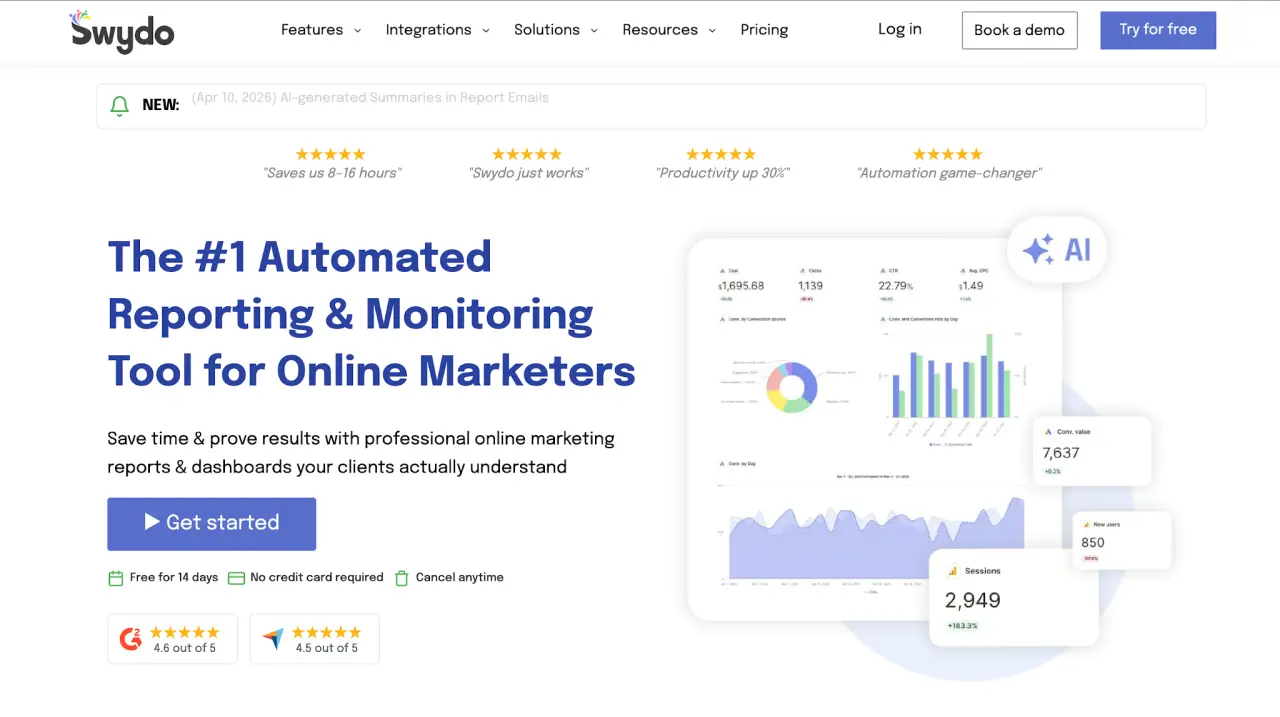
Image source: swydo.com
Swydo turns campaign data into summaries that are easy to read and explain.
Ask a question, and it returns answers that highlight performance shifts, flag issues, and point to what needs attention.
It keeps reports grounded in goals. You can compare results against KPIs, track progress, and share updates that explain performance without walking through every chart.
Key features include:
-
AI summaries that automate data analysis and highlight performance changes
-
Goal tracking with comparisons against KPIs and targets
-
Multi-language report creation and interaction
-
White-label reports with logos, fonts, and branded layouts
-
Templates and widgets for consistent project reports
-
Drag-and-drop interface for combining metrics into visually appealing reports
-
Scheduled delivery for reports generated and sent automatically
-
PDF and online sharing options
5. Databox
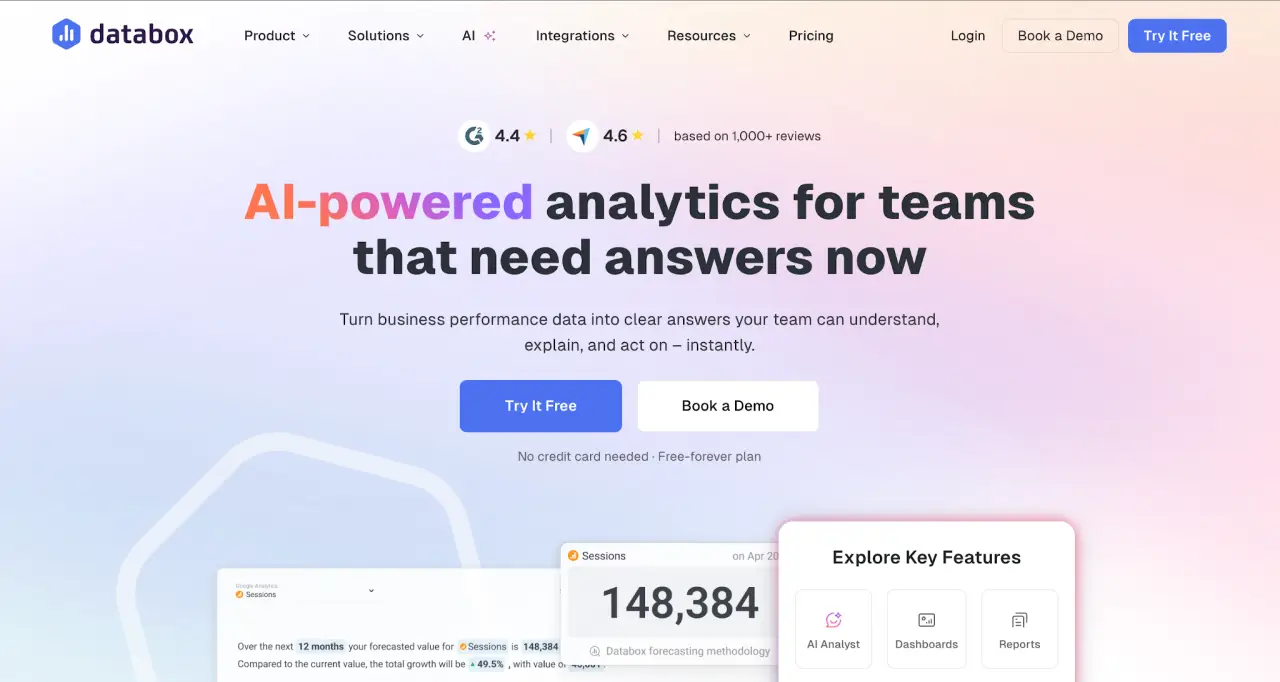
Image source: databox.com
Databox generates reports and presentations automatically using your live marketing data. It collects metrics from tools like Google Analytics, then sends updates through email, Slack, or dashboards without manual input.
Genie, its built-in AI analyst, answers questions about performance in plain language and creates dashboards, charts, and reports from a simple prompt.
It reviews real-time data, explains trends, and adds context so reports include actionable insights.
Key features include:
-
Genie AI for report creation, dashboards, and performance summaries from prompts
-
Automated reports and presentations with scheduled delivery via email or Slack
-
Real-time dashboards and embedded visuals for data visualization
-
Goal tracking with alerts when metrics spike, drop, or fall behind targets
-
Customizable presentations with dynamic metrics, time periods, and branding
-
130+ integrations, including Google Analytics, HubSpot, and Salesforce
-
Centralized reporting workflows that keep KPIs, dashboards, and updates in sync
6. NinjaCat
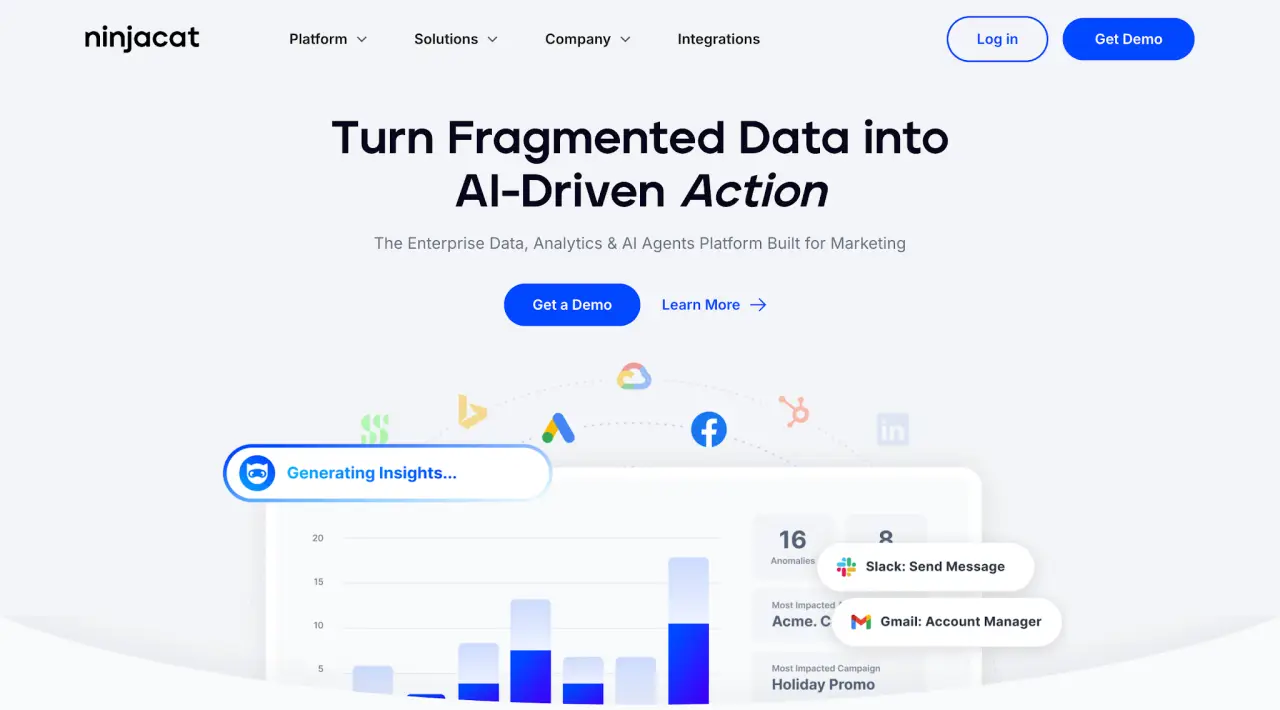
Image source: ninjacat.io
NinjaCat turns unified marketing data into polished, presentation-ready reports for agencies and enterprise marketing groups.
It connects advertising, analytics, web analytics, and custom data sources, then delivers reports with narrative, annotations, and executive-ready layouts.
Its AI Insights Widget writes summaries and data stories, while AI agents automate analysis, detect anomalies, and generate predictive insights based on campaign performance.
Key features include:
-
White-label reporting for reports, dashboards, and emails
-
Roll-up reporting across multiple accounts
-
Markup calculations for agency fees in metrics like cost per click (CPC) or cost per mille (CPM)
-
Packaged integrations, application programming interface (API) options, and code-free replication
-
AI agents for analysis, anomaly detection, predictive modeling, and reporting
-
Data governance with role-based access, validation layers, and quality assurance
Why TapClicks Is the Best AI Tool for Report Generation
TapClicks focuses on report generation from start to finish, not just dashboards or partial outputs.
Turn Metrics Into Clear Takeaways
Many tools still leave reports unfinished. You get charts, then you explain them yourself. TapClicks adds AI-generated content directly into reports, presentations, and emails, so every output includes context, performance highlights, and recommendations.
SmartSlides creates full presentation decks with visuals and narrative insights. SmartEmail sends summaries automatically, so stakeholders can read results without logging into a dashboard.
Bring Report Creation Into One Workflow
Users of other tools have pointed out recurring issues that affect report generation. Reports can take longer to download in Whatagraph, and widgets can break during edits.
Swydo doesn’t always carry over full CRM data, and Databox templates don’t always update for every account. NinjaCat can also take time to set up and configure properly.
TapClicks connects 250+ sources and standardizes metrics automatically, even when pulling from different platforms or data warehouses. It keeps reports consistent without manual fixes and doesn’t require deep technical expertise.
Apply AI at Every Stage of Report Creation
Most platforms limit AI to summaries. TapClicks uses advanced AI models throughout the report creation process.
SmartReports creates repeatable reports with templates and scheduling. Report Studio uses a user-friendly interface with drag-and-drop controls, so even non-technical users can create polished outputs.
AI Insights Agents analyze performance and surface meaningful insights. AI Context lets you upload brand and strategy documents, so reports reflect business goals.
Keep Report Delivery Consistent at Higher Volume
As reporting demand increases, users of other tools mention repetitive updates and integration issues. TapClicks automates report generation, presentation creation, and delivery on schedule.
Reports go out with updated data, narrative insights, and consistent formatting with minimal effort, without rebuilding them each cycle.
Create Polished Reports Faster With TapClicks
An AI report generator should deliver a complete report you can share right away, not a draft that still needs edits.
Many reporting platforms still fall short during initial setup, report updates, or data checks. Missing fields, broken widgets, or rigid templates can interrupt report creation and slow down delivery.
TapClicks covers report generation end-to-end. Its advanced features handle data connection, formatting, and distribution in one place, so reports remain consistent without manual fixes.
The platform also supports data exploration when deeper analysis is needed, while keeping outputs easy to review for both data teams and business users.
There’s no steep learning curve, so reports don’t depend on technical expertise to finish.
TapClicks adds context through written summaries that explain results clearly and create compelling copy for presentations and updates.
Book a TapClicks demo to see how your next report can come together without delays!
FAQs About the Best AI Report Generators
Which AI is best for report generation?
TapClicks is a strong choice for marketing report generation. It turns campaign data into reports, slide decks, and summaries in one workflow, so you’re not assembling outputs manually.
Can ChatGPT create reports?
ChatGPT can create reports when connected to your data or when you provide it. It can generate summaries, explain metrics, and produce visuals using machine learning models.
However, it still needs setup or integrations to match dedicated reporting platforms.
What AI is better than ChatGPT?
Platforms built for report generation handle more of the process. TapClicks, Whatagraph, and Databox use built-in AI features to connect to your data, create visuals, and write summaries without manual setup.