
How to Customize Automated Ad Performance Reports
Customizing automated ad performance reports means selecting the metrics that matter, filtering out what doesn’t, and arranging the layout so the data tells a clear story. Instead of scrolling through generic tables, you get focused insights that help you adjust your campaigns faster and smarter.
Most platforms, like Google Ads and Facebook Ads, let you choose columns, apply filters, and schedule recurring exports. You can also sort by date range, segment by device or audience, and highlight KPIs based on your campaign goals.
In this article, you’ll learn how to build reports that match your priorities, make sense to your team, and give you the answers you need to improve ad performance.
Combine ad data from every platform into one clean report. Book a TapClicks demo today!
How Automation Works in Ad Reporting
Ad platforms like Google Ads and Facebook Ads generate automated reports that update on a regular schedule. These reports pull fresh ad performance and campaign metrics from your account and send them directly to your inbox or dashboard.
You no longer need to build performance reports from scratch or rely on disconnected data pulls.
Each automated performance report includes core metrics tied to campaigns, ad groups, and individual ads. By defining what to include once, you receive a consistent snapshot each time the report runs.
That consistency makes it easier to track changes across each date range and compare results over time.
Most automated reports include:
-
Impressions - Number of times ads appeared.
-
Click-through rate - Percentage of people who clicked.
-
Conversions - Number of completed actions like purchases or sign-ups.
-
Cost per click - Average amount paid per click.
-
Total cost - Total ad spend for the selected time frame.
Platforms let users choose frequency, audience, and filters for each report. Reports can go to internal teams or clients who need to monitor ad performance closely. Automated delivery solves consistency and timing, while customization solves clarity and usefulness.
Ad Platforms That Let You Customize Automated Reports
Each advertising platform offers different ways to adjust the layout, content, and delivery of your automated reports. Some provide drag-and-drop builders, while others use filters and checkboxes to shape the output.
Knowing what customization options are available helps you pull the right data from each campaign and build reports that support better decisions.
Google Ads
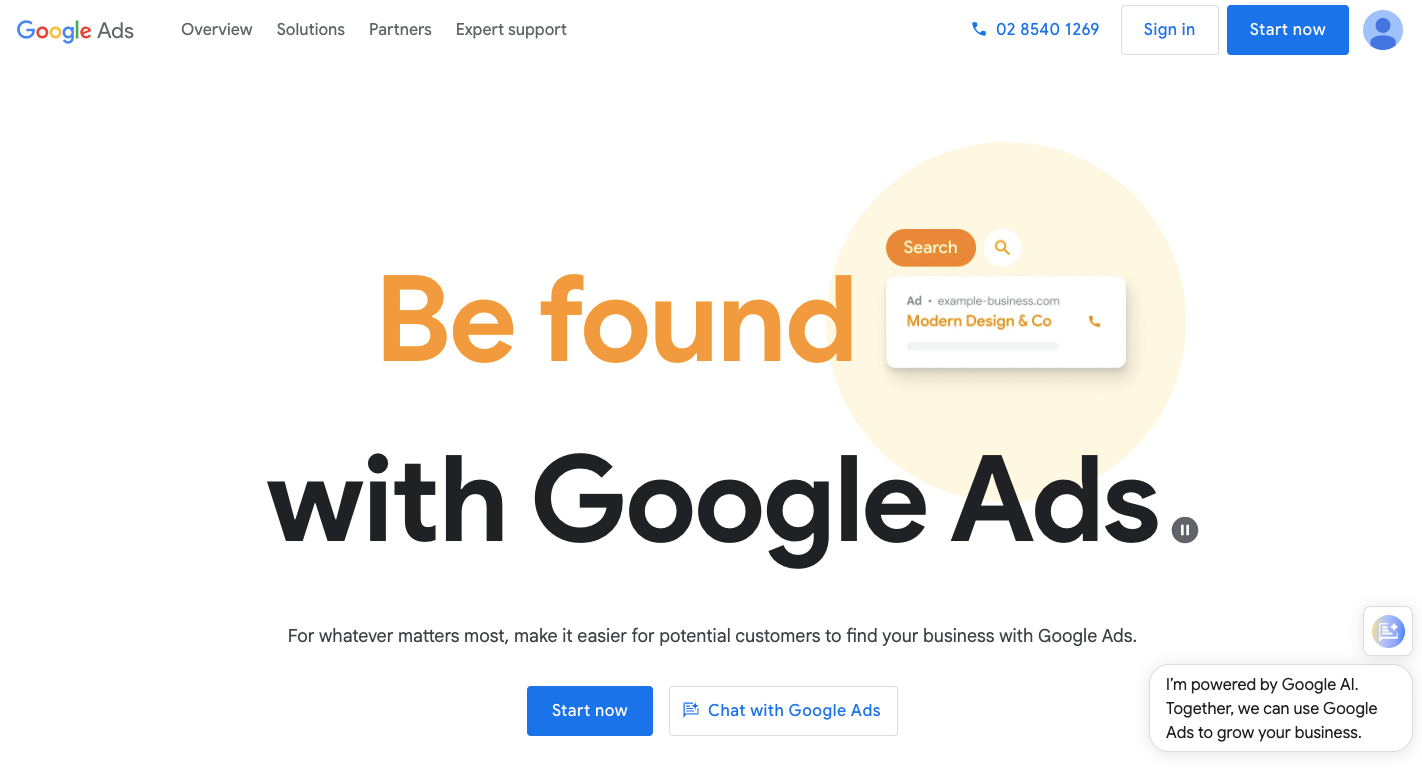
Image Source: ads.google.com
Google Ads offers a detailed reporting system in digital advertising. You can customize and automate reports directly from the dashboard.
With over 8.5 billion searches happening on Google every day, you need a reporting setup that highlights performance fast. Inside your Google Ads account, you can adjust everything from columns to filters, which gives you full control over how your Google Ads campaigns are analyzed.
Customization options include:
-
Column selection - Choose metrics like click-through rate, conversion rates, cost per click, and total ad spend.
-
Filters - Narrow results by campaign type, network, location, or device.
-
Segmenting - Break performance down by ad groups, hour of day, or search term.
-
Date range - Set a custom period or use pre-set options like “Last 7 days” or “This month.”
-
Scheduled delivery - Set automated reports to email weekly or monthly to teammates or clients.
Google Ads also lets users compare performance over time using visual summaries and charts. These tools help spot patterns, track Google Ads performance, and guide budget changes. For agencies managing multiple accounts, custom templates save hours and keep reports consistent.
Meta Ads (Facebook & Instagram)
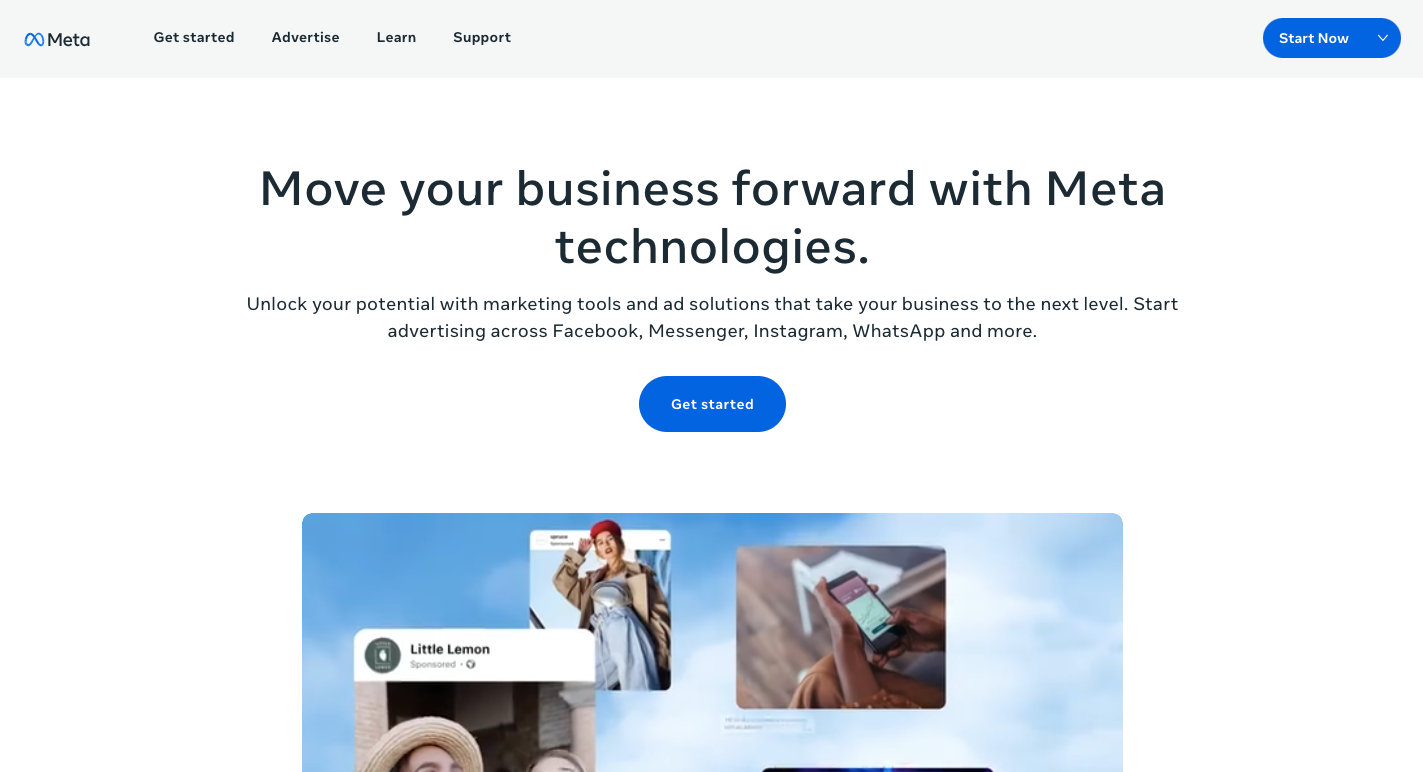
Image Source: business.meta.com
Meta Ads Manager offers several built-in tools to customize ad performance reports. Advertisers running Facebook ads can choose the exact metrics they want to track, apply filters, and schedule reports that deliver consistent data based on a set date range.
Customization options include:
-
Breakdowns - View performance by age, gender, placement, device, or location.
-
Column customization - Add or remove columns like ad clicks, conversion rates, or cost per click based on campaign goals.
-
Filters - Narrow the data by campaign objective, delivery status, or audience segment.
-
Time comparisons - Compare data across timeframes to spot trends and shifts in performance.
-
Scheduled exports - Set recurring reports to go to specific emails, so clients or teams always stay informed.
Meta further supports dynamic creative testing, which creates multiple ad versions and tracks performance for each variation. That makes accurate reporting even more important.
By selecting the right filters and focusing on relevant columns, you get reports that show ad performance clearly.
LinkedIn Ads
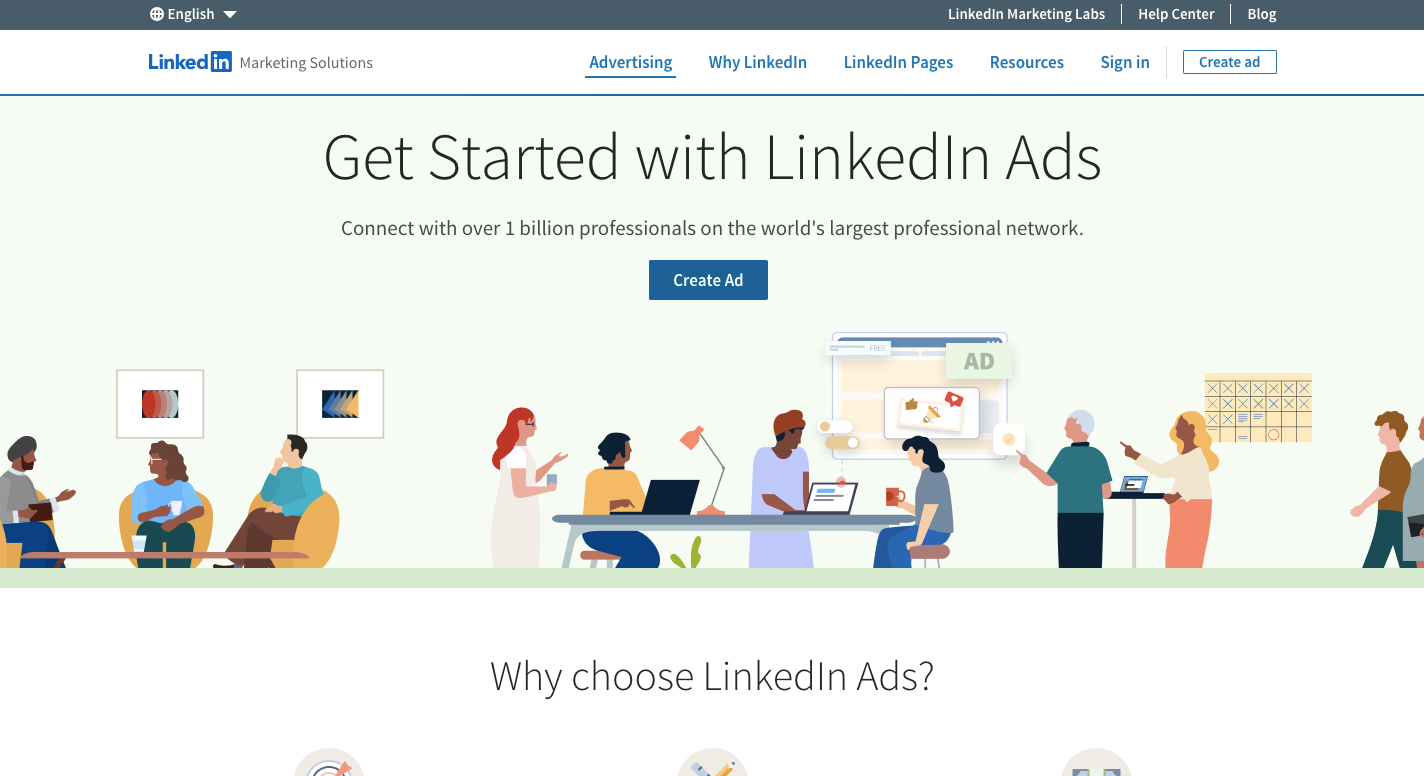
Image Source: business.linkedin.com
LinkedIn Ads reports give B2B marketers access to detailed ad performance data with customization built into the platform. Since targeting often includes job titles, industries, or company sizes, the reporting setup supports filters that match those audience layers.
You can build performance reports that focus on how well each campaign connects with its intended target audience.
Customization options include:
-
Column editing - Choose metrics like impressions, ad clicks, conversion rates, and cost per click.
-
Audience filters - Filter results by industry, seniority, company size, or geography.
-
Segmenting - Break down data by campaign, objective, or date range.
-
Comparisons - Analyze results from one specific campaign against another.
-
Export features - Download or email scheduled reports to share with stakeholders or clients.
It also tracks the performance of lead gen forms, message ads, and sponsored content. With that variety, reports can include multiple ad formats in a single view. For marketing teams focusing on B2B, these options help highlight what’s working and point out where budgets need to shift.
Microsoft Ads (formerly Bing Ads)
Image Source: ads.microsoft.com
Microsoft Ads offers a flexible reporting setup that works well for advertisers managing search and display ad campaigns across its network.
The platform reaches more than a billion people globally through MSN, Outlook, and partner sites, so accurate data matters just as much here as it does in larger ad networks.
Advertisers can build automated performance reports using platform filters and column selectors. Reports can focus on individual ad groups, entire campaigns, or account-level activity.
Customization options include:
-
Column controls - Add metrics like cost per click, conversion rates, average position, or total cost.
-
Filter settings - Limit data by keyword match type, location, or device.
-
Date range options - Apply rolling or fixed ranges to measure performance over time.
-
Recurring delivery - Set reports to arrive on a schedule, which eliminates repeat setup.
-
Multiple formats - Export reports in an easy-to-understand format to clients or internal marketing teams.
Advertisers often use Microsoft’s reporting tools to compare branded and non-branded keyword performance. Reports that focus on high-impact ads reveal spending patterns, shifts in engagement, and opportunities to optimize the next round of content.
TikTok Ads Manager
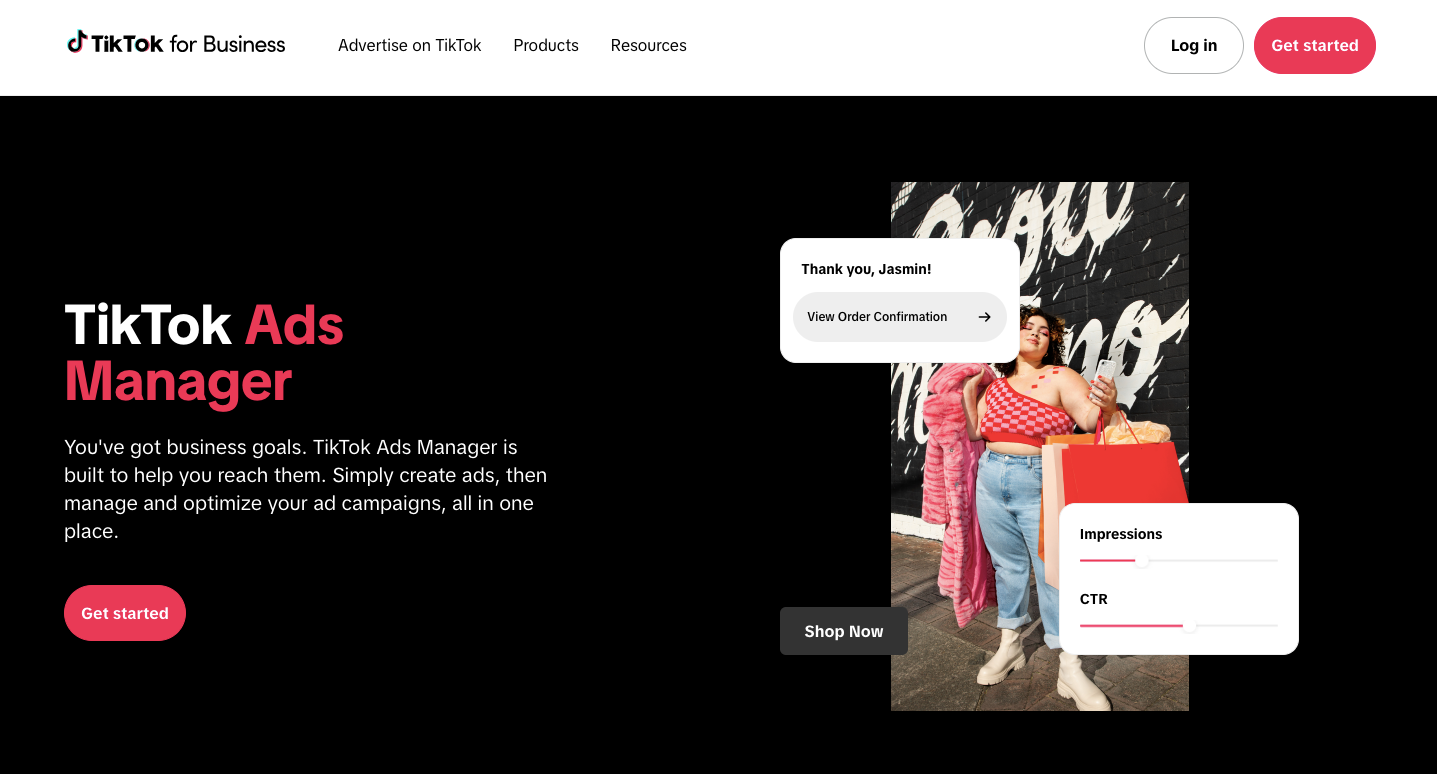
Image Source: ads.tiktok.com
TikTok Ads Manager offers advertisers the flexibility to build custom reports that fit the platform’s fast-moving, visual format.
With over 1.59 billion active users worldwide, TikTok generates high volumes of ad data daily. Sorting through that data without a clear structure wastes time and hides key patterns that could improve campaign results.
Marketers can choose the metrics they need, apply filters, and automate delivery so reports reflect only what’s relevant.
Customization options include:
-
Metric selection - Include indicators like impressions, ad clicks, click-through rate, and conversion rates.
-
Creative-level performance - Review how each video performs across different placements.
-
Audience filters - Sort by age, gender, interests, or device type.
-
Date range - Focus on specific time frames to isolate changes or compare periods.
-
Scheduled delivery - Send reports automatically to internal teams or clients.
These tools help provide actionable insights by making trends easier to spot across campaigns. Rather than getting buried in bulk exports, you see only what you need to refine strategy and shift spending toward content that delivers.
How to Customize Automated Ad Performance Reports
Customization helps you cut through the clutter and focus on what matters. By selecting the right metrics, filters, and layout, you can build reports that match your campaign goals and make your ad performance easier to understand and act on.
Define Your Campaign Goals
Every report starts with a clear purpose. Before adjusting any settings, know what success looks like for your business. A lead generation campaign may focus on conversions, while a brand awareness push may look at impressions and engagement.
Setting clear goals makes sure your reporting stays aligned with real outcomes. Ask these questions: What do you need to learn from the report? Who is going to use it? What action should it support?
Identify Your Primary and Secondary Key Performance Metrics
Once you’ve defined your goals, select the key metrics that reflect them. Use your primary metrics to track progress and secondary metrics to support context. For instance, if your goal is to drive traffic, focus on how many clicks you get, but also keep an eye on bounce rate or time on site.
Align your choices with relevant KPIs so your reports lead to clear decisions, not just numbers on a page.
Choose Dimensions to Segment Your Data
Segmentation helps uncover insights by breaking down your results into useful views. You can split data by device, region, ad format, or audience type. Doing it lets you identify trends in behavior and spot which variables affect outcomes most.
For example, segmenting by device might show that mobile users convert more often, guiding future creative and bid adjustments.
Select the Right Columns and Filters
Avoid stuffing your reports with every available metric. Focus on what helps you understand performance. Include different metrics based on the campaign type, like average CPC for search ads or view-through rate for video.
Apply filters to limit noise and lock in clarity. For instance, focus on a specified date range or narrow the report to one specific campaign.
Choose Report Frequency
Decide how often you need updates. Daily reports work well for short bursts, but most teams prefer weekly or monthly summaries. Match frequency to the speed of your campaigns and the decisions they drive.
When pulling from multiple data sources, keep update cycles consistent so everything stays in sync.
Format the Report Layout
A strong layout makes results easier to understand. Group similar metrics together and label sections clearly. Add headers, bold titles, and spacing to improve flow.
Using tools like Google Sheets allows you to link multiple sources and apply custom formulas for richer reporting. Structured reports help others see what the data means without extra explanation.
Automate and Schedule the Report
Set up recurring exports to email reports on a set schedule. That removes manual steps and keeps your team or clients updated. Most platforms let you choose format, file type, and delivery day.
Automation saves time, but clarity wins trust. Well-built custom reports deliver valuable insights that teams can use to act faster and smarter.
2 Ways TapClicks Helps Automate Ad Campaign Reports
There are two ways TapClicks automates your ads across different platforms.
1. Connects to Over 250 Marketing and Ad Platforms
Most reporting tools limit integrations, which forces teams to manually pull ad data from platforms like Amazon Ads or radio buys. That slows down reporting and increases errors.
TapClicks solves this with 250+ instant-on connectors, covering major platforms like Google Ads, Facebook, LinkedIn, and niche networks such as Adroll and AppNexus.
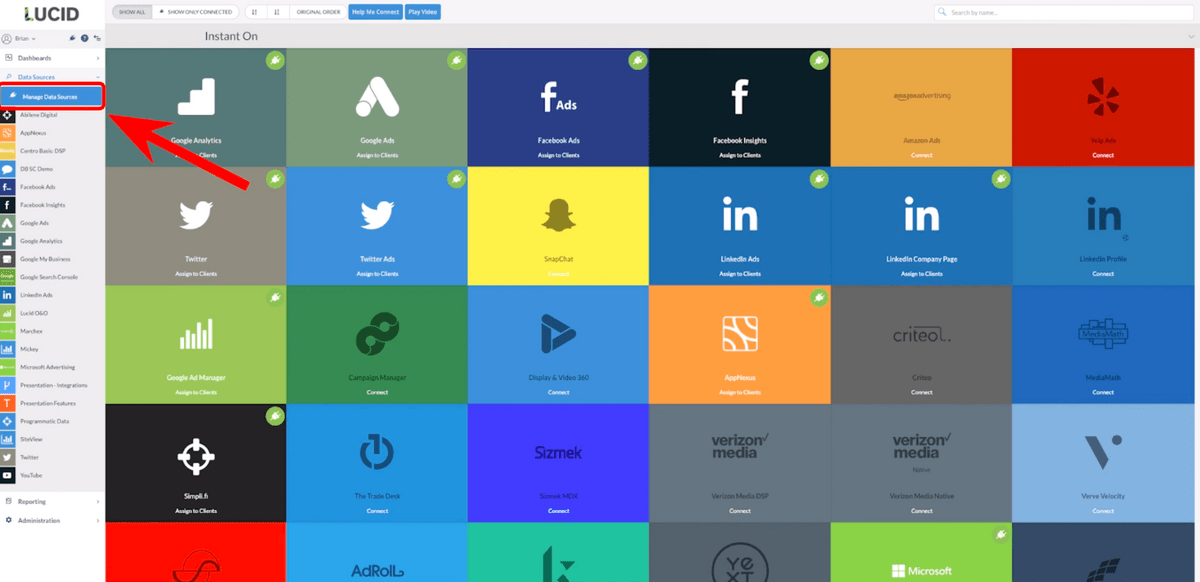
With these integrations, teams can:
-
Import data automatically
-
Access both digital and traditional sources
-
Backfill 12 months of historical data
-
Keep metrics updated in real time
Smart Connectors handle unsupported platforms by syncing data daily. TapClicks manages API updates, so teams don’t waste time on technical setup.
By combining all sources into one view, marketers can spot patterns faster and build more accurate, complete reports.
2. Automates Dashboards and Marketing Reports
Manual reporting drains time. Pulling data from multiple sources, calculating key metrics, designing charts, and formatting everything for clients or internal use is repetitive and error-prone.
TapClicks automates the entire process. Once data flows in, teams can:
-
Set custom calculations directly in the platform
-
Apply graphs, widgets, and visual elements
-
Build and save report templates that scale
You can reuse templates across campaigns or clients, and schedule them to refresh daily, weekly, or monthly. No more building from scratch.
Automating reporting lets marketers shift focus from formatting to insights. Reports stay current and accurate without manual effort, giving teams more time to act on valuable insights.
Take Control of Your Campaign Performance Data With TapClicks
TapClicks simplifies the way teams manage, report, and act on marketing data. By combining automated data imports, custom calculations, and scheduled reports in one place, it removes the need for scattered tools or manual workflows.
The platform offers over 20 dashboard templates built for platforms like Google Ads, Facebook, and Shopify. Each one is white-label, so you can match layouts, colors, and branding to your clients’ or internal needs.
You can:
-
Track all campaigns across platforms from a single dashboard
-
Pull in data from hundreds of sources automatically
-
Build reports that update and send on a schedule
-
Use historical data to guide current decisions
For agencies managing multiple clients or internal teams handling dozens of ad campaigns, TapClicks delivers a clear and scalable reporting system.
FAQs About Automated Ad Performance Reports
How to track ad performance effectively?
Start by setting clear goals and matching them with the right metrics, such as click-through rate, conversion rates, and cost per click. Use native dashboards from platforms like Google Ads or connect them with Google Analytics to see how users behave after the click. Consistent tracking periods and clean segmentation help you measure what’s improving and what needs attention.
How do I automate Facebook ads reporting?
Inside Meta Ads Manager, you can create custom reports by selecting specific metrics, breakdowns, and filters. Then schedule these reports to be emailed daily, weekly, or monthly. If you’re managing multiple accounts, TapClicks can connect your Facebook Ads data, format it with reusable templates, and automate delivery to your team or clients.
Is $10 a day enough for Google Ads?
Yes, but only with the right strategy. A $10 daily budget works best for tightly focused Google Ads campaigns, such as branded keywords or local targeting. You’ll get fewer clicks, so your setup needs to be efficient. Monitor ad performance closely and adjust based on results.
How do I track my display ad performance?
Use the reporting tools within platforms like Google Ads to track impressions, average CPC, view-through conversions, and placement performance. For deeper analysis, pair this with Google Analytics to see what actions users take after viewing or clicking the ad. Comparing display results against search or social helps you decide where to adjust your budget.